HAL Id: halshs-00556670
https://halshs.archives-ouvertes.fr/halshs-00556670
Preprint submitted on 17 Jan 2011
HAL is a multi-disciplinary open access archive for the deposit and dissemination of sci-entific research documents, whether they are pub-lished or not. The documents may come from teaching and research institutions in France or abroad, or from public or private research centers.
L’archive ouverte pluridisciplinaire HAL, est destinée au dépôt et à la diffusion de documents scientifiques de niveau recherche, publiés ou non, émanant des établissements d’enseignement et de recherche français ou étrangers, des laboratoires publics ou privés.
Trading Arrangements Application for ASEAN
Members under an ASEAN-EU FTA
Céline Carrere, Jaime Melo De, Bolormaa Tumurchudur
To cite this version:
Céline Carrere, Jaime Melo De, Bolormaa Tumurchudur. Disentangling Market Access Effects of Preferential Trading Arrangements Application for ASEAN Members under an ASEAN-EU FTA. 2011. �halshs-00556670�
Document de travail de la série Etudes et Documents E 2008. 28
D
D
IISSEENNTTAANNGGLLIINNGGM
M
AARRKKEETTA
A
CCCCEESSSSE
E
FFFFEECCTTSSOOFFP
P
RREEFFEERREENNTTIIAALLT
T
RRAADDIINNGGA
A
RRRRAANNGGEEMMEENNTTSSA
A
PPPPLLIICCAATTIIOONNFFOORRA
A
S
S
E
E
A
A
N
N
M
M
EEMMBBEERRSS UUNNDDEERRAANNA
A
S
S
E
E
A
A
N
N
-
-
E
E
U
U
F
F
T
T
A
A
** Céline Carrère+ Jaime de Melo♣ Bolormaa Tumurchudur♦ November 2008 + CERDI and CNRS ♣University of Geneva, CERDI and CEPR
♦
University of Lausanne
∗
This is a revised and shortened version of Carrère et al. (2008) prepared under funding from the World Bank. We thank Olivier Cadot, Mona Haddad, Richard Newfarmer, Marcelo Olarreaga and two anonymous referees for comments on an earlier draft. All remaining errors are our own.
Abstract
The paper develops two synthetic measures at the HS-10 level to depict effective market access for a country receiving preferential access and applies these to the market access ASEAN members would receive on impact following the
implementation of an FTA with the EU. First, the measures show that current effective market access for ASEAN EBA members is cut in half by the preferences granted by the EU to countries that compete with these countries in the EU markets. Second, the measures show that about one quarter of the preferential margin under the proposed FTA for EBA members would be lost as a result of preferential access granted to ASEAN GSP members. Third, disaggregated estimates of the
restrictiveness of rules of origin confirm that rules are more restrictive for products with higher preferential margins and that ASEAN countries usually face tougher rules of origin in the EU because of the composition of their exports.
JEL classification: F13, F15
1 Introduction
In May 2007, the Association of South East Asian Nations (ASEAN) Economic Ministers and the European Union Commission agreed to enter into free trade area (FTA) negotiations on a region-to-region instead of a bilateral approach that would take into account the different levels of development of ASEAN members. These negotiations were launched against a backdrop of falling trade shares between the two regions (according to the ASEAN statistical yearbook, the EU share of the ASEAN-6 exports fell from 15.3% in 2001 to 13.2 in 2004 while the corresponding
ASEAN import shares fell from 12.6% to 11.3%)1. If there is more to the FTA signing
than market access, trading on a preferential basis with one’s main trading partners remains among the main objectives on both sides and this was clearly mentioned when negotiations were launched. In brief, like other FTAs recently negotiated around the world, one of the intents of the EU and ASEAN in their negotiations is to level the playing field and exchange market access at the expense of other trading partners.
1 The Association of South East Asian Nations (ASEAN) was established in 1967 by five founding members (Indonesia, Malaysia, the Philippines, Singapore and Thailand). It currently has 10 members (dates of membership in parenthesis): Brunei Darussalam (1984), Cambodia (1999) Lao (1997), Myanmar (1997) and Vietnam (1995). It has a population of 560 million which is slightly larger than the 460 million for the European Union (EU-25). Valued at market exchange rates of 2006 and adjusted for Purchasing Price Parity (PPP), the respective GDP of ASEAN and EU-25 were 2 800
Also, like the majority of countries around the world, the EU and the ASEAN
members are actively participating in several preferential trading arrangements. They also belong to the World Trade Organization (except for Laos). Most ASEAN
members also receive non-preferential market access under the Generalized System of Preferences (GSP) scheme from Canada, the European Union (EU), Japan and the United-States. In all these instances, benefiting from market access requires proving origin which itself is costly and reduces the benefits from that market access. In their negotiations with the EU, from the point of view of expected penetration to the EU market, the key issue facing ASEAN members is how much access can they expect from entering a FTA? This will depend on several dimensions of EU trade policy, including their tariff policy towards other trading partners and the Rules of Origin (RoO) in place. Both effects can be quantified and, as shown in this paper,
disaggregated quantification alters substantially the picture of effective market access provided by the standard unadjusted measures used in the negotiations.
Ex-ante, partial or general equilibrium analysis in a multi-country setting is the preferred tool to measure the extent of market access resulting from trade policy changes. For example, in their evaluation of the likely effects on market access and welfare of an ASEAN-EU FTA, CEPII –CIREM (2006), use a general equilibrium world model with 12 regions and 33 sectors. On the basis of a carefully calibrated model in which trade restrictions (other than NTBs on trade in goods) are aggregated from detailed data at the HS6-level into average tariff equivalents (AVE) that
incorporate the effects of specific tariffs and tariff-rate quotas, the study concludes that all ASEAN countries would gain in terms of welfare from the FTA, notably because of the differential market structure assumed across sectors. With increasing returns to scale assumed for industry and constant returns to scale in other sectors,
trade integration with the EU would lead to a shift of resources towards industry
resulting in increased scale efficiency.2
While useful, the level of aggregation in these studies masks the differential impact of similar preferential access across partners. Considering that, on average each country around the world is engaged in 5 preferential agreements and that the extent of multi-country membership is increasing rapidly with up to 20% of positive MFN tariffs covered by preferential trading agreements (World Bank 2005), it is useful to develop measures that capture the impact of preferential schemes on market access. This is the objective of this paper.
The paper develops two synthetic measures to depict effective market access for a country receiving preferential access and applies these to the market access ASEAN members would receive on impact (i.e. before adjustment takes place in product and factor markets) following the implementation of an FTA with the EU . First we use a more complete measure of preferential access by taking into account that trading partners grant market access to many other partners as well (especially in the case of the EU but also for other developed countries) so that the effective market access is less than the difference between the MFN and the preferential tariff. Second, we rely on recent work measuring the restrictiveness of requirements to establish origin (i.e. Rules of Origin) to qualify further the extent of actual market access under a
2 Changes in model closure can of course isolate the importance of such built-in market structure effects. Also some simulations models have incorporated the effects of RoO (see e.g. Francois, Hoekman and Manchin (2006). Gravity models are also used routinely to quantify market access ex-post, with dummy variables used to control for membership in a PTA (e.g. Carrère, 2006) sometimes
preferential market arrangement. Key to the contribution is that these measures are constructed at the most disaggregated level possible, i.e. 10 for EU tariffs and HS-6 level for EU Rules of Origin (RoO). While at this high level of disaggregation
analysis is descriptive, it minimizes biases resulting from aggregation and serves as a complement to the other approaches used to measure preferential market access. The paper thus concentrates on developing ways to condense and convey that
disaggregated information.
When applied to the proposed ASEAN-EU FTA, these measures reveal quite a
different picture than one that would be gleaned from the more aggregate approaches mentioned above. To summarize the main results, our impact measures show that current effective market access for ASEAN EBA members is cut in half by the
preferences granted by the EU to countries that compete with these countries in the EU markets. We also show that the proposed FTA to the EU would lead to gains in access for some partners and to losses for others within the ASEAN group, that
“significant” preferential margins are almost always for products that account for less than 1/10 of 1 percent of exports (at the HS-10 level). About one quarter of the
preferential margin under the proposed FTA for EBA members would be lost as a result of preferential access granted to ASEAN GSP members. .Disaggregated calculations on the restrictiveness of rules of origin not only confirm that rules are more restrictive for products with higher preferential margins, but also that, for a given preferential margin in the EU market, due to the product composition of their exports to the EU, ASEAN countries usually face tougher rules of origin in the EU.
The paper is organized as follows. Section 2 summarizes the situation of the different ASEAN members in the trading system. Section 3 introduces the preferential access
measures that are applied at the Hs-10 level in section 4. Section 5 brings in rules of origin and section 6 concludes
2. ASEAN countries in the EU trading system
Except for Singapore, all ASEAN members get some preferential access to developed-country markets. In terms of preferential access, it would appear that the EU is the most generous since it gives the Generalized System of Preferences (GSP) and free-trade status (with the “Everything but Arms” –EBA –scheme) to the three
low-income countries, Cambodia, Laos and Myanmar. The EU has trade agreements with virtually all countries in the world. These agreements fall under three layers (number of countries in parenthesis and [ASEAN members in brackets]).
The most preferred group. This group benefits from a trade agreement that is superior to the standard GSP(92). It includes not only Cotonou (21) and (non-Cotonou) EBA(9) [Cambodia, Lao, Myanmar] members, but also the EU’s regional and bilateral trade agreements with its neighbors, Turkey, EUROMED countries, and countries further away like South Africa, Chile, and Mexico. Finally, the EPA
negotiations covering ACP countries and scheduled for completion in the near future also belong to this group.
The middle group. This is the GSP(92) [Brunei, Indonesia, Malaysia, Philippines, Thailand and Vietnam] group that is party to the standard GSP preferences but of no other regime. As shown in table 1, these preferences are less than those accruing to the “inner circle” above.
The least preferred group. This group comprises the industrialized countries [Singapore] that trades with the EU on a MFN basis.
This categorization of EU preferences into “three circles” shows that ASEAN
countries belong in each group and therefore have heterogeneous differential access to the EU market under the current trade regime. It is thus clear that the proposed FTA with the EU will erode preferences for the low-income countries in ASEAN vis-à-vis other ASEAN members. In relative terms at least, it is to be expected that there will be effective gain in market access for the ASEAN partners that do not get EBA status.
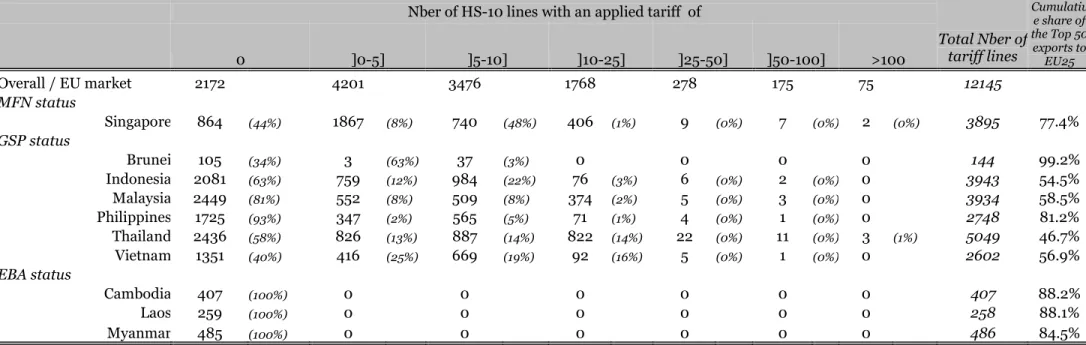
Table 1 here: Distribution of Applied Tariffs, HS-10, 2004
The ASEAN group is heterogeneous both in terms of economic size and level of development. This diversity is reflected in their exports to the EU. For one group of countries including Brunei, Cambodia, Lao, Philippines and Singapore exports to the EU are quite concentrated with the top 50 products at the HS-10 level accounting for close to ¾ of the export share (see table 1, last column). The other group including Indonesia, Malaysia, Thailand and Vietnam is more diversified with the top 50 products accounting for less than 50% of their export share to the EU. The next-to-last column indicates the number of tariff lines for which each ASEAN country had positive exports to the EU in 2004 (the EU has 12,145 tariff lines at the HS-10 tariff level).
It is already clear from table 1 that the potential market access to be gained is
tariff lines for which the applied tariff is above 10 percent ad-valorem, while for Indonesia the corresponding number is only 84. However, this perception of market access is complicated by the fact that the EU grants preferential access to many partners. These aspects are taken into account the measures introduced below.
3 Measuring Market Access
Start first with a measure of preferential access for an individual HS-10 level product not taking into account preferences granted to other partners. Call this measure the
unadjusted preferential access measure,
τ
i and express it as a percentage of thetariff inclusive price (for country k) as:
, , , 100 MFN k PREF k k i i i PREF k i t t t
τ
= − + (1)ti being the ad-valorem MFN or Preferential tariff (in %) on product i exported by
country k to the EU market.
As computed in (1), preferential access is measured as the difference (expressed in %) between the tariff faced by an MFN exporter and the tariff faced by an ASEAN
member when it exports to the EU. According to expression(1), as it should be, the preferential margin is zero for products with zero MFN tariffs. Thus, on average, countries facing exporting products with low MFN tariffs and many zero tariff lines (such as Philippines or Malaysia) are unlikely to get much additional preferential market access from an FTA, although the FTA could lead to new products being exported. This is a more meaningful measure of market access than alternative
simple difference in the tariff rate which does not take into account the height of the
MFN tariff of the preference-granting trade partner. 3
However, as first pointed out by Low et al. (2005), for countries like the EU that extend preferential access to many trading partners, one should measure the
preferential access against the effective tariff paid by all other exporters to the EU at that tariff line level. Call this measure for a country
k and product i, the adjusted preferential access measure
τ
% , (Low et al. call it the ik“competition-based preferential access” measure):
(
)
(
)
, , , , , , ; 100 ; / ; ; 1 EFF k PREF k k i i i PREF k i EFF k MFN PREF MFN i j PREF j i j j MFN MFN T MFN j j PREF t t t t t t M M j kτ
θ
θ
θ
θ
θ
− = + = + ≡ ≠ + =∑
∑
∑
% (2)M being the import value to EU
Expression (2) recognizes that when computing preferential margins for country k and product i, the margin should be computed on the basis of the effective tariff paid
3
To see the difference consider product A where the MFN tariff is 2% and product B where the tariff is 50%. In both cases, suppose that the ASEAN country is faced with a tariff that is half the MFN tariff rate. Computing preferential access, as the percentage difference in tariffs would yield a 50%
preferential margin. However, according to(1), for product A, the preferential margin is less than 2% while for product B it is evaluated as a 20% preferential margin. Computing the preferential margin as the simple difference between MFN and partner tariffs would give a similar measure for preferential access when tariff rates are small, though in the case here for product B, the difference is smaller.
on the corresponding tariff line i which is the MFN tariff less the EU import
share-weighted imports from other preferential beneficiaries, j ( j≠k).These are
approximated by the market shares received by ACP, EBA and other beneficiaries of bilateral FTAs with the EU (e.g. EuroMed, Chile, South-Africa).
According to this formula, adapted from Low et al. (2005), a country like Singapore that pays the MFN tariff receives less preferential access than competing exporters to the EU and gets a negative preferential margin, unless all other countries selling to the EU for that tariff line are also MFN. If there is some differentiation, then there is competition among recipients of preferences. If however, at this very disaggregated level, one considers that goods from different origin are near homogeneous, then as long as the EU market is not saturated, then there would be no competition among preference receivers and the adjustment proposed by the formula would not be necessary or would represent an overstatement of the extent of market access loss.
Finally, to compare the change in preferential market access from implementing an FTA with the EU, we aggregate up across products and compare the extent of access on the EU market across ASEAN countries. For each country k, the aggregate gain,
k
G , is computed at the HS-10 level and then averaged at the country level, using as
weight the current export value according to:
(
)
k k k k
i iFTA i i
G =
∑
θ τ% −τ% (3)where all gains are expressed in percentage points and :
k i
θ : share of the product i export in total export value of country k;
k
k iFTA
τ% : Adjusted preferential access for product i and country k under the ASEAN-EU
FTA assumption (i.e. assuming a zero applied for the 10 ASEAN countries).
Expressions (1)-(3) will now be evaluated for each ASEAN country’s sales to the EU in 2004. These expressions are evaluated twice, first to measure current market access, then to measure the change in market that would result from the proposed ASEAN-EU FTA. In computing the adjusted market access, we assume that the ASEAN-EU already has FTAs with Mexico, Chile, South-Africa, Turkey and the EuroMed countries, all of which are assumed to pay zero tariffs (in reality some products are excluded, but so will some product lines be excluded from the ASEAN-EU FTA).
4. Market Access under an ASEAN-EU FTA
Table 2 reports the aggregate value of the measures of actual and potential market access by ASEAN members in the EU market computed in the paper. Leaving aside for now, the interpretation of the RoO index in column 6, column 1 computes the so-called “value” of preferential access often used in the literature (e.g. Brenton (2003) under the twin assumptions of full utilization of preferences and that the unadjusted preferential margin is the correct measure of preferential access. The estimates are low, reflecting the low average protection rates facing MFN suppliers in the products exported by GSP and EBA beneficiaries (around 3.5% percent).
Table 2 here: Preferential Margins, adjusted and Unadjusted under Different Preferential Schemes
Turning to the actual preferential margins in columns 2 and 3 several informative patterns emerge from the comparison of unadjusted and adjusted margins. First, only the EBA group really has substantial preferential access, and that preferential margin is halved once one takes into account that the EU is also granting
preferences to other exporters that are competing with ASEAN countries in the EU market (columns 2 and 3). Thus the unadjusted 11% preferential margin is reduced to around 5% when factoring in the preferences that are also granted to competing countries. Second, a different pattern emerges for the GSP group (Brunei,
Indonesia, Malaysia, Philippines, Thailand and Vietnam). While the unadjusted preference margin ranges from 0.1% (Brunei) to 2.6% (Vietnam), the adjusted one is always null or negative, ranging from 0 (Malaysia, Philippines) to -1.1% (Brunei). Thus, the GSP group is in effect penalized by the current system of EU preferences. Third, Singapore’s market access is little affected by the EU’s preferential policies. This is because almost half of Singapore’s exports face a zero MFN tariff in the EU.
Columns 4 and 5 quantify how preferential access would be affected by the implementation of the proposed ASEAN-EU FTA. The largest beneficiaries are Vietnam and Thailand, both in the GSP group, the large gains in market access reflecting the fact that a small share of their exports face zero MFN tariffs in the EU (see table 1). On the other hand, the small gain for Indonesia and Malaysia reflects a concentration of their exports on zero-MFN tariff lines. Market access gains are estimated to be cut in half or more for several countries because of market access granted by the EU to other trade partners competing with ASEAN members.
their exports to the EU. However, to the extent that they compete with non-EBA ASEAN members, they incur a loss of market access . Comparing columns 3 and 5 indicates that EBA members lose about ¼ of their preferential margin to GSP ASEAN members.
But negotiators would likely want to know more about the first-round impact of this change in market access since a high preferential margin on products that count little, reflects a small “value” for these preferences. They might also want to know if the change in market access resulting from the FTA mostly affects HS-10 products with negligible market share (nothing can be surmised about developments at the extensive margin from an impact analysis based on current market shares). Or they might want to know if products that are candidates for exemption from preferences during the negotiation, count a lot.
To answer these questions, the most disaggregated data is necessary since it is at this level that exemptions are negotiated. Figure 1 proposes a “new” representation of the distribution of preferential access across products. It reports the cumulative preferential margins (unadjusted and adjusted) for the top 100 products ranked by decreasing shares in total exports for each ASEAN country’s sales to the EU in 2004. More precisely, figure 1 reports for each export line k of the Top 100 export HS-10 digit items to the EU25 in 2004 according to:
1 1 1 100 100 1 1 1 ; ; 0 1 ; 1 k k k n n n
Unadj n Adj n n Unadj Adj
n n k N n n n n i i n n n n x T or T X T T x τ τ τ τ = = = = = = = = = < < <
∑
∑
∑
∑
∑
∑
% (0.4)with cumulative export shares ranked in decreasing order, i.e.xk >xk+1 and N is the
total number of product exported towards the EU. Note that Unadj
k
T is normalized so
as to fall in the range [0; 100%] over the top 100 export HS-10 digit items. To ease
the comparison, adj
k
T is also normalized by the cumulative unadjusted preferential
margins of the Top 100 export.4 Hence, as indicated in (0.4), adj
k
T is bounded
between 0 and 1 on the up side but not bounded on the down side.
Given that the sum of the value of exports for the top 100 products is very close to total exports (except for 3 GSP countries and Singapore), and our selection of normalization, in effect, figure 1 traces “Lorenz-like” curves in the
export/preference-margin space. Thus, just like a standard Lorenz curve depicting the extent of income inequality, the more convex the curves, the more skewed preferences are towards products that count little in the total value of exports. The curves, however, are not Lorenz curves: first the cumulative export shares do not add up to the same total (this is a deliberate choice to show the market share covered by the top 100 products for each country) so that the slopes of the curves are not strictly comparable, and the shares on the horizontal axis are not the same (e.g. quintiles or deciles).
As a reference, suppose that each product had a preferential access proportional to its share in export value. Then the solid unadjusted black line would bisect the
graph (i.e. correspond to the 450 for the countries where the top 100 products
exhaust all exports to the EU) Hence, once the products are sorted in decreasing order (in terms of export value), the more convex is the solid black curve below the diagonal, the more preferential access is biased towards products with small export shares to the EU.
Following the presentation in table 2, figure 1 is broken down into two groups: EBA (and Singapore for contrast) in figure 1a and the GSP group in figure 1b. In each graph, the solid lines depict the export-preferential-margin relation under the current EU preferential regime while the dashed lines trace the corresponding export-preferential-margin relation under the counterfactual regime with an ASEAN-EU FTA.
Before comparing the curves across countries and across preferential regimes, observe a common pattern in all graphs: the steepness of the curves as one
approaches the last 10 products or so. Those are the products that would gain the most preferential access but they are also currently negligible in the export basket, never reaching 1/10 of one percent of export value. Indeed, if one excludes Brunei and Singapore, only Thailand and Vietnam would get non-negligible preferential access for current top 5 products (meat and motor vehicles for Thailand, and bicycles and men’s cotton shirts for Vietnam). This pattern reflects the workings of political-economy motives in the determination of rent transfers granted through preferential market access: tariff preferences are granted to sectors and products in which they
face little competition, i.e. usually to sectors and products that export negligible amounts to the EU.
Figures 1a and b here: Cumulative Exports Against Cumulative Preferences
Turn now to the different patterns. Start with the current situation, i.e. the “solid” gray and black lines. As an example, take Cambodia, the first country in the EBA group (figure 1.a). The curve is very convex indicating that the most important exports do not receive any preferences. Indeed, the most important product (Jerseys, pullovers, cardigan and waistcoats) exported by Cambodia represents 24.2% of its total exports to EU. Note also that the curves usually trace a
continuous smooth line with no clear horizontal “steps”, reflecting the fact that (in contrast with Singapore) EBA countries, only export a few tariff lines with zero
MFN tariffs (i.e. zero preferential margins).5 The short length of the horizontal lines
indicates that the corresponding export shares with zero MFN tariffs are small. Overall, the shape of the curves for the EBA group stands in sharp contrast with the corresponding ones for the GSP countries depicted in figure 1b.which are initially flat and close to the horizontal axis indicating no preferential axis for the major export products.
5 A “vertical jump” in the curve would then reflect a large preference for the corresponding product, and inspection of these “Lorenz” curves can be used to spot “important” products in terms of preferential margins. This is clear for the adjusted market schedule for Thailand in figure 1b. It registers a large negative “vertical jump” at around 30% of export value. It reflects the large value for the MFN tariff (134% applied tariff for the line “Fresh, chilled, frozen or dried roots and tubers of manioc” (0.9% of total value exports). This leads to a jump in the adjusted preferential margin of
-Compare next these unadjusted curves with the corresponding (gray) adjusted curves. The adjusted export/preferential-margin curves are always lower, the distance between the two indicating the extent of erosion due to competition by other preference-receiving countries. The adjusted curves however are still positive for the EBA group, reflecting the aggregate estimates in table 3. Except for the relative importance of the most important export product, the shapes of the figures for Cambodia, Lao and Myanmar are remarkably similar. In sum, the patterns described in the figure reveal that the ASEAN-EBA group is quite homogeneous in terms of preferential access to the EU. This group competes strongly with ASEAN GSP beneficiaries. This is indicated by the convex broken line in figure 1a which captures the loss of preferential access coming from preferences granted to other GSP ASEAN members under the proposed ASEAN-EU FTA.
Finally, note the striking contrast between the EBA members and the only MFN country (Singapore) shown in the bottom right of the figure 1a. First, the adjusted preferential margin is always negative since it is an MFN exporter. Also, the adjusted preferential margin curve has several long horizontal strips. This is
because the negative adjusted preferential margins occurs for the 5 most important products (representing 40% of the total export value) and then only for products in
the range beyond the 38th product. Between these two product ranges
(corresponding to around 33% of the export value ranging from 40 to 73%), Singapore’s exports to the EU face a zero MFN tariff.
The schedules in figure 1b show that the GSP group is far more heterogeneous, signaling that one might expect very different stances on market access issues
during the negotiations. Thus, Brunei’s first 5 export products (the first being “articles of jewelry and parts thereof, of precious metal other than silver” which accounts for 94% of total export value) receive no preferences. The Philippines also gets quasi zero preference up to 68% of the exports to the EU. A similar pattern holds for Malaysia and Indonesia. The situation is more favorable for Thailand and Vietnam, since only the first 10% of exports do not benefit from some preferential access. All countries lose
Comparing the unadjusted and adjusted schedules for EBA and GSP countries suggests that the 3 EBA countries would form a natural negotiating entity with similar interests while this is not the case for the GSP group, even when Brunei is excluded. The very steep curves for the Philippines and Indonesia also suggest that these countries have strong interests in a few products, although these products carry little weight in their respective export basket.
5. Factoring in Rules of Origin
Rules of Origin (RoO) are an integral part of all reciprocal (i.e. FTAs) and non-reciprocal (i.e. GSP) trading arrangements falling short of a Customs Union. Their raison-d’être is to prevent trade deflection. In general, they turn out to be complex and modify sensibly market access because of the costs that are incurred by exporters having to comply with these rules. The EU applies a so-called “single-list” to all partners trading on a preferential basis with over 500 different product-specific rules of origin (PSRO) defined at the HS-6 level. These rules are complex and they certainly modify the extent of market access resulting from preferences differently across
negotiations to lead to a set of simple RoO as in e.g. AFTA where originating status is met so long as non-originating value does not exceed 60% of the value of the product
value.6 The question then is how do these RoO modify the extent of market access
and how can one summarize their effects.
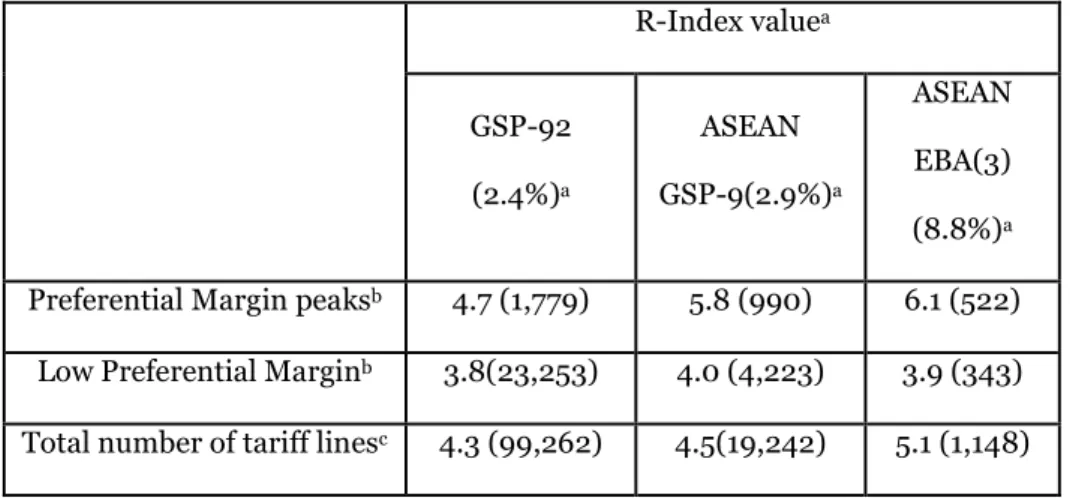
The complexity of these PSRO has been conveniently summarized by an overall ordinal restrictiveness “R-index” constructed at the product line level so that
increasing values of the index represent a more restrictive PSRO. The ordinal index takes values in the range 1≤ri ≤7 so that (r =i 1) corresponds to a PSRO that is easy
to satisfy and (r =i 7) to one that is difficult to satisfy.7 Trade-weighted average values
of the index for each ASEAN country are reported in the last column of table 2. It is immediately clear that the EBA group benefiting from greater market access face, overall, stricter RoO, and hence is subject to more preference erosion because of the costs associated with compliance.
6 ASEAN-EU report (2006) p.10, paragraph 3.15 states that “Negotiations to define, simple, transparent and liberal RoOs rank high on the priority list”
7 For example a value
(
4)
i
r = corresponds either to a change of tariff classification at the Heading
(HS-4 level) , a VC requirement limiting non-originating inputs to 60% of the ex-works price, or a wholly obtained criterion accompanied by an exclusion and a technical requirement. At the lower end
(
r =i 1)
, corresponds to a no change of tariff line heading, or an allowance added to one of the following single criteria: (exclusion, CTC at the sub-heading level, or wholly obtained). At the more restrictive end(
r =i 7)
usually the PSRO consists of three requirements including a technicalrequirement, and the CTC must take place at the Heading or Chapter level. See Cadot et al. 2006 for a description and application of the R-index.
One approach to estimating their restrictiveness is to estimate if, after controlling for the level of preferential access, utilization rates are lower for tariff lines with higher values for the PSRO index. Such correlations carried out by Cadot et al. (2007) for ASEAN and other beneficiaries on preferences in the EU market show that this is indeed the case. However, because there is so much heterogeneity in the
determinants of utilization rates at the tariff line level, it is hard to appreciate how such estimates are affected by omitted variable bias. Hence, to keep in the spirit of descriptive statistics used here, table 3 classifies products into three categories according to the extent of (unadjusted) preferential access to see if there is any correlation between the restrictiveness of RoO and the extent of preferential access. For both ASEAN groups, but especially for the EBA group, preferential margins coincide with tariff lines that have a more restrictive R-index indicating that where margins are substantial, proving origin is more difficult in the sense of having to meet multiple requirements, and hence is likely to be costly. High compliance costs for EBA beneficiaries would confirm that the low preference uptake for this group would
be due to restrictive RoO.8
Table 3 here: Preferential Margins and the PSRO index
8 For 2004, and for the ASEAN EBA members, the utilization of preferences in the EU market was around 30% for preferential margins above 5% and also for preference margins above 10% By contrast, the corresponding utilization rates were higher for the GSP group and around 80% (see Carrère et al. (2007), table 3.1) . Although the composition of exports differs, this also suggests that
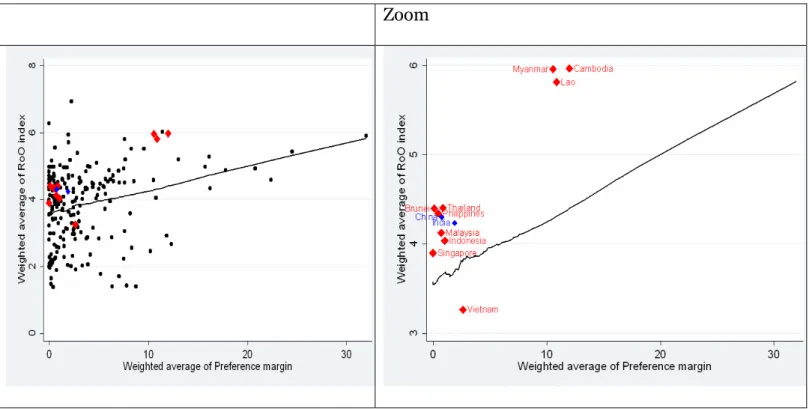
It is also informative to ask how ASEAN countries would compare under the proposed FTA when lined up against other EU preference-receiving competitors. Figure 2 plots the results of a smoothing regression between the stringency of the RoO index and the preferential margin for 2004 for the 219 beneficiaries of EU
preferences subject to RoO.9 ASEAN countries, as well as India and China, are
emphasized in the scatter plot. As expected, the regression line is positive, confirming the results in table 3. Even though the fit is not very tight, all ASEAN countries
appear to be significantly above the regression line (the farthest above the fitted line being the ASEAN-EBA group). This striking pattern suggests that these countries are facing more restrictive RoO than competing countries benefitting from the same preferential access. The two exceptions are Singapore, not significantly different from the sample mean, and Vietnam, significantly lower in terms of RoO restrictiveness given its preferential margin. It is thus not surprising from inspection of figure 2 that, from the point of view of ASEAN, as mentioned above, the protocol for the ASEAN-EU FTA stipulates that simple and transparent RoO should be a priority in the negotiations!
Figure 2 here: Restrictiveness index of PSRO versus export-weighted preferential margin
9
Smoothing regression is an OLS estimation over moving windows allowing for a potential non-linearity in the relation. See Imbs and Wacziarg (2003) for further description and an application
6 Final Thoughts
The market-access measures in this paper applied to the ASEAN-EU FTA suggest very different market access across countries when countries negotiate an FTA with a major trading partner like the EU which has an extensive preferential policy. Given the diversity in ASEAN membership, this is not surprising since at least one member belongs to each one of the three circles characterizing EU trade policy, but the
patterns revealed here are likely to appear in other country groupings like the EPAs negotiating FTAs with the EU . In the case of ASEAN, even the EBA beneficiaries’ effective market access is cut in half to about 5% once EU preferential access to other partners is taken into account. Taking into account preferences granted to other partners by the EU reveals that all the members (except Vietnam) in the GSP group are penalized under the current system of preferences Likewise, moving to FTA status would result in a loss of about ¼ of their preference margin for EBA members to other (i.e. GSP) ASEAN members getting free-trade status in the EU as a result of the FTA. The small aggregate value of preferences captured by the “Lorenz-like” curves in the export/preference-margin space show clearly that preferences are always received for products with very small export shares. A comparison of the export share/preference- margin relation across countries shows that the EBA group is quite homogenous, but not so for the GSP group which shows heterogeneity and likely strong conflicts of interests in the negotiations as far as market access issues are concerned.
The paper also develops simple measures to show how market access is further eroded once rules of origin (RoO) necessary to satisfy originating status under any
from maximum access (i.e. entering tariff-free in the EU for product categories with tariff peaks) also face the stiffest compliance rules. As a result, even if the same RoO are applied to all partners, because of differences in the commodity composition of their exports, trading partners are affected differentially by RoO. The estmates in the paper show that, for a given preferential margin, relative to other countries also receiving preferential trading status in the EU, ASEAN members face tougher RoO than other EU preferential trading partners.
In conclusion, it is noteworthy that many ex-ante assessments of the welfare effects of preferential market access tend to show gains from reciprocal preferential tariff reductions. On the other hand, the outcomes of negotiations indicate tensions
resulting in many exceptions to full market access. For example, in recognition of the different levels of development among its members, in all its FTA negotiations, ASEAN has individual exception lists. The tensions in the current EPA negotiations also suggest divergence of interests across member countries in the same negotiation group, let alone across negotiation groups. The measures developed here and applied to the proposed ASEAN-EU FTA help understand better why “one size does not fit all” applies to market access aspects of the many current preferential trade
R
R
e
e
f
f
e
e
r
r
e
e
n
n
c
c
e
e
s
s
ASEAN-EU Vision Group Report (2006) “Transregional Partnership for Shared and Sustainable Prosperity”, Hanoi, Vietnam.
Augier, P., M. Gasiorek, and C Tang (2005), “The Impact of Rules of Origin on Trade Flows”, Economic Policy, 20,43, 567-24
Brenton, Paul (2003), “Integrating the Least Developed Countries into the World Trading System: The Current Impact of EU Preferences under Everything But Arms”, Journal of World Trade, 37, 3, 623-646.
Cadot, O., C. Carrère, J. de Melo and B. Tumurchudur (2006) “Product Specific Rules of Origin in EU and US Preferential Trading Arrangements: An Assessment”, World Trade Review, 199-225
Cadot, O., J. de Melo and A. Portugal-Perez (2007) “Rules of Origin for Preferential Trading Arrangements: Implications for AFTA of EU and US Experience, Journal of Economic Integration, 22,2, 288-319
Carrère, C. (2006) “Revisiting the Effects of Free Trade Agreements on Trade Flows wit the Proper Specification of the Gravity Trade Model” European Economic Review, 50,2, 223-47
Carrère, C., J. de Melo and B. Tumurchudur (2008), “Disentangling Market Access Effects for ASEAN Members under an ASEAN-EU FTA”, CEPR DP paper #5047
CEPII- CIREM (2006) “Economic Impact of a Potential Free Trade Agreement (FTA) Between the European Union and ASEAN”, report prepared for the Directorate General of Trade, Commission of the European Union.
Francois, J, B. Hoekman, and M. Manchin (2006) Preference Erosion and
Multilateral Trade Liberalization”, World Bank Economic Review, 20,2, 197-216.
Hausmann, R. and D. Rodrik (2003), “Economic Development as Self-Discovery”; Journal of Development Economics 72, 603-633.
Imbs, J and. R. Wacziarg (2003) “Stages of Diversification”, American Economic Review, 93, 63-86
Low, P. R. Piermanti, and J. Richetering (2005) “Multilateral Solutions to the
Erosions of non-reciprocal Preferences in NAMA”, ERSD- 2005-05, (Geneva, World Trade Organization)
World Trade Organization, (2004) “Exploring the linkage between
the domestic policy environment and international trade”, World Trade Report.
World Bank (2005): “Global Economic Prospects: Trade, Regionalism and Development” (Washington, D.C., World Bank)
T TAABBLLEESSAANNDDFFIIGGUURREESSTTOO D DIISSEENNTTAANNGGLLIINNGGMMAARRKKEETTAACCCCEESSSSEEFFFFEECCTTSSOOFFPPRREEFFEERREENNTTIIAALLTTRRAADDIINNGG A ARRRRAANNGGEEMMEENNTTSS::AAPPPPLLIICCAATTIIOONNFFOORRAASSEEAANNMMEEMMBBEERRSS UUNNDDEERRAANNAASSEEAANN--EEUU F FTTAA** By Céline Carrère Jaime de Melo Bolormaa Tumurchudur
Table 1: Distribution of EU applied tariff, HS-10, 2004
Nber of HS-10 lines with an applied tariff of
0 ]0-5] ]5-10] ]10-25] ]25-50] ]50-100] >100 Total Nber of tariff lines Cumulativ e share of the Top 50 exports to EU25 Overall / EU market 2172 4201 3476 1768 278 175 75 12145 MFN status Singapore 864 (44%) 1867 (8%) 740 (48%) 406 (1%) 9 (0%) 7 (0%) 2 (0%) 3895 77.4% GSP status Brunei 105 (34%) 3 (63%) 37 (3%) 0 0 0 0 144 99.2% Indonesia 2081 (63%) 759 (12%) 984 (22%) 76 (3%) 6 (0%) 2 (0%) 0 3943 54.5% Malaysia 2449 (81%) 552 (8%) 509 (8%) 374 (2%) 5 (0%) 3 (0%) 0 3934 58.5% Philippines 1725 (93%) 347 (2%) 565 (5%) 71 (1%) 4 (0%) 1 (0%) 0 2748 81.2% Thailand 2436 (58%) 826 (13%) 887 (14%) 822 (14%) 22 (0%) 11 (0%) 3 (1%) 5049 46.7% Vietnam 1351 (40%) 416 (25%) 669 (19%) 92 (16%) 5 (0%) 1 (0%) 0 2602 56.9% EBA status Cambodia 407 (100%) 0 0 0 0 0 0 407 88.2% Laos 259 (100%) 0 0 0 0 0 0 258 88.1% Myanmar 485 (100%) 0 0 0 0 0 0 486 84.5%
Note: The corresponding % of total lines in parenthesis. Source : authors’ computations.
Table 2:
Preferential Margins, adjusted and Unadjusted under Different Preferential Schemes
(Weighted by the export value at the HS-10 level)
Current average Pref. Margin
Gain/Loss in Pref. margin from implementing an ASEAN-EU FTA RoO index Value of Pref. (millions euros) a/
Unadj. Adj. Unadj. Adj.
(1) (2) (3) (4) (5) (6) MFN status Singapore 0.0 0.0 -0.3 3.5 0.9 3.9 GSP status Brunei 0.0 0.1 -1.1 2.2 1.5 4.4 Indonesia 29.5 1.0 -0.4 2.7 1.7 4.0 Malaysia 21.6 0.7 0.0 1.2 0.6 4.1 Philippines 8.2 0.5 0.0 0.6 0.4 4.3 Thailand 21.2 0.9 -0.6 4.8 2.1 4.4 Vietnam 28.6 2.6 0.2 4.7 3.1 3.3 EBA status Cambodia 17.2 12.0 5.5 0.0 -1.4 6.0 Lao 3.5 10.9 5.3 0.0 -1.2 5.8 Myanmar 0.1 10.6 4.8 0.0 -1.0 6.0
Notes: Estimates in percentage points for 2004 (margins weighted by exports) a/ Value of actual preferences:
(
iMFN k, iPREF k,)
iPREF k,k t −t M
∑
, MPREFbeing theimport value to EU that actually enters under preferential status. Source : authors’ computations.
Figure 1.a: EBA group a/ and Singapore
Cumulative Exports Against Cumulative Preferences b/
Top 100 export HS-10 digit items to the EU25 in 2004
Cambodia Laos 0% 20% 40% 60% 80% 1 00% 20% 30% 40% 50% 60% 7 0% 80% 90% 1 00 % Cumulativ e share of ex ports to EU
C u m u la ti v e s h a re o f P re f. m a rg in Unadjusted A djusted Un a dju st ed FT A A dju st ed FT A 0% 20% 40% 60% 80% 1 00% 0 % 1 0 % 2 0 % 3 0 % 4 0 % 5 0 % 6 0 % 7 0 % 8 0 % 9 0 % 1 0 0 %
Cumulativ e share of ex ports to EU
C u m u la ti v e s h a re o f P re f. m a rg
in UnadjustedUn a dju st ed FT A AdjustedA dju st ed FT A
Myanmar Singapore (MFN) 0% 20% 40% 60% 80% 1 00% 0 % 1 0 % 2 0 % 3 0 % 4 0 % 5 0 % 6 0 % 7 0 % 8 0 % 9 0 % 1 0 0 %
Cumulativ e share of ex ports to EU
C u m u la ti v e s h a re o f P re f. m a rg in Unadjusted A djusted Un a dju st ed FT A A dju st ed FT A -60.0% -40.0% -20.0% 0.0% 20.0% 40.0% 60.0% 80.0% 1 00.0% 0% 5 0%
Cumulativ e share of ex ports to EU
C u m u la ti v e s h a re o f P re f. m a rg in Unadjusted A djusted Un a dju st ed FT A A dju st ed FT A Notes:
a/ For the EBA group, current unadjusted and unadjusted FTA curves coincide. See table 3, col. 5.
b/ the pref. margins are normalized so that the cumulative unadjusted preferential margin under EU-ASEAN FTA is 100% for the top 100 products. Solid (dashed) lines correspond to unadjusted (adjusted) export-preferential-margin relations. Black lines correspond to current situation; Gray lines to those under the proposed ASEAN-EU FTA
Figure 1.b: GSP group
Cumulative Exports Against Cumulative Preferences a/ Top 100 export HS-10 digit items to the EU25 in 2004
Brunei Indonesia -40% -20% 0% 20% 40% 60% 80% 1 00% 60% 7 0% 80% 90% 1 00%
Cumulativ e share of ex ports to EU
C u m u la ti v e s h a re o f P re f. m a rg in Unadjusted Adjusted Un a dju st ed FT A A dju st ed FT A -100.0% -80.0% -60.0% -40.0% -20.0% 0.0% 20.0% 40.0% 60.0% 80.0% 100.0% 0% 20% 40% 60%
Cumulativ e share of ex ports to EU
C u m u la ti v e s h a re o f P re f. m a rg in Unadjusted A djusted Un a dju st ed FT A A dju st ed FT A Malaysia Philippines -40.0% -20.0% 0.0% 20.0% 40.0% 60.0% 80.0% 1 00.0% 0% 1 0% 20% 30% 40% 5 0% 60% 7 0%
Cumulativ e share of ex ports to EU
C u m u la ti v e s h a re o f P re f. m a rg in Unadjusted Adjusted Un a dju st ed FT A A dju st ed FT A -20.0% 0.0% 20.0% 40.0% 60.0% 80.0% 1 00.0% 30% 40% 50% 60% 7 0% 80% 90%
Cumulativ e share of ex ports to EU
C u m u la ti v e s ha re o f P re f. m a rg in Unadjusted A djusted Un a dju st ed FT A A dju st ed FT A Thailand Vietnam -1 50.0% -1 00.0% -50.0% 0.0% 50.0% 1 00.0% 0% 1 0% 20% 30% 40% 50% 60%
Cumulativ e share of ex ports to EU
C u m u la ti v e s h a re o f P re f. m a rg in Unadjusted Adjusted Un a dju st ed FT A A dju st ed FT A -20.0% 0.0% 20.0% 40.0% 60.0% 80.0% 1 00.0% 0% 1 0% 20% 30% 40% 50% 60% 7 0% Cumulativ e share of ex ports to EU
C u m u la ti v e s h a re o f P re f. m a rg in Unadjusted A djusted Un a dju st ed FT A A dju st ed FT A
Source : authors’ computations.
Table 3: Preferential Margins and the PSRO index R-Index valuea GSP-92 (2.4%)a ASEAN GSP-9(2.9%)a ASEAN EBA(3) (8.8%)a Preferential Margin peaksb 4.7 (1,779) 5.8 (990) 6.1 (522)
Low Preferential Marginb 3.8(23,253) 4.0 (4,223) 3.9 (343) Total number of tariff linesc 4.3 (99,262) 4.5(19,242) 5.1 (1,148) Notes:
Number of tariff lines are indicated in parenthesis next to average value of R-index a/ Average preferential margin in parenthesis.
b/,See text for the definition of the R-index
c/ For the two GSP groups, the tariff peaks are computed for all tariff lines that exceed 3 times (are one third of) the average preferential margin given in parenthesis. For the EBA group, peaks are defined for tariff lines with preference margins in excess of 12% and low margins for tariff lines below 4% preferential margins.
Figure 2: Restrictiveness index of PSRO versus export-weighted preferential margin
Zoom
Source: authors’ computations.
Notes: Smoothing Regression using exported weighted data for the PSRO index and for the (unadjusted) preferential Margin, 219 countries, 2004