HAL Id: hal-00303219
https://hal.archives-ouvertes.fr/hal-00303219
Submitted on 20 Dec 2007HAL is a multi-disciplinary open access
archive for the deposit and dissemination of sci-entific research documents, whether they are pub-lished or not. The documents may come from teaching and research institutions in France or abroad, or from public or private research centers.
L’archive ouverte pluridisciplinaire HAL, est destinée au dépôt et à la diffusion de documents scientifiques de niveau recherche, publiés ou non, émanant des établissements d’enseignement et de recherche français ou étrangers, des laboratoires publics ou privés.
Fast airborne aerosol size and chemistry measurements
with the high resolution aerosol mass spectrometer
during the MILAGRO Campaign
P. F. Decarlo, E. J. Dunlea, J. R. Kimmel, A. C. Aiken, D. Sueper, J.
Crounse, P. O. Wennberg, L. Emmons, Y. Shinozuka, A. Clarke, et al.
To cite this version:
P. F. Decarlo, E. J. Dunlea, J. R. Kimmel, A. C. Aiken, D. Sueper, et al.. Fast airborne aerosol size and chemistry measurements with the high resolution aerosol mass spectrometer during the MILAGRO Campaign. Atmospheric Chemistry and Physics Discussions, European Geosciences Union, 2007, 7 (6), pp.18269-18317. �hal-00303219�
ACPD
7, 18269–18317, 2007Aerosol size and chemistry measurements during MILAGRO P. F. DeCarlo et al. Title Page Abstract Introduction Conclusions References Tables Figures ◭ ◮ ◭ ◮ Back Close
Full Screen / Esc
Printer-friendly Version Interactive Discussion
Atmos. Chem. Phys. Discuss., 7, 18269–18317, 2007 www.atmos-chem-phys-discuss.net/7/18269/2007/ © Author(s) 2007. This work is licensed
under a Creative Commons License.
Atmospheric Chemistry and Physics Discussions
Fast airborne aerosol size and chemistry
measurements with the high resolution
aerosol mass spectrometer during the
MILAGRO Campaign
P. F. DeCarlo1,2, E. J. Dunlea1, J. R. Kimmel1, A. C. Aiken1,3, D. Sueper1,
J. Crounse4, P. O. Wennberg4, L. Emmons5, Y. Shinozuka6, A. Clarke6, J. Zhou6, J. Tomlinson7, D. R. Collins7, D. Knapp5, A. J. Weinheimer5, D. D. Montzka5, T. Campos5, and J. L. Jimenez1,3
1
Cooperative Institute for Research in Environmental Science (CIRES) University of Colorado, Boulder, CO, USA
2
Dept. of Atmospheric and Oceanic Science, Univ. of Colorado at Boulder, Boulder, CO, USA 3
Dept. of Chemistry and Biochemistry, University of Colorado at Boulder, Boulder, CO, USA 4
California Institute of Technology, Pasadena, CA, USA 5
National Center for Atmospheric Research, Boulder, CO, USA 6
Department of Oceanography, University of Hawaii, USA 7
Department of Meteorology, Texas A&M University, College Station, TX, USA
Received: 22 November 2007 – Accepted: 28 November 2007 – Published: 20 December 2007
Correspondence to: J. L. Jimenez (jose.jimenez@colorado.edu)
ACPD
7, 18269–18317, 2007Aerosol size and chemistry measurements during MILAGRO P. F. DeCarlo et al. Title Page Abstract Introduction Conclusions References Tables Figures ◭ ◮ ◭ ◮ Back Close
Full Screen / Esc
Printer-friendly Version Interactive Discussion
Abstract
The concentration, size, and composition of non-refractory submicron aerosol (NR-PM1) was measured over Mexico City and central Mexico with a High-Resolution Time-of-Flight Aerosol Mass Spectrometer (HR-ToF-AMS) onboard the NSF/NCAR C-130 aircraft as part of the MILAGRO field campaign. This was the first aircraft deployment
5
of the HR-ToF-AMS, in which the instrument performed very well, and provided 12 s data. The aerosol mass from the AMS correlates strongly with other aerosol mea-surements on board the aircraft. Organic aerosol (OA) species dominate the NR-PM1 mass. OA correlates strongly with CO and HCN indicating that pollution (mostly sec-ondary OA, SOA) and biomass burning (BB) are the main OA sources. The OA to CO
10
ratio indicates a typical value for aged air of around 80µg m−3 (STP) ppm−1. This is within the range observed in outflow from the Northeastern US, which could be due to a compensating effect between higher BB but lower biogenic VOC emissions dur-ing this study. The O/C atomic ratio for OA is calculated from the HR mass spectra and shows a clear increase with photochemical age, as SOA forms rapidly and quickly
15
overwhelms primary urban OA, consistent with Volkamer et al. (2006) and Kleinman et al. (2007b). BB OA is marked by signals at m/z 60 and 73, and also by a signal enhancement at large m/z indicative of larger molecules or more resistance to frag-mentation. The main inorganic components show different spatial patterns and size distributions. Sulfate is regional in nature with clear volcanic and petrochemical/power
20
plant sources, while the urban area is not a major source for this species. Nitrate is enhanced significantly in the urban area and immediate outflow, and is strongly corre-lated with CO indicating a strong urban source. The importance of nitrate decreases with distance from the city likely due to evaporation. BB does not appear to be a strong source of nitrate despite its high emissions of nitrogen oxides, presumably due to low
25
ammonia emissions. NR-chloride often correlates with HCN indicating a fire source, although other sources likely contribute as well. This is the first aircraft study of the regional evolution of aerosol chemistry from a tropical megacity.
ACPD
7, 18269–18317, 2007Aerosol size and chemistry measurements during MILAGRO P. F. DeCarlo et al. Title Page Abstract Introduction Conclusions References Tables Figures ◭ ◮ ◭ ◮ Back Close
Full Screen / Esc
Printer-friendly Version Interactive Discussion
1 Introduction
Aerosols are important components of the earth system. Some of the effects of aerosols are reduction in visibility (Watson, 2002), deterioration of human health (Pope and Dockery, 2006), deposition of pollutants to ecosystems (Bytnerowicz and Fenn, 1996), and direct and indirect effects on the radiative balance of the climate system.
5
Currently, aerosols and their associated direct and indirect effects contribute the largest uncertainty to the radiative forcing of the climate system (IPCC, 2007). Organic species account for a large fraction of the submicron aerosol mass at most locations (Zhang et al., 2007a) and are especially poorly understood. Urban areas are large sources of aerosols and aerosol precursors. Pollution from megacities and large urban areas is
10
important not only for local effects on health, visibility, and ecosystems/crops but also because of their collective influence in regional to global scale atmospheric chemistry and radiative forcing.
The Megacity Initiative: Local and Global Research Observations (MILAGRO) took place in and around Mexico City during March of 2006. The Megacity Impacts on
15
Regional and Global Environment (MIRAGE-Mex) was the component of the MILA-GRO campaign under US NSF sponsorship, and included several aircraft platforms and ground sites. The MILAGRO campaign was designed to study the chemical charac-terization and transformation of pollutants from the Mexico City urban area to regional scales in a pseudo-lagrangian framework. A High-Resolution Time-of-Flight Aerosol
20
Mass Spectrometer (HR-ToF-AMS) (DeCarlo et al., 2006) was deployed for the first time on an aircraft platform onboard the National Science Foundation/National Center for Atmospheric Research (NSF/NCAR) C-130 aircraft.
Air pollution in Mexico City has been studied for many years. An overview and de-tailed list of the studies in Mexico City from 1960–2000 is given by Raga et al. (2001).
25
Important conclusions include the need for size-resolved composition measurements of PM2.5 aerosol, as well as the need of vertical measurements of aerosol species.
More recent studies in Mexico City have added to our understanding of Mexico City
ACPD
7, 18269–18317, 2007Aerosol size and chemistry measurements during MILAGRO P. F. DeCarlo et al. Title Page Abstract Introduction Conclusions References Tables Figures ◭ ◮ ◭ ◮ Back Close
Full Screen / Esc
Printer-friendly Version Interactive Discussion
pollution. Salcedo et al. (2006) conclude that organics dominate PM2.5 inside the city during the MCMA-2003 campaign, and a significant fraction of the organics are oxy-genated organic aerosol (OOA). Sulfate showed a more regional behavior while nitrate was mostly produced from local photochemistry. Non-refractory (NR) chloride was present in small levels with a diurnal cycle peaking in the morning, but also showed
5
some very large plumes that were not associated with organics. The inorganic acids were neutralized by ammonium most of the time, although some periods with ammo-nium deficit were also observed. Volkamer et al. (2006) show that secondary organic aerosol (SOA) from urban sources is produced rapidly and about 8 times more ef-ficiently in the city than an SOA model predicted. Although only one case study is
10
presented, the paper states that similar conclusions were obtained for several other days simulated. This study extended previous results about SOA underprediction over regional scales (de Gouw et al., 2005; Johnson et al., 2006a; Heald et al., 2005) to shorter time scales and the urban environment. Kleinman et al. (2007b) analyzed the aerosol evolution with photochemical age during MILAGRO over the urban area and
15
near outflow and confirm the results of Volkamer et al. (2006).
Wildfires and biomass burning (BB) have been also identified as important sources of particulate matter in Mexico City. Bravo et al. (2002) found a correlation between es-timated emissions from wildfires and both Total Suspended Particles (TSP) and PM10 for the years 1992–1999. During the Mexico City Metropolitan Area campaign in 2003
20
(MCMA-2003) biomass burning was identified as an important source of fine particles, and especially for organic species (Johnson et al., 2006b; Molina et al., 2007; Salcedo et al., 2006). Recent results from the MILAGRO campaign also suggest that biomass burning contributed significantly to the gas and particle pollution in the city basin and outflow, although the magnitude of the impacts of fires is the subject of debate (Moffet
25
et al., 2007; DeCarlo and Jimenez, 2007; Jimenez and DeCarlo, 2007; Yokelson et al., 2007). A source apportionment study using trace metals, inorganics, EC, and OC at many locations in and around Mexico City for total PM2.5 and PM10 did not identify
biomass burning as a source (Querol et al., 2007). However, specific tracers of this 18272
ACPD
7, 18269–18317, 2007Aerosol size and chemistry measurements during MILAGRO P. F. DeCarlo et al. Title Page Abstract Introduction Conclusions References Tables Figures ◭ ◮ ◭ ◮ Back Close
Full Screen / Esc
Printer-friendly Version Interactive Discussion
source (e.g., WSOC, water-soluble K, levoglucosan) were not included in this study, and thus biomass burning emissions were probably mixed with other emission sources in the source apportionment analysis (M. Viana, personal communication, 2007). A different source apportionment study of fine organic aerosol reports that BB made a highly variable contribution in time accounting on average for 16% and 32% of the
am-5
bient organic carbon (OC) at the urban (T0) and rural (T1) ground supersites respec-tively (Stone et al., 2007). 14C measurements indicate a significant fraction of modern carbon in the organic aerosol measured at the T0 site, part of which likely originates from urban sources such as trash burning and cooking (Aiken et al., 2007a).
An overview of the large-scale meterology during the MILAGRO campaign is
pre-10
sented in Fast et al. (2007) and identifies 3 general regimes. 1–14 March is the first regime and is characterized by sunny and dry conditions. The second regime from the 14–23 March saw an increase in humidity and the development of afternoon con-vection, which slowly diminished as the atmosphere became drier. The third regime (24–31 March) began with a cold surge, saw increased precipitation, and a decrease
15
in the frequency and intensity of fires.
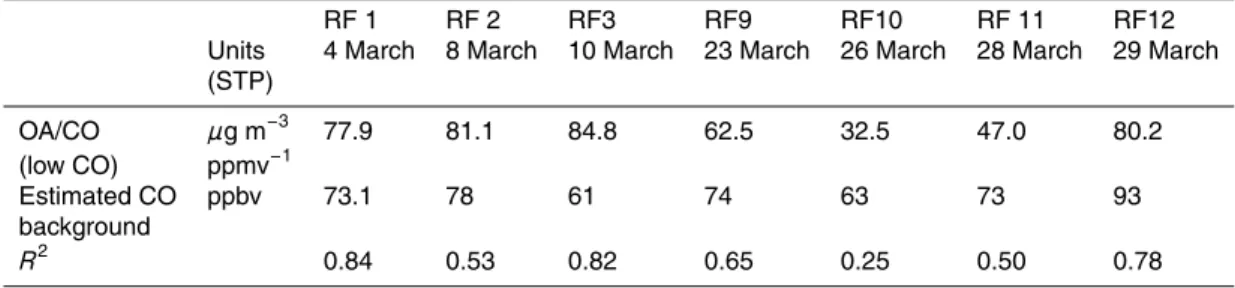
The C-130 performed 12 research flights (RFs) during the MILAGRO campaign. For this paper the focus will be on RFs 2, 3, and 12 (the 8, 10, and 29 March 2006 respec-tively). Data will also be presented from RFs 1, 9, 10, and 11 from the 4, 23, 26, and 28 March 2006. RFs 2, 3, and 12 all had city and regional components in their flight
20
patterns. RF 1 had a city and regional component, but not all instruments were working on the C-130. RF 9 was a flight to the Yucatan Pennisula, and did not contain a city component. RF 10 was cut short due to mechanical problems with the plane, and the majority of the flight was spent at high altitude. RF 11 was a flight designed to measure the morning transition of photochemistry and did not sample in the city basin. During
25
RFs 4-8 a leak in the shared inlet system did not allow quantitative measurements of aerosol chemistry; when possible mass fractions of the measured AMS chemical species were reported to the database, however they have not been included in this paper.
ACPD
7, 18269–18317, 2007Aerosol size and chemistry measurements during MILAGRO P. F. DeCarlo et al. Title Page Abstract Introduction Conclusions References Tables Figures ◭ ◮ ◭ ◮ Back Close
Full Screen / Esc
Printer-friendly Version Interactive Discussion
In this paper, we present, the results of the measurements of non-refractory sub-micron aerosol chemistry from the HR-ToF-AMS in the C-130 which indicate that or-ganic aerosols (OA) are the largest NR chemical component, with nitrate, sulfate, am-monium, and chloride also making significant contributions. Different aerosol species have different spatial distributions and tracer correlations, indicating influences from
dif-5
ferent sources and processes. A large fraction of the organic aerosol is oxidized, with an oxygen-to-carbon atomic ratio (O/C) that increases with distance from the city ap-proaching a ratio of 0.9 away from the basin. Organic O/C can be used as a qualitative “photochemical clock.” Finally a detailed case study of RF 2 is presented to assemble all of these results into a coherent and detailed picture of submicron aerosol over and
10
around Mexico City. Quantitative apportionment of OA sources will be addressed in a subsequent publication.
2 Methods
2.1 Instrumentation 2.1.1 HR-ToF-AMS
15
The HR-ToF-AMS has been described in detail previously (DeCarlo et al., 2006). It improves upon previous versions of the AMS (Drewnick et al., 2005; Canagaratna et al., 2007; Jayne et al., 2000) by the use of a high-resolution mass spectrometer that allows the determination of the elemental composition of most ions, while previous AMS versions can only determine the total signal at each integer mass. In the rest of
20
the paper we will refer to the HR-ToF-AMS as “AMS” for brevity. The AMS sampled non-refractory submicron aerosol (NR-PM1) during the research flights. Data were acquired in two acquisition modes (Jimenez et al., 2003): Particle Time-of-Flight mode (PToF) which allows for particle sizing, and Mass Spec (MS) mode, which produces species concentrations and a complete mass spectrum of the non-refractory submicron mass
25
ACPD
7, 18269–18317, 2007Aerosol size and chemistry measurements during MILAGRO P. F. DeCarlo et al. Title Page Abstract Introduction Conclusions References Tables Figures ◭ ◮ ◭ ◮ Back Close
Full Screen / Esc
Printer-friendly Version Interactive Discussion
with no size information, but with higher sensitivity than the PToF mode. For most of the campaign data was averaged and saved every 12 seconds. Data was also saved at longer time intervals (∼30–45 s) early in the campaign, and sometimes a “plume-mode” was utilized which consisted of 3 second save intervals of MS mode only (no particle sizing). The HR-ToF-AMS was run exclusively in the V-mode of ion flight for the mass
5
spectrometer, which is about a factor of 10 more sensitive than the alternative W-mode. V-mode operation has lower resolution than W-mode, but still maintains high enough resolution to separate most ions of the same nominal mass, and especially reduced vs. oxidized organic fragments (DeCarlo et al., 2006). This instrument was installed towards the rear of the C-130 (http://mirage-mex.acd.ucar.edu/Measurements/C130/
10
Images/C-130 layout.png) and shared an inlet system with the Georgia Tech Particle into Liquid Sampler (PILS). The inlet is described in more detail elsewhere (Dunlea et al., 20071). Briefly, the inlet was mounted in the belly of the plane and consisted of a near isokinetic shallow conical diffuser into a 2.54 cm (1.0 inch) diameter stainless steel tube with a smooth 90 degree bend into the cabin floor. The flow was then isokinetically
15
subsampled into the AMS line (8 l per minute) and PILS (30 l per minute). A pressure controlled inlet was used just before the AMS (Bahreini et al., 20072), to eliminate the fluctuations in aerosol sizing and transmission efficiency due to changing pressures in the aerodynamic lens of the instrument. The PCI used a setpoint of 350 torr, with a 180 micron upstream orifice, with a 150 micron orifice before the lens of the AMS.
20
This allows for sampling up to ∼6.5 km without the need for flow corrections to the raw 1
Dunlea, E. J., DeCarlo, P. F., Kimmel, J. R., Aiken, A. C., Peltier, R., Weber, R., Tomlinson, J., Collins, D., Shinozuka, Y., Howell, S., Clarke, A., Emmons, L., Apel, E., Pfister, G., van Donkelaar, A., Millet, D., Heald, C. L., and Jimenez, J. L.: Observations of processed Asian pollution with a high-resolution time-of-flight aerosol mass spectrometer (HR-ToF-AMS), Atmos. Chem. Phys. Discuss., in preparation, 2007.
2
Bahreini, R., Dunlea, E. J., Matthew, B. M., Simons, C., Docherty, K. S., DeCarlo, P. F., Brock, C. A., Jimenez, J. L., and Middlebrook, A. M.: Design and operation of a pressure controlled inlet for airborne sampling with an Aaerodyne aerosol mass spectrometer, Aerosol Sci. Tech., submitted, 2007.
ACPD
7, 18269–18317, 2007Aerosol size and chemistry measurements during MILAGRO P. F. DeCarlo et al. Title Page Abstract Introduction Conclusions References Tables Figures ◭ ◮ ◭ ◮ Back Close
Full Screen / Esc
Printer-friendly Version Interactive Discussion
AMS data. The residence time between the inlet tip and the AMS was ∼4 s (of which 3.2 s was in the PCI), and the flow warmed up to cabin temperature due to ram heating in the inlet and heat transfer (∆T ∼2–35◦C for plane altitudes below 4 km). This may have led to some evaporation of aerosol components (Murphy, 2006), which would be more important for ammonium nitrate and chloride, less important for organics, and
5
negligible for ammonium sulfate (Huffman et al., 20073). Further information on AMS data processing is given in Sect. 2.2.
2.1.2 Nephelometer
Total and submicrometer aerosol scattering coefficients were measured at 450, 550 and 700 nm using two TSI model 3563 3-wavelength integrating nephelometers
(An-10
derson et al., 1996; Heintzenberg and Charlson, 1996; Anderson et al., 2003). The submicrometer TSI nephelometer employed a 1-µm aerodynamic impactor maintained
at 30 lpm by an Alicat Scientific volumetric flow controller. While the measurements were made every second, sample air residence time inside the nephelometers was about 10 s. The noise over 10 s at 550 nm is estimated to be 0.3 Mm−1 (Anderson et
15
al., 1996). The instrument relative humidity was usually lower than 30%. The scattering coefficients were detected over 7–170◦, and corrected for 0–180◦ using the measured wavelength dependence as a surrogate for the particle size after Anderson and Ogren (1998). For the submicron (PM1) scattering, this angular truncation correction is typ-ically less than 10%, and contributes negligible (<3%) uncertainty. Gas calibration 20
results in a smaller (+/−1%) systematic error (Anderson et al., 1996). The aerosol inlet for the nephelometer was a shrouded solid diffuser maintained at isokinetic flow ±5% and aspirated at about 100 lpm. The aerodynamic 50% size cut was 5µm
(Mc-Naughton et al., 2007). 3
Huffman, J. A., Aiken, A. C., K.S., D., M., U. I., DeCarlo, P. F., Jayne, J. T., Onasch, T. B., Trimborn, A., Worsnop, D. R., Ziemann, P. J., and Jimenez, J. L.: Volatility of primary and secondary organic aerosols in the field contradicts current model representations, submitted, 2007.
ACPD
7, 18269–18317, 2007Aerosol size and chemistry measurements during MILAGRO P. F. DeCarlo et al. Title Page Abstract Introduction Conclusions References Tables Figures ◭ ◮ ◭ ◮ Back Close
Full Screen / Esc
Printer-friendly Version Interactive Discussion
2.1.3 Scanning Mobility Particle Sizer (SMPS)
The Texas A&M SMPS (Wang and Flagan, 1990) measured the size distribution of particles between 0.012 and 0.67µm mobility diameter once every 1.5 min. A high
flow differential mobility analyzer (Stolzenburg et al., 1998) is used in the SMPS with sample and sheath flow rates of 1.5 and 15 liters per minute, respectively. The sampled
5
aerosol was dried to below 10% RH prior to classification using a Nafion tube bundle. The SMPS was located adjacent to, and shared an inlet with, the nephelometer and SP2.
2.1.4 HCN
The Caltech CIMS measured selected product ions on the C-130 via reaction of the
10
reagent ion CF3O −
with analytes directly in air. HCN is measured by monitoring the product ion at m/z 112, which is the cluster of CF3O
−
with HCN. The sensitivity to HCN is dependent on the water vapor mixing ratio. Sensitivity changes due to water vapor changes are corrected for using the dewpoint hygrometer water measurement from the C-130 aircraft, and a water calibration curve that has been generated though
15
laboratory measurements. Non-water sensitivity changes are corrected for using in-flight standard addition calibrations of H2O2 and HNO3 (other species measured by the CIMS) and proxied to laboratory calibrations of HCN. The detection limit (S/N=1) for HCN for a 0.5 s integration period is better than 15 pptv for moderate to low water vapor levels (H2O mixing ratio ≤0.004) (Crounse et al., 2006).
20
2.1.5 CO
The NCAR/NSF C-130 CO vacuum UV resonance fluorescence instrument is similar to that of Gerbig et al. (1999). The MILAGRO data have a 3 ppbv precision, 1-s resolution, and a typical accuracy of ±10% for a 100 ppbv ambient mixing ratio.
ACPD
7, 18269–18317, 2007Aerosol size and chemistry measurements during MILAGRO P. F. DeCarlo et al. Title Page Abstract Introduction Conclusions References Tables Figures ◭ ◮ ◭ ◮ Back Close
Full Screen / Esc
Printer-friendly Version Interactive Discussion
2.1.6 NOx, NOymeasurement
NOx (NO and NO2) and NOy (total reactive nitrogen) were measured (along with O3) using the NCAR 4-channel chemiluminescence instrument, previously flown on the NASA WB-57F (Ridley et al., 2004). NOywas measured via Au-catalyzed conversion of reactive nitrogen species to NO, with a time response of about 1 s. NO2 was
mea-5
sured as NO following photolytic conversion of NO2, with a time response of about 3 s due to the residence time in the photolysis cell. NO was measured with an identical time response due to use of a cell with an identical residence time. NO and NO2 are reported at 1-s. For NO, NO2, and NOy, the precision of a 1-s value is near 15 pptv. The overall estimated uncertainties of 1-sec values are ±(15 + 7% of the mixing ratio)
10
pptv for NO, ±(15+10% of the mixing ratio) pptv for NO2, ±(15+15% of mixing ratio) pptv for NOy.
2.1.7 MOZART model
A simulation of MOZART-4 (Model for Ozone and Related chemical Tracers, version 4) (Emmons et al., 20074) was run where tracers that represented the CO emissions
15
from Mexico City for each day were included. MOZART-4 was driven with NCEP/GFS (National Centers for Environmental Prediction Global Forecast System) meteorolog-ical fields at a horizontal resolution of T170 (0.7 degrees). The emissions are from the Mexico National Emissions Inventory for 1999 (http://www.epa.gov/ttn/chief/net/ mexico.html, as gridded by Marcelo Mena, U. Iowa) and the tracers include the
emis-20
sions between 18–20 degrees N and 98–100 degrees W. 4
Emmons, L. K., Hess, P. G., Lamarque, J.-F., et al.: Sensitivity of chemical budgets to meteorology in MOZART-4, in preparation, 2007.
ACPD
7, 18269–18317, 2007Aerosol size and chemistry measurements during MILAGRO P. F. DeCarlo et al. Title Page Abstract Introduction Conclusions References Tables Figures ◭ ◮ ◭ ◮ Back Close
Full Screen / Esc
Printer-friendly Version Interactive Discussion
2.2 AMS data processing 2.2.1 AMS calibrations
Procedures for AMS calibration can be found in previous publications (Kimmel et al., 2006; Jimenez et al., 2003). The amplification factor of the microchannel plate detec-tor (MCP) was measured every day the instrument was in use (“single ion calibration”).
5
Due to the stability and reproducibility of the single ion throughout the campaign a sin-gle average value was used for the entire campaign. The lack of MCP degradation is likely due to the very limited instrument use, ∼120 h total, equivalent to only 5 days of operation in a ground-based field campaign. Ionization efficiency (IE) calibrations were performed 6 times during the campaign. Due to customs issues the calibration
10
equipment was not delivered until 10 days into the campaign, thus the IE for the first 3 flights was assumed to be the same, and was determined by a calibration made on 12 March 2006. Over the course of the campaign the IE calibration values varied by 20%, but varied by smaller amounts from flight to flight. 20% is therefore an upper limit to the uncertainty introduced by not having calibration equipment for the first three flights.
15
IE values for the rest of the flights were determined from calibrations bracketing the flights. All AMS data was converted to mass loading at STP (273 K and 1013.25 hPa). Measured AMS mass was converted to volume using the assumption that species vol-ume is additive (Eq. 4 of DeCarlo et al., 2004). For this conversion the densities of the species were assumed to be 1.78, 1.72, and 1.52 g cm−3 for ammonium sulfate,
am-20
monium nitrate, ammonium chloride respectively (Lide, 2007). A density of 1.27 g cm−3 was used for organics, based on the measured value from Cross et al. (2007).
2.2.2 AMS data processing
AMS Data was processed in the Igor Pro 6.0 Software (Wavemetrics Inc. Lake Os-wego, Oregon) using the standard ToF-AMS Data Analysis toolkit, (“Squirrel”, http://
25
cires.colorado.edu/jimenez-group/ToFAMSResources/ToFSoftware/SquirrelInfo/). The 18279
ACPD
7, 18269–18317, 2007Aerosol size and chemistry measurements during MILAGRO P. F. DeCarlo et al. Title Page Abstract Introduction Conclusions References Tables Figures ◭ ◮ ◭ ◮ Back Close
Full Screen / Esc
Printer-friendly Version Interactive Discussion
particle collection efficiency (CE) for the AMS was assumed to be 0.5 unless there was evidence of acidic aerosol. In cases of acidic aerosol, the CE was increased pro-portial to the mass fraction of sulfuric acid (CE=1) to ammonium bisulfate (CE=0.5) (Canagaratna et al., 2007; Takegawa et al., 2005; Quinn et al., 2006). The inte-gration of total signals for individual ions (“high-resolution sticks,” e.g. C2H3O+ and
5
C3H+7 at m/z 43) from raw mass spectral data was carried out using the “Pika” module of Squirrel developed by our group (http://cires.colorado.edu/jimenez-group/ ToFAMSResources/ToFSoftware/PikaInfo/), which follows the procedures described in DeCarlo et al. (2006). Sticks for spectra acquired in open (particles + air + mass spec-trometer background) and closed (only background) modes were calculated. Particle
10
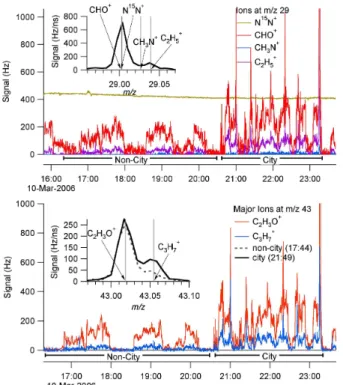
+ air signal for each ion was determined by the difference of the open signal and the closed signal. Air contributions to individual ions (e.g. CO+2 at m/z 44) were subtracted from the total signal at that ion. A correction at m/z 29 was also necessary, as the 2 most intense peaks CHO+ and 15NN+ (29.00274 and 29.00318 respectively), cannot be separated at the resolution of the instrument. N15N+ was calculated as a constant
15
fraction of the N+2 signal at m/z 28 from calibrations with a particle filter, with the re-maining signal assigned to the CHO+ ion. Two other peaks, corresponding to C2H+5 and CH3N+at m/z 29 were also resolved from the above two ions. Figure 1 shows ion signals at m/z 29 and 43 during research flight 3. Traces of the ion signals for this flight are shown and insets show the mass spectra for these m/z for one 12 s data point. The
20
inset for m/z 43 shows 2 different mass spectra corresponding to 2 different portions of the flight one city and one in the outflow. From this it is clear that the C2H3O+fragment is proportionately larger than the C3H+7 fragment, indicative of the larger contribution of oxygenated species (likely SOA) in the outflow and of more reduced species (such as traffic exhaust and less aged SOA) over the city.
25
2.2.3 Calculation of light scattering from AMS data
AMS total size distributions from PToF mode were averaged to a 5 min timebase for RFs 1, 2, 3, 9, 10 11, and 12. The total NR size distribution was converted to a number
ACPD
7, 18269–18317, 2007Aerosol size and chemistry measurements during MILAGRO P. F. DeCarlo et al. Title Page Abstract Introduction Conclusions References Tables Figures ◭ ◮ ◭ ◮ Back Close
Full Screen / Esc
Printer-friendly Version Interactive Discussion
distribution vs. volume-equivalent diameter (dN/dlogdve), assuming spherical particles
and using the bulk density of the aerosol calculated from the chemical composition for each 5 min average, according to the conversions detailed in DeCarlo et al. (2004). Scattering was calculated for this distribution using the routine of Bohren and Huffman (1983) translated into Igor (C. Brock, NOAA, personal communication, 2006). We used
5
a refractive index of 1.54, which is the average of the refractive indices for Ammo-nium Sulfate (1.55), and organics (1.53) (Hand et al., 2002; Kleinman et al., 2007a) and calculated scattering at 550 nm to compare to the Nephelometer, which measured submicron scattering at that wavelength.
2.2.4 Elemental analysis of organic aerosol from AMS data
10
Elemental analysis was performed on the high-resolution data following the method described in Aiken et al. (2007b). Inorganic and air ions were removed so only organic ions were included in the calculation of elemental ratios. Oxygen-to-carbon atomic ra-tios of the organic aerosol (O/C) and hydrogen-to-carbon (H/C) were determined, as well as the organic mass-to-organic carbon ratio (OM/OC). The nitrogen-to-carbon
ra-15
tio was calculated, however the V-mode does not have enough resolution to reliably quantify some N-containing ions, so the absolute N/C ratio is not reported, although it is used in the OM/OC calculation. W-mode data from the T0 supersite in Mexico City show that organic N/C is typically more than an order of magnitude smaller than the O/C, comparable to the N/C ratio found on the C-130. Thus errors in the reported
20
OM/OC due to imprecision in the N/C ratios derived here should be small. Organoni-trates and organosulfates can produce nominally “inorganic” ions in the AMS (e.g. NO+, NO+2, SO+, SO+2). Ignoring these ions will result in a negative bias on the O/C and OM/OC. However the analysis of the stoichiometric neutralization of ammonium vs. ni-trate, sulfate, and chloride (discussed below, see also Zhang et al., 2007b) suggests
25
that the contribution of these types of species (and thus the associated errors in O/C and OM/OC) is small. To avoid the effect of noise at low OA concentrations, ratios are only reported when the OA mass was larger than 2µg m−3.
ACPD
7, 18269–18317, 2007Aerosol size and chemistry measurements during MILAGRO P. F. DeCarlo et al. Title Page Abstract Introduction Conclusions References Tables Figures ◭ ◮ ◭ ◮ Back Close
Full Screen / Esc
Printer-friendly Version Interactive Discussion
3 Results and discussion
3.1 Aerosol measurement intercomparisons
Data were averaged up to the timebase of the slower measurement when comparing with different instruments. The AMS mass and calculated volume and the Nephelome-ter submicron scatNephelome-tering were reported at approximately 12 s per data point, and for
5
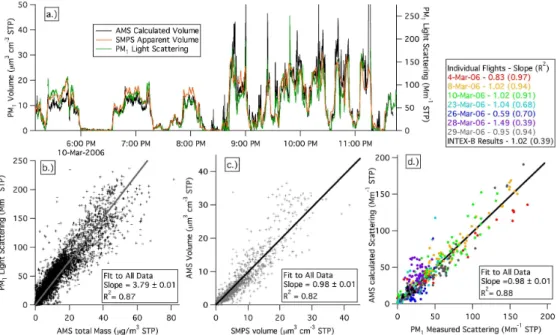
comparisons Nephelometer data was averaged to the AMS timebase. The SMPS data was recorded on a 96 s timebase, for this comparison AMS data was averaged to the SMPS timebase. The calculation of scattering from AMS size distribution data was done on a 5 m time grid as the size distributions have lower signal to noise ratios than total mass concentrations and require more time integration. Figure 2a shows a
10
timeseries from RF 3 (10 March 2006) for calculated AMS volume, measured SMPS volume, and measured PM1Light Scattering. All data is shown in Fig. 2a at its native sampling resolution, and high correlation among the measurements is seen. Although only one flight is shown, other flights show similar agreement. Correlations between the different measurements for the whole campaign are discussed in the following
sec-15
tions. Note that data from takeoff and landing were excluded from these comparisons since the inlet for the AMS was in a different location on the plane than the Nephelome-ter and SMPS, and particles generated by the landing gear and exhaust are sampled differently for these portions of flights.
3.1.1 AMS vs. Nephelometer comparison
20
A direct comparison of Nephelometer Scattering to NR-submicron aerosol mass for the entire MILAGRO campaign shows high correlation (see Fig. 2b). The slope of the linear regression (3.79 m2/g) is equivalent the Mass Scattering Efficiency (MSE), and is in good agreement with the range of dry MSE values of 3.6±1.3 m2/g reported by Shinozuka et al. (2007). Some of the scatter can be explained by differences in the
25
exact size cuts of both instruments, and of sampling timebase, frequency, and different 18282
ACPD
7, 18269–18317, 2007Aerosol size and chemistry measurements during MILAGRO P. F. DeCarlo et al. Title Page Abstract Introduction Conclusions References Tables Figures ◭ ◮ ◭ ◮ Back Close
Full Screen / Esc
Printer-friendly Version Interactive Discussion
inlet locations on the plane. The AMS sampled in MS mode approximately half of the time, while the Nephelometer was sampling continuously. Short plumes (∼6 s or less equivalent to approximately 600 m at 100 m/s) could be missed by the AMS or be sampled and be non-representative of the average mass loading for the period in question. The regression of submicron Nephelometer scattering to AMS calculated
5
volume gave a slope (Volume Scattering Effciency) of 5.50 m2cm−3(R2=0.86). 3.1.2 AMS and SMPS volume comparison
Figure 2c shows a scatter plot of AMS calculated volume vs. SMPS apparent volume (calculated with the assumption of spherical particles, see DeCarlo et al. (2004) for the relation to actual volume) for all overlapping data during MIRAGE. Again, good
agree-10
ment is found with a slope of 0.98 (R2=0.82). Perfect agreement is not expected due to lack of complete overlap in the measured size ranges, effects on sizing of particle non-sphericity, and since SMPS is measuring a different particle size at each point in space (time), while the AMS does an interleaved average as discussed above. Based on preliminary data, black carbon makes up 1–3% of the submicron mass during
MI-15
RAGE (R. Subramanian, DMT, personal communication), and would make up slightly less of the submicron volume due to the higher density values for black carbon (Park et al., 2004) in relation to the dominant organic constituents, consequently the AMS calculated volume is not expected to be significantly impacted by the exclusion of black carbon. At high mass loadings the AMS is above the fit line, which could be due to
20
ammonium nitrate evaporation in the SMPS (Gysel et al., 2006), which was maintained at 40◦C to improve RH control in the tandem differential differential mobility analyzer (TDMA) that was located in the same enclosure as the SMPS.
3.1.3 Calculated scattering vs measured scattering
Scattering calculated from AMS size-resolved composition was compared to the
aver-25
aged nephelometer measurements. Figure 2d shows that agreement is good for most 18283
ACPD
7, 18269–18317, 2007Aerosol size and chemistry measurements during MILAGRO P. F. DeCarlo et al. Title Page Abstract Introduction Conclusions References Tables Figures ◭ ◮ ◭ ◮ Back Close
Full Screen / Esc
Printer-friendly Version Interactive Discussion
of the flights. During flights with lower aerosol concentrations there is more scatter, likely because the AMS size distributions are noisier for low loading. Calculated scat-tering from INTEX-B was also included in this figure to show the general agreement with MIRAGE and shows the lower loadings sampled during the INTEX-B campaign (Dunlea et al., 20071).
5
3.2 Submicron aerosol chemistry over and away from Mexico City
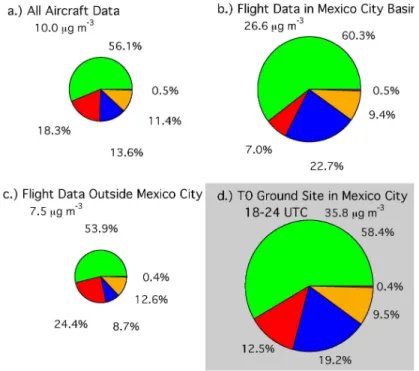
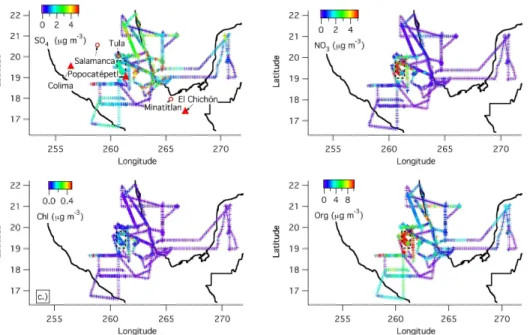
Bulk NR-PM1composition was averaged for the whole aircraft campaign as well as for periods when the aircraft was over Mexico City (defined as the box between 19.814, 19.023 N, and 260.577 and 261.379). Figure 3a–c show this information. Figure 3d shows the average aerosol composition as measured at the ground during the entire
10
campaign at the T0 supersite (19.48973 N, −99.1501 W) at the typical times of day (noon-6 PM local time) when the C-130 flew over the city. The average for the whole campaign was used for T0 as there were only a few direct flyovers and both instruments were not always operating during those times, and also because the bulk aerosol com-position was not highly variable at T0. The relative concentrations of organic and total
15
inorganic species are very similar. The even larger fraction of organics reported during the MCMA-2003 study (Salcedo et al., 2006) are due to the average reported for that campaign to be from a full day. This is because there are higher primary organics and lower ammonium nitrate concentrations during evenings, nights, and early mornings.
The spatial and vertical distribution of the species showed significant differences.
20
Figure 3c shows that away from the city the total average concentration is ∼1/4 of that over the city, confirming the importance of the MCMA as a regional source, and with an increased fraction of sulfate at the expense of nitrate. In general, sulfate was more of a regional component to the aerosol, while nitrate was localized to the city and in the near-outflow. This is consistent with the conclusions of Salcedo et al. (2006),
25
who based them on the rapid variability and strong diurnal cycles of nitrate in the city, versus the much more constant and slowly varying levels of sulfate, as well as the fact that OH + NO2 could explain the nitrate increases observed in the mornings, while
ACPD
7, 18269–18317, 2007Aerosol size and chemistry measurements during MILAGRO P. F. DeCarlo et al. Title Page Abstract Introduction Conclusions References Tables Figures ◭ ◮ ◭ ◮ Back Close
Full Screen / Esc
Printer-friendly Version Interactive Discussion
sulfate formation from OH + SO2was small compared to the concentrations observed. Spatial maps of NR-PM1 sulfate, nitrate, and chloride are shown in Fig. 4a–c. Both industrial sources and volcanic sources have been identified as potentially contributing to the aerosol sulfate in the basin (de Foy et al., 2007; Johnson et al., 2006b; Raga et al., 1999; Salcedo et al., 2006). The maps show the more regional distribution
5
of sulfate with significant structure indicating the influence of the large SO2 sources from industrial complexes (e.g. Tula and refineries near Veracruz) and active volcanoes (e.g. Popocateptl). Submicron aerosol nitrate appears to be in the form of ammonium nitrate, based on the ammonium balance and observed fragmentation pattern (see below), while the fractional contribution of organic nitrates to total nitrate appears to be
10
small. Nitrate shows a dominant source in the city basin, and correlates strongly with CO in the city basin (R2=0.79) but not with HCN (R2=0.10) indicating the dominance of the urban non-fire source for this species. Mexico City is characterized by high concentrations of gas-phase NH3that favor its co-condensation with nitric acid to form semivolatile ammonium nitrate (San Martini et al., 2006). In contrast, fires plumes
15
around Mexico City have a large excess of NOxvs. NH3(Yokelson et al., 2007), which may explain the their limited ammonium nitrate formation. Nitrate shows a very large fractional reduction in the outflow, most likely due to evaporation upon dilution with regional air with low HNO3 and NH3. HNO3 also reacts with dust in the Mexico City area forming mineral nitrates in the supermicron mode (Fountoukis et al., 2007; Moffet
20
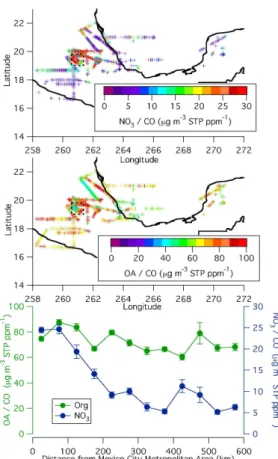
et al., 2007; Querol et al., 2007) that would not be detected by the AMS. However the dust spatial and temporal distribution is highly variable and is unlikely to be the only cause of the pronounced decrease in nitrate away from the city observed in this study. Figures 5a–c show the ratio of organic and nitrate aerosol to excess CO to remove the effect of dilution in the cleaner regional air. Clearly nitrate shows a large
25
reduction with distance from the Mexico City urban area, while OA does not. Although aerosol nitrate does not completely disappear, its ratio to CO decreases quickly and has dropped by nearly a factor of 4 by the time the aircraft is 200 km from the city basin. The OA/CO ratio in the outflow near the city is about 80µg m−3 STP ppm−1, which is
ACPD
7, 18269–18317, 2007Aerosol size and chemistry measurements during MILAGRO P. F. DeCarlo et al. Title Page Abstract Introduction Conclusions References Tables Figures ◭ ◮ ◭ ◮ Back Close
Full Screen / Esc
Printer-friendly Version Interactive Discussion
similar to the value found by Kleinman et al. (2007b), for their study of the near outflow on the DOE G-1 aircraft. Both the asymptotic value of OA/CO and the timescale of SOA formation of approximately one day are similar to findings reported for the outflow of the Northeastern U.S. (de Gouw et al., 2007; de Gouw et al., 2005; Kleinman et al., 2007a; Peltier et al., 2007a), and of the Po Valley in Italy (Crosier et al., 2007).
5
The fact that similar asymptotic values are observed despite lower biogenic emissions during MILAGRO versus the summer in New England could be due to the higher BB emissions in Mexico during this study (Yokelson et al., 2007).
NR-Chloride shows sources both in and outside of the Mexico City basin. Often the NR-Chloride is associated with HCN indicating a fire source, however there are
10
instances of chloride plumes without an associated increase in HCN, indicating other sources as well, consistent with previous results (Salcedo et al., 2006) and studies at other locations (Tanaka et al., 2003). The nitrate fraction showed an enhancement in the plane data at altitude as compared with the ground data consistent with previous studies (Morino et al., 2006; Neuman et al., 2003) likely due to additional ammonium
15
nitrate condensation with lower temperature and higher relative humidity aloft, whereas the average mass fraction of aerosol sulfate at the T0 ground site was higher than it was aloft over the city basin measured by the C-130 during the MIRAGE campaign.
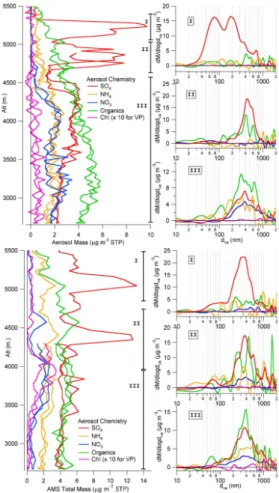
Figure 6 shows two vertical profiles performed outside of the city basin to the east of the Popocatepetl volcano during RF 12 (29 March 2006). During the first vertical
20
profile (17:30–18:00 UTC) 2 acidic sulfate layers are seen at high altitude, which have increased in vertical separation later in the flight when a second vertical profile (2100-2120 UTC) was made in the same area. Size distributions for the parts of the vertical profile marked I, II, and III are shown to the right of the vertical profile. The first vertical profile shows that the highest sulfate layer (I) has small aerosol size modes of highly
25
acidic sulfate most likely from recent nucleation and growth in the volcanic plume, simi-lar to the nucleation and growth study of Zhang et al. (2004). The second, sulfate layer (II), lower in altitude, consists of larger particles, indicating a more aged layer but still very acidic, and the lowest layer (III) extending to the bottom of the profile contains
ACPD
7, 18269–18317, 2007Aerosol size and chemistry measurements during MILAGRO P. F. DeCarlo et al. Title Page Abstract Introduction Conclusions References Tables Figures ◭ ◮ ◭ ◮ Back Close
Full Screen / Esc
Printer-friendly Version Interactive Discussion
a mix of organics, ammonium sulfate and ammonium nitrate is likely pollution trans-ported from the Puebla basin based on back trajectories. The second vertical profile performed 3.5 h later indicates that the most of the particles in the highest layer (I) have grown to or coagulated with accumulation mode sizes and increased the sulfate mass loading. However there is still a significant tail of mass at particle sizes less than
5
100 nm. The other 2 size distributions related to layers II and III have not changed significantly during that time. No enhancement of organics is found in the acidic sulfate layers, consistent with other recent field studies that find no evidence for significant acid-catalyzed SOA formation in the atmosphere (Peltier et al., 2007b; Zhang et al., 2007b). This case study demonstrates the vertical heterogeneity of the aerosol
com-10
position, as well as the high signal-to-noise of the HR-ToF-AMS in the V MS mode, and the ability of the instrument to rapidly determine meaningful chemically-resolved size distributions.
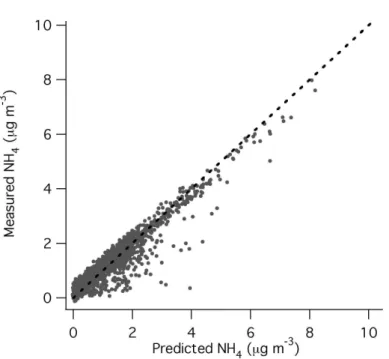
The charge balance of ammonium to inorganic anions (sulfate, nitrate, chloride) can be used to evaluate the acidity or neutralization of the aerosol as long as the
contri-15
bution of mineral cations (Ca+, K+ etc.) is small (Zhang et al., 2007b). This balance is shown in Fig. 7. Large relative concentrations of supermicron volume to submi-cron volume can influence submisubmi-cron ion balance due to tailing of the supermisubmi-cron size distribution (and associate mineral cations) into the submicron. A comparison of the supermicron volume (likely dominated by mineral dust) and submicron volume
20
from the Optical Particle Sizer, operated by the University of Hawaii, indicate that with the exception of a few short plumes submicron volume was typically a factor of 2 or more larger than supermicron volume. This suggests that the contribution of mineral cations to the charge balance due to the submicron tail of the dust mode was small. Charge balance is observed within the scatter for most datapoints, which indicates that
25
ammonium nitrate and sulfate are the predominant forms of nitrate and sulfate in the submicron aerosol. There are, however, instances of highly acidic sulfate plumes orig-inating in some instances from the Popocatepetl volcano (as shown in Fig. 5) and in other instances from petrochemical or power plant complexes such as Tula.
ACPD
7, 18269–18317, 2007Aerosol size and chemistry measurements during MILAGRO P. F. DeCarlo et al. Title Page Abstract Introduction Conclusions References Tables Figures ◭ ◮ ◭ ◮ Back Close
Full Screen / Esc
Printer-friendly Version Interactive Discussion
3.3 O/C atomic ratios of organic aerosol
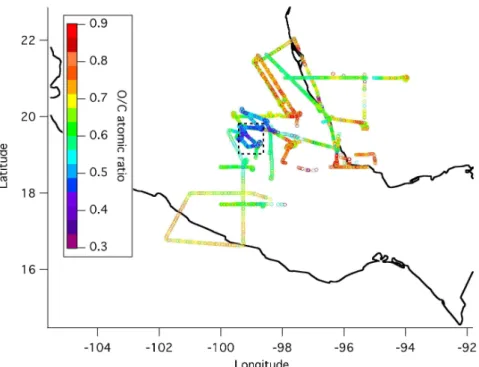
O/C atomic ratios for the total organic aerosol were calculated from the HR spectra with the procedure described by Aiken et al. (2007b, c5). Figure 8 shows flight tracks for RFs 1, 2, 3, 11, and 12 colored by the organic O/C ratio. This figure clearly shows an increase in the O/C ratio away from the city, with maximum values around ∼0.9. The
5
range of values observed for OM/OC is 1.5–2.3, with the lower values corresponding to air over the city and the larger ones to aged regional air. It is also important to notice that even above Mexico City the O/C ratio is already ∼0.4 and above, which already represents a highly oxygenated aerosol. This is likely due to flights through the city occurring in the early to late afternoon when photochemical SOA formation has already
10
been active for hours (Kleinman et al., 2007b; Salcedo et al., 2006; Volkamer et al., 2006). Primary urban emissions from vehicles have much lower O/C ratios around 0.06–0.1 (Aiken et al., 2007c5). This indicates that a significant amount of secondary formation has already occurred by the time the C-130 reaches the city.
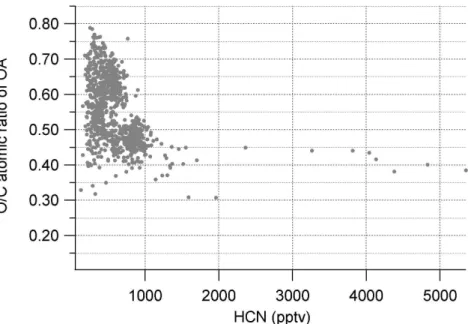
The influence of BB on the organic O/C ratio is investigated in Fig. 9 by plotting HCN
15
vs O/C ratio for RF3 (10 March 2006) which included high concentrations of BB aerosol over the Mexico City basin. Using a concentration of 1000 pptv or greater of HCN as an indicator of fresh BB plumes, the O/C range for P-BBOA is estimated as 0.3–0.45, which are similar to the values observed in laboratory BB experiments (Huffman et al., 20073; Aiken et al., 2007c5). The range of values may be due to both residence
20
time in the atmosphere (SOA formation, oxidation, and/or volatile evaporation due to dilution) and/or inherent variability in biomass burning plumes from differences in the vegetation burned and fire conditions (e.g. smoldering vs. flaming). Only a few plumes
5
Aiken, A. C., DeCarlo, P. F., Kroll, J. H., Worsnop, D., Zhang, Q., Sun, Y., Ulbrich, I., K., D., Ziemann, P. J., Alfarra, M. R., Duplissy, J., Metzger, A., Prevot, A. S. H., Dommen, J., Baltensperger, U., Takegawa, N., and Jimenez, J. L.: O/C and OM/OC ratios of primary, secondary, and ambient organic aerosols with a high-resolution time-of-flight aerosol mass spectrometer, submitted, 2007c.
ACPD
7, 18269–18317, 2007Aerosol size and chemistry measurements during MILAGRO P. F. DeCarlo et al. Title Page Abstract Introduction Conclusions References Tables Figures ◭ ◮ ◭ ◮ Back Close
Full Screen / Esc
Printer-friendly Version Interactive Discussion
were sampled, consequently the range of values may be broader than what is given here, but this is useful as a indicator of approximate O/C ratios for biomass burning.
From Fig. 8 it is clear that organic O/C ratios increase significantly away from the city, with distance being a proxy for the age of the aerosol; i.e. aerosol outside the city can have a city origin and have been aged during transport, or a regional non-city origin.
5
Regional air typically shows aged characteristics due to the longer average residence time of the OA sampled in the regional air (Zhang et al., 2005b; Zhang et al., 2005a). Since thermodynamics drives atmospheric organics towards increased oxidation, the increase in the organic O/C ratio is indicative of aging of the aerosol, and in the absence of calibration or kinetic modeling, it is a qualitative indicator of photochemical age.
10
Recent results by Huffman et al. (2007)3indicate that SOA is less volatile than urban POA and most P-BBOA, so some of the increase in the O/C ratio in the regional scale may be due to evaporation losses of more reduced species. This is likely not the dominant effect since primary O/C ratios are low for urban combustion emissions, and around 0.4 for biomass burning plumes, and to reach O/C ratios of 0.6–0.8 addition
15
of SOA of higher O/C ratios, or heterogeneous oxidation of the aerosol need to occur. However heterogeneous oxidation proceeds with longer timescales of the order of 1 week or longer (Molina et al., 2004; Murphy et al., 2007; Schauer et al., 1996; Zhang et al., 2005b). Heterogeneous reactions are too slow by a factor of ∼100 to explain the rate of O increase observed here, assuming that 2 O atoms are taken up by the OA
20
after reaction with OH with an uptake coefficient of 0.3 (assuming a particle diameter of 300 nm and an OH concentration of 2×10⁶molec cm−3). In contrast formation has a timescale around 1 day (de Gouw et al., 2005; Peltier et al., 2007a), so additional SOA formation (from urban and BB precursors) or additional gas-phase oxidation of semivolatile SOA species are the most likely reasons for the observed increase in O/C.
25
An increase in the O/C ratio while OA/CO stays approximately constant implies that there is a loss of carbon from the OA.
Another qualitative measure of photochemical age is the –log10(NOx/NOy) ratio (Kleinman et al., 2007a). This and other such ratios work best if there is an isolated
ACPD
7, 18269–18317, 2007Aerosol size and chemistry measurements during MILAGRO P. F. DeCarlo et al. Title Page Abstract Introduction Conclusions References Tables Figures ◭ ◮ ◭ ◮ Back Close
Full Screen / Esc
Printer-friendly Version Interactive Discussion
source or source region, which does not mix with other sources from emission to the time of sampling. This can be a problem when using this ratio when urban pollution mixes with fire plumes, as fire plumes from the pine forests near Mexico City had high NOxemissions (Yokelson et al., 2007). When air from different sources mixes this pho-tochemical clock is “reset” losing information on the age of pollution from both sources.
5
For this reason we compared the organic O/C atomic ratio to the –log10(NOx/NOy) from RF 12 (29-March-2006), when biomass burning was low, and gas phase data of HCN and CO did not indicate recent biomass burning influence. Figure 10 shows a comparison between the –log10(NOx/NOy) ratio and the O/C ratio. There is a clear trend which shows the increase in the –log10(NOx/NOy) ratio with increasing O/C ratio,
10
indicating that this is a good qualitative clock for photochemical age. The x-intercept of the regression occurs at approximately an O/C ratio of 0.55. The reason for this high value is potentially due to the C-130 arrival into the city in the mid afternoon, by which time a significant fraction of the total SOA formation has already occurred. The –log10(NOx/NOy) clock can also be “reset” by mixing fresh high NOxplumes with older
15
pollution. Since secondary OA mass exceeds primary OA the mixing of a fresh plume with low concentrations of OA (and low O/C) would only minimally affect the O/C ratio which would be dominated by the higher O/C ratio of the secondary OA. The group of points above the value of 1.5 for –log10(NOx/NOy) come from a leg of the flight at 18.67 N from 95.88 to 95.16 W longitude, just inland from the Gulf of Mexico and in
20
the vicinity of petrochemical refineries and processing facilities. It is likely that the re-lationship of –log10(NOx/NOy) to O/C atomic ratio for this section of the flight is more indicative of an aged industrial plume than an urban plume.
3.4 Case study: research flight 2, 8 March 2006
RF 2 provides the opportunity to combine the analysis techniques discussed above
25
into a detailed picture of the aerosol for this flight. AMS sampling for this flight began 1 h into the flight due to pump down requirements after lack of ground power. The flight consisted of 3 general sampling regimes. The first regime sampled aged outflow from
ACPD
7, 18269–18317, 2007Aerosol size and chemistry measurements during MILAGRO P. F. DeCarlo et al. Title Page Abstract Introduction Conclusions References Tables Figures ◭ ◮ ◭ ◮ Back Close
Full Screen / Esc
Printer-friendly Version Interactive Discussion
the previous day southwest of the city basin where the forecast models predicted it to be located. The second portion of the flight involved a standard city flight pattern with the C-130 entering the city basin from the northwest and flying south along the western edge of the basin. The plane then turned east and flew along the southern edge of the basin, turning around in the southeast corner of the basin and flying northwest across
5
the city. A pass over the T0 supersite and stacked legs over the T1 supersite were then performed. The final portion of the flight consisted of stacked legs to the east of the city basin sampling same day pollution which had been advected to that vicinity based on the meteorological predictions.
Figure 11 shows the time traces of many pollutants and properties of the pollutants,
10
and is discussed in detail in the following text. Figure 11e shows the day tagged CO emissions from the MOZART model, and qualitatively indicates the age of the sampled air mass. Early in the flight the air mass is clearly more aged than the latter portion of the flight, and is generally characterized by lower aerosol loadings dominated by organics with sulfate as the dominant inorganic component (Fig. 11c and d), with the
15
highest aerosol O/C atomic ratios (up to 0.7) and OM/OC ratios (around 2.0) of any portion of the flight (Fig. 11b). The average size distribution for this portion of the flight shows the mass diameter peaking around 300 nmdva for organics and slightly larger
at 400 nmdvafor ammonium sulfate, which is the dominant inorganic component. The ammonium size distributions shown in Fig. 11f–i, are noisy due to the water
back-20
ground in the mass spectrometer resulting from limited pumping time, but are shown for completeness. The OA/CO ratio for the first portion of the flight (Fig. 11a) averages 70µg m−3STP ppmv−1with a standard deviation of +/−11 µg m−3STP ppmv−1.
As the C-130 enters the city basin around 21:00 UTC (03:00 p.m. local time), MOZART CO age indicates that ∼80% of the CO is from the same day emissions
25
(Fig. 11e). Aerosol nitrate becomes the dominant inorganic aerosol component, with organic aerosol still dominating the submicron mass (Fig. 11c and d). The organic O/C atomic ratio and OM/OC ratio reach the lowest values for the flight (approximately 0.4 and 1.6 respectively). Size distributions show organics and ammonium nitrate peaking
ACPD
7, 18269–18317, 2007Aerosol size and chemistry measurements during MILAGRO P. F. DeCarlo et al. Title Page Abstract Introduction Conclusions References Tables Figures ◭ ◮ ◭ ◮ Back Close
Full Screen / Esc
Printer-friendly Version Interactive Discussion
at 350 nm dva. Sulfate is a minor component of the aerosol, but shows a slightly higher mass diameter around 450 nmdva indicative of its more aged and regional character
(Fig. 11g). The OA/CO ratios (Fig. 11a) are highly variable indicating the influence of fire emissions on the aerosol. Lower values of approximately 40µg m−3STP ppmv−1 CO are reached during the periods marked I and III in Fig. 11d. These periods are
5
associated with high CO, high aerosol nitrate, and are indicative of “fresh” urban SOA. The period marked II in Fig. 11d has a higher OA/CO ratio averaging 100µg m−3STP ppmv−1CO, and is associated with high levels of HCN, and NR-aerosol chloride. AMS
m/z 60 is used as a marker for biomass burning (Alfarra et al., 2007; Schneider et al.,
2006), however, it is not completely unique to fire emissions, and during non-fire
peri-10
ods m/z 60 makes up approximately 0.3% of the organic mass. By subtracting 0.3% of the organic mass from m/z 60 we have a good indication of the fire contribution to sig-nal at this m/z. This scaled m/z 60 also increased during period II, adding yet another indication of the influence of a fire source. This marker appears to be a good tracer for fresh fire plumes during this study. Although it is possible that this marker is partially
15
lost due to volatilization (Huffman et al., 20073) and/or photochemical reactions with aging, recent field results indicate that its lifetime is of at least two days in the bound-ary layer (Lee et al., 2008). Finally during period II, the presence of ∼5µg m−3STP of ammonium nitrate indicates that there is still a large urban influence in this plume.
Figure 12a shows the mass spectrum for the period I. This mass spectrum is very
20
similar to observed organic spectra from other urban locations (Alfarra et al., 2004; Zhang et al., 2005b). A comparison of the fractional contribution of each m/z to the total organic signal using the procedure of Alfarra et al. (2006), shows differences in the spectra from periods I and II and the similarity for periods I and III (Fig. 11b and c). When comparing the fire-dominated period (II) with the urban-dominated period I, only
25
a few peaks below m/z 120 have a higher percent contribution to the aerosol mass. The most pronounced ions that are larger in BB plumes are m/z 60 and 73, which are found in the mass spectra of levoglucosan (a component of biomass burning aerosol), and have been shown to be marker peaks for biomass burning in ambient air (Alfarra et al.,
ACPD
7, 18269–18317, 2007Aerosol size and chemistry measurements during MILAGRO P. F. DeCarlo et al. Title Page Abstract Introduction Conclusions References Tables Figures ◭ ◮ ◭ ◮ Back Close
Full Screen / Esc
Printer-friendly Version Interactive Discussion
2007; Schneider et al., 2006). Although not shown the same pattern emerges when comparing period II with period III. Figure 12c demonstrates the similarity between periods I and III with very little change in the relative contributions for the mass spectra. Deviations from the 0% change in contribution are mostly due to noise at m/z with low S/N. Also clear from this plot is the increase in the contribution to organic mass of
5
high m/z (above m/z 120) for biomass burning. While the majority of the signal in all cases (I-III) is below m/z 100 (91.4%, 90.6%, 91.5%, for Cases I-III respectively) this indicates that biomass burning plumes contain either larger molecules, or molecules more resistant to fragmentation than those in urban POA and SOA.
The final portion of the flight showed increases in the O/C atomic ratio and OM/OC
10
ratio compared to the city (Fig. 11b), but these variables did not increase to the levels seen in the aged outflow from the early part of the flight, consistent with the lower average age of the air predicted by MOZART. This part of the flight also included some advected fire plumes indicated by increases in the OA/CO ratio (up to 250µg m−3STP ppmv−1), HCN, NR-chloride, and m/z 60 (Fig. 11b and c). Size distributions for the
15
period marked same day outflow (OF), and fire plume are shown in Fig. 11h and i. The same day outflow size distribution shows a clear drop in aerosol nitrate from the city plume, reduced importance of ultrafine particles below 100 nm, and a peak in the distribution at 300 nm dva. The fire plume distribution shows the clear dominance of organics in the fire plume, and the presence of nitrate in the size distribution suggests
20
that the fire plume is adding to the urban pollution, although a some of the nitrate may also originate from fire emissions. The mass size distribution for the fire plume peaks at a slightly smaller size of 250 nmdva.
4 Conclusions
A HR-ToF-AMS was flown for the first time during the MILAGRO campaign. The
per-25
formance of the instrument was very good, providing 12-s quantitative aerosol size and chemistry data. Comparisons between submicron volume from a SMPS, and light
ACPD
7, 18269–18317, 2007Aerosol size and chemistry measurements during MILAGRO P. F. DeCarlo et al. Title Page Abstract Introduction Conclusions References Tables Figures ◭ ◮ ◭ ◮ Back Close
Full Screen / Esc
Printer-friendly Version Interactive Discussion
scattering confirm the quantification of the AMS data. Organic species dominated the submicron aerosol both near the source and in the outflow and regional air. Inorganic components also made a large contribution, with different species showing different spatial characteristics. Aerosol sulfate had a more regional but still somewhat struc-tured character with clear volcanic and petrochemical/power plant sources. Submicron
5
nitrate showed a strong city source and a high correlation with CO that links it to urban emissions. The higher source strength of NH3in the city versus the fires may explain the preferential formation of nitrate in city air, given the comparable NOx emissions of both sources. Ammonium was associated with nitrate and sulfate, indicating the dom-inant forms of these species were ammonium nitrate and ammonium sulfate
respec-10
tively. NR- aerosol chloride was often associated with HCN indicating a fire source, although some chloride plumes did not show this correlation, indicating other sources of NR chloride. Organic aerosol had strong correlations with both CO and HCN indi-cating both urban and biomass burning sources. The organic O/C atomic ratio showed more reduced aerosol near the city/source regions and higher values farther from the
15
city. O/C was also shown to be a qualitative photochemical clock by comparison to –log10(NOx/NOy). SOA formation from urban sources quickly overwhelms urban POA emissions as shown by the increase of the O/C ratio to values much larger than those of urban POA, and consistent with the results of Volkamer et al. (2006) and Kleinman et al. (2007b). A case study of the 8 March 2006 research flight illustrates the conclusions
20
above, and indicates that in the AMS mass spectra of BBOA the larger m/z fragments are enhanced, and that m/z 60 and m/z 73 are good marker peaks for biomass burning aerosol in this study.
Acknowledgements. We are grateful to the NCAR RAF and C-130 personnel for much help
and guidance during integration and research flights, especially A. Schanot, P. Romashkin,
25
and M. Lord. We thank R. Bahreini, C. Simmons, and A. Middlebrook of NOAA for help with integration and the PCI. We thank C. Brock of NOAA for providing Mie Scattering code in the Igor programming language. We are also grateful to the rest of the C-130 investigators, the Jimenez group, and J. Kroll for many helpful discussions. This study was supported by grants NSF ATM-0513116 and ATM-0449815, NASA NNG04GA67G and NNG06GB03G, UCAR/NSF
30
ACPD
7, 18269–18317, 2007Aerosol size and chemistry measurements during MILAGRO P. F. DeCarlo et al. Title Page Abstract Introduction Conclusions References Tables Figures ◭ ◮ ◭ ◮ Back Close
Full Screen / Esc
Printer-friendly Version Interactive Discussion
S05-39607, and by EPA fellowship FP-91650801 (to PFD) and NASA fellowship NNG04GR06H (to ACA).
References
Aiken, A. C., Cubison, M. J., Huffman, J. A., DeCarlo, P. F., Ulbrich, I., Docherty, K., Sueper, D. T., and Jimenez, J. L.: Organic aerosol analysis with the Aerodyne high
reso-5
lution time-of flight aerosol mass spectrometer (HR-ToF-AMS) at T0 in Mexico City during MILAGRO/MCMA-2006, American Association of Aerosol Research, Reno, NV, 2007a, Aiken, A. C., DeCarlo, P. F., and Jimenez, J. L.: Elemental analysis of organic species
with electron ionization high-resolution mass spectrometry, Anal. Chem., 79, 8350–8358, doi:10.102/ac71150w, 2007b.
10
Alfarra, M. R., Coe, H., Allan, J. D., Bower, K. N., Boudries, H., Canagaratna, M. R., Jimenez, J. L., Jayne, J. T., Garforth, A. A., Li, S. M., and Worsnop, D. R.: Characterization of urban and rural organic particulate in the lower Fraser Valley using two Aerodyne aerosol mass spectrometers, Atmos. Environ., 38, 5745–5758, 2004.
Alfarra, M. R., Paulsen, D., Gysel, M., Garforth, A. A., Dommen, J., Pr ´ev ˆot, A. S. H., Worsnop,
15
D. R., Baltensperger, U., and Coe, H.: A mass spectrometric study of secondary organic aerosols formed from the photooxidation of anthropogenic and biogenic precursors in a re-action chamber, Atmos. Chem. Phys. Discuss., 6, 7747–7789, 2006,
http://www.atmos-chem-phys-discuss.net/6/7747/2006/.
Alfarra, M. R., Prevot, A. S. H., Szidat, S., Sandradewi, J., Weimer, S., Lanz, V. A., Schreiber,
20
D., Mohr, M., and Baltensperger, U.: Identification of the mass spectral signature of organic aerosols from wood burning emissions, Environ. Sci. Technol., 41(16), 5770–5777, 2007. Anderson, T. L., Covert, D. S., Marshall, S. F., Laucks, M. L., Charlson, R. J., Waggoner, A. P.,
Ogren, J. A., Caldow, R., Holm, R. L., Quant, F. R., Sem, G. J., Wiedensohler, A., Ahlquist, N. A., and Bates, T. S.: Performance characteristics of a high-sensitivity, three-wavelength,
25
total scatter/backscatter nephelometer, J. Atmos. Ocean. Tech., 13, 967–986, 1996.
Anderson, T. L. and Ogren, J. A.: Determining aerosol radiative properties using the TSI 3563 integrating nephelometer, Aerosol Sci. Tech., 29, 57–69, 1998.
Anderson, T. L., Masonis, S. J., Covert, D. S., Ahlquist, N. C., Howell, S. G., Clarke, A. D., and McNaughton, C. S.: Variability of aerosol optical properties derived from in situ aircraft
mea-30