MASSACHUSES INSTITUTE OF TECHNOLOGY IFEB
1 520171
LIBRARIES
ARCHI ES
DESI
DESIGN
OUTCOMES
HOW
DESIGNERS
AND
TOOLS
INFLUENCE
3N QUALITY
AND
CREATIVITY
A STUDY OF INDIVIDUAL DESIGNERS
by ANDERS HAGG MAN
Funding for doctoral work has been provided in part by:
Tekniikan edistumissssti6 - Finnish Foundation for Technology Promotion
IK Investment Fund - The League of Finnish American Societies
Fulbright - Technology Industries of Finland Grant Suomen kulttuurirahasto - Finnish Cultural Foundation Emil Aaltosen ssstib
This thesis is typeset in:
Porter Bold, Porter Medium, Avenir Medium, Avenir Light, Baskerville, and Bookman Old Style Product sketches by Nathan Cooke.
DESIGN OUTCOMES:
HOW DESIGNERS AND TOOLS INFLUENCE
DESIGN QUALITY AND CREATIVITY
- A STUDY OF INDIVIDUAL DESIGNERS
Anders Hsggman
S.M. Mechanical Engineering, Teknillinen korkeakoulu, Finland, 2009
Submitted to the Department of Mechanical Engineering
in partial fulfilment of the requirements for the degree of
Doctor of Philosophy in Mechanical Engineering
at the
Massachusetts Institute of Technology February 2017
Massachusetts Institute of Technology 2017. All rights reserved.
Signature redacted
Author
Certified by
Anders Hsggman
Department of Mechanical Engineering 4 October 2016
Signature redacted
.
laria
C. Yang
Associate Professor of Mechanical Engineering Thesis Supervisor
Signature redacted
Accepted by
Rohan Abeyaratne
Quentin Berg Professor of Mechanics Chairman, Department Committee on Graduate Studies
Design outcomes:
how designers and tools influence design quality and creativity
- a study of individual designers
Anders Higgman
Submitted to the Department of Mechanical Engineering
on 4 October, 2016 in partial fulfilment of the requirements for
the degree of Doctor of Philosophy in Mechanical Engineering
ABSTRACT
The design process can be seen as a complex, ambiguous, ill-defined problem with no clearly correct answer. At the same time, the early stages of the design process carry importance with regard to design outcomes, sometimes with far reaching consequences. With the proliferation of computer modelling tools, designers are moving away from traditional design tools such as sketching, and begin designing in CAD earlier than before. This thesis focuses on the early stages of the design process, and on how selected design tools - sketching, foam prototyping, and computer modelling - influence the design outcomes of an individual designer in the early conceptual phases of the process.
Through the use of controlled design experiments with experienced design practitioners, this thesis seeks to examine how different design tools impact the design outcomes. Analysis of video and audio recordings, interviews, and talk-aloud protocols are used to gain insights, and investigate how different tools impact the design outcomes and decision making of individual designers in the early stages of the design process. As an example, does a designer who creates foam models - thereby receiving tactile feedback as they are creating the model
- consider ergonomics more than a designer working in CAD?
Results suggest clear differences in quantity and quality of concepts depending on which design tool was used, as well as between designers themselves, highlighting the importance of using an appropriate design process and set of tools in the early conceptual stages of a design task.
Thesis supervisor: Maria C. Yang
AnderS H ggman - Massachusetts e
of
n y 6DOCTORAL COMMITTEE
Thesis Supervisor
Professor Maria C. Yang
Massachusetts Institute of Technology
Professor Warren Seering Massachusetts Institute of Technology
Professor David Wallace
Massachusetts Institute of Technology
Professor Larry Leifer
ACKNOWLEDGEMENTS
There are too many people to possibly thank them all here, but I will do my best to mention those who have been most influential.
I moved to Cambridge several years ago with my young daughter Emilia and
wife Anna to pursue a PhD at MIT. I have learned a lot and experienced much during that time - none of which would have been possible without the support of my professors, colleagues, dear friends, and family. The friendships, laughs and support have kept me going.
My time here has been shaped by my PhD committee, and I have been
incredibly fortunate to have four professors who are passionate about design and mentoring serve on it: professors Maria Yang, Warren Seering, and David Wallace from MIT, and Larry Leifer from Stanford University.
My thesis advisor and mentor, Maria, is the reason I came to MIT - and more
importantly, endured. It is hard to imagine what my time here would have been like without Maria; the freedom to shape my own research has been rewarding, and her flexibility has made it possible to combine (by now) three small children with doctoral studies. Maria has been incredibly inspiring, understanding, and supportive in so many ways. She has been in one word - super!
I would like to thank Warren for his questions and comments, which were very
insightful (and kept me honest) while at the same time supportive and kind. I enjoyed our conversations about design research and will try to remember his advice going forward.
David is an inspirational teacher, enthusiastic about design, with a strong creative vision and attention to detail. His teaching style is something I aspire towards and try to emulate, and it is always fun to talk with David about design or our shared links to The Soo.
If Maria is the reason I chose to come to MIT, then Larry is the reason I was able to come to MIT. Larry gave me an opportunity almost ten years ago, which has made all the difference in the world. The simple description would be to say that he changed my life. Larry is one of the warmest human beings I have ever met, with a sense of humour and wild creativity.
I owe a great deal to my friend Geoff Tsai. We have completed our doctoral
journeys together - from qualifying exams to defending a few days apart. Geoff is an inspiration and has pushed me to do better design and research work. He has been a valued source of feedback on all matters of design, and I have appreciated his friendship.
I would also like to thank my other two research colleagues Tomonori Honda and Catherine Elsen, who were an integral part of my research and shaped it in many ways. Tomo's keen analytical mind kept the analysis on track, while Catherine was an important part of the design of the experiments. Catherine Fox was also a great help with data processing.
The Ideation Lab has been an unforgettable home, and the people in it exceptional. Everyone I have crossed paths with has shaped my time at MIT in some way, but I would especially like to thank Jesse Austin-Breneman, Jim Christian, Alison Olechowski and Janet Yun for their friendship. You have been an important part of my life at MIT. I would also like to thank my friends at Eastgate, for creating a community.
Before coming to MIT, Kalevi 'Eetu' Ekman, Matti Hamalainen and Lauri Repokari at Teknillinen korkeakoulu were instrumental in introducing me to product design, and were there in the beginning.
T. Shawn McGrath introduced me to science, engineering and most of all, critical thinking. Thank you for believing in me when others did not, and for being a mentor and a friend. I will always think back fondly to our time in Windhoek. Thank you for everything you taught me - I would have had so much
more to learn. I wish you could have seen me graduate, although I am sure in your mind there was no doubt I would.
Sten-Erik Haggman, my uncle, for all the conversations, help and encouragement, I thank you. Our farewell came all too soon, but I am happy for the time we had.
I would also like to thank my parents, Pirjo and Bjarne, for the endless support
throughout the years. Thank you for giving me the freedom to chart my own path, even though at times the destination was unclear. Thank you for all the support and help during our time at MIT. Without you none of this would have been possible.
A big thank you to my little brother, Anton. Although five years younger, you
have never let that bother you and with your example you have always challenged me to do better. I admire your courage to pursue your dreams.
Finally, I would like to thank my family; my three lovely daughters, Emilia, Matilda, and Lina - who mean everything to me, for being inquisitive, outrageous, hilarious, and empathetic - you have demanded much, but given infinitely more, and my wife, Anna, for making it all possible. Without all your sacrifices I would not have been able to pursue my dreams, and for that I am eternally grateful. Thank you. I love you all.
Signature redacted
CONTENTS
1
INTRODUCTION
...
1
1.1 The design process ... 1
1.2 The early stages m atter ... 3
1.3 Research questions ... 4
2 LITERATURE
REVIEW ...
7
2.1 D esig n to o ls ... 7
2.2 Mechanical Turk as a research tool... 11
3 METHODOLOGY...15
3.1 Intro d uctio n ... 15 3.2 Control 3.2.1 3.2.2 3.2.3 3.2.4 3.2.5 3.2.6 3.2.7 3.2.8 led design experiments ... 17Experimental set-up for part I...18
Experimental set-up for part 11...21
Participant recruitm ent... 23
Assigning participants into groups ... 24
Additional warm-up task for part II ... 25
Description of the main design task ... 27
Running the experiment ... 29
Processing data from design experiment ... 29
3.3 User preference survey ... 30
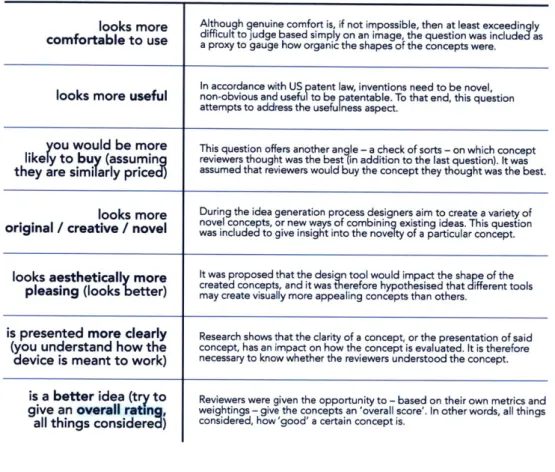
3.3.1 What is good design? ... ... . . . 31
3.3.2 Survey design of pairwise comparison ... 31
3.3.3 Design practitioner survey ... 40
3.4
Design attributes
...
40
4 ANALYSIS& RESULTS
...
45
4.1
Introd uctio n
...
. 45
4.2 Who decides what is good design?...
... . . .45
4.2.1 Concept reviews - design practitioners...46
4.2.2 Concept reviews - novice population...50
4.2.3 Concept reviews - survey statistics
...
57
4.3 W hich design is best?
...
... ... . . .58
4.3.1 Colley- and optimised concept rankings...59
4.3.2 Correlations between design category ranks...62
4.4
How do designers design?...
... . . .66
4.4.1 Video analysis of design process...67
4.4.2 Creating categories for design activity types...69
4.4.3 Quality of the transcription data...72
4.4.4 Designer verbalisation during design task
...
75
4.5
How were good designs created?...79
4.5.1 Duration of design time
...
80
4.5.2 Impact of tool on design quality of concepts...82
4.5.3 Impact of tool on number of concepts created
...
83
4.5.4 Number of concepts and design quality
...
85
4.5.5 Concept sequence and idea quality
...
87
4.5.6 D esign attributes
...
90
4.5.7 D esigner types
...
94
5 DISCUSSION
...
105
5.1
G ene ral re m arks
...
105
6 FUTURE WORK... 109
6.1 Expansion of original study ... 109 6.2 Repeating study with a different task ... 109 6 .3 E E G ... 1 10
LIST OF TABLES
Table 1 -Type of data collected during parts
I
and II...17Table 2 - Exam ples of verbal output ... 25
Table 3 - Acceptable and unacceptable answers for talk-aloud task...26
Table 4 - Evaluation metrics used in the pairwise comparisons of concepts...36
Table 5 - Q uality control questions ... 39
Table 6 - Initial list of design attributes ... 41
Table 7 - Rank accuracy sum m ary... 62
Table 8 - Four designer action categories used in video analysis ... 68
Table 9 - Talk-aloud protocol verbalisation categories ... 71
Table 10 - Heat map of designer verbalisation, in five-minute bins ... 77
Table 11 - Final list of design attributes ... 91
LIST OF FIGURES
Figure 1 - The Design Process as Described by Damian Newman...2
Figure 2 - IDEO prototype for medical device ... 9
Figure 3 - D ata collection periods ... 15
Figure 4 - Experim ental setup for part I ... 20
Figure 5 - Experimental setup for part
II,
with placement of observer...22Figure 6 - Pairwise comparison page of online survey, top section ... 33
Figure 7 - Pairwise comparison page of online survey, bottom section ... 34
Figure 8 - Design attributes, form factor example ... 43
Figure 9 - Design attributes, input exam ple ... 44
Figure 10 - Design attributes, interaction example...44
Figure 11 - Practitioners' ages and genders ... 47
Figure 12 - Practitioners' educational and geographical backgrounds ... 47
Figure 13 - Practitioners' design background... 48
Figure 14 - Practitioners' work experience in a design related field ... 49
Figure 15 - Weekly responses by design practitioners ... 49
Figure 16 - Novice reviewers' ages and genders ... 50
Figure 17 - Novice reviewers' educational and geographical backgrounds...51
Figure 18 - Practitioner and novice reviewers' design background...51
Figure 19 - Daily response rate for concept review questionnaires...52
Figure 20 - Response rate for four Amazon surveys of novice reviewers ... 53
Figure 21 - Total duration to complete survey; six concept pairs...54
Figure 22 - Total duration to complete survey; eight concept pairs ... 55
Figure 23 - Durations for six and eight concept pairs; selected area enlarged....55
Figure 24 - Percentage of accepted, rejected, and incomplete reviews...56
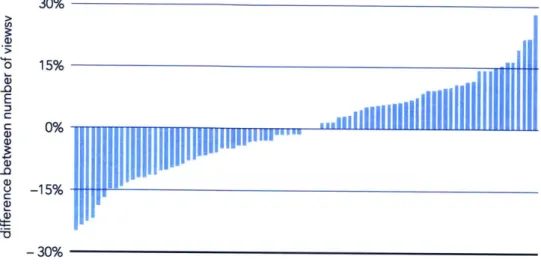
Figure 25 - Frequency of views per concept... 57
Figure 26 - Difference in number of views between top and bottom concepts...58
Figure 27 - Whisker diagram for the number of views a concept received ... 58
Figure 28 - Ranking accuracy exam ple ... 60
Figure 29 - Heterogeneous vs. homogeneous populations...61
Figure 30 - Correlations between m etrics... 62
Figure 32 - Ranking for overall score v. creativity... 64
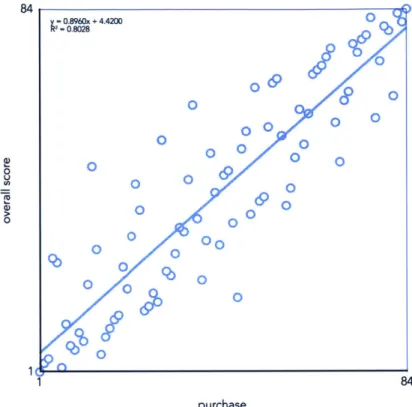
Figure 33 - Ranking for overall score v. likelihood of purchase ... 65
Figure 34 - Ranking for overall score v. aesthetics... 65
Figure 35 - Ranking for overall score v. clarity ... 66
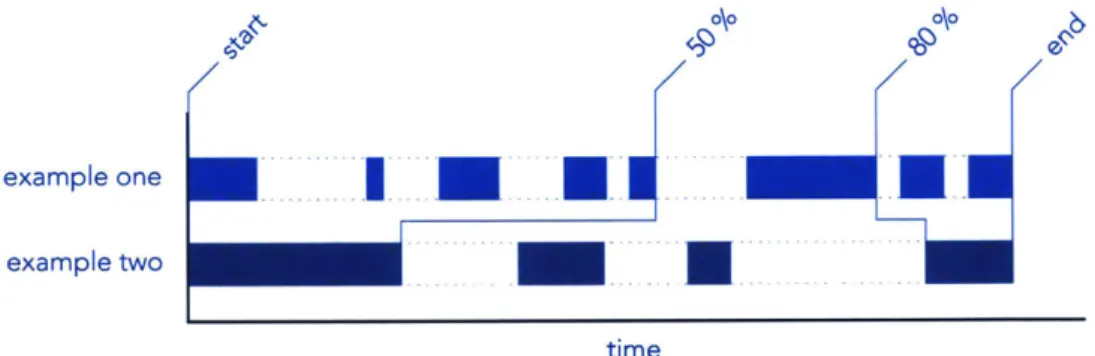
Figure 36 - Two fictitious examples of time-spent working on concepts ... 67
Figure 37 - A segment of the time-use profile for one of the designers ... 69
Figure 38 - One-line representation of the concept time-use profile...69
Figure 39 - Talk-aloud protocol verbalisation categories... 70
Figure 40 - Sample segment of transcribed data...72
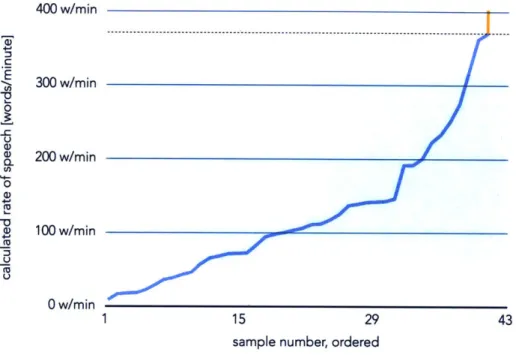
Figure 41 - Speech rate of selected transcription samples - ordered ... 73
Figure 42 - Speech rate of selected transcription samples for selected range .... 74
Figure 43 - Most samples had normal speech rates (light-blue wedge)...75
Figure 44 - Example categorisation of design activities...76
Figure 45 - Speech divided into categories; percentage of time v. designer...78
Figure 46 - Example time intervals and associated errors...79
Figure 47 - Experiment durations - per designer ... 80
Figure 48 - Experim ent durations - per tool ... 81
Figure 49 - Difference between experiment lengths between facilitators. ... 82
Figure 50 - Ten most creative ideas, normalised by the number of designers .... 83
Figure 51 - Ten most creative ideas, normalised by the number of concepts ... 83
Figure 52 - Average number of concepts created per design tool group ... 84
Figure 53 - Number of concepts per designer in part I of the study...84
Figure 54 - Number of ideas versus the highest ranked creative idea...86
Figure 55 - Number of ideas versus the highest ranked overall score...87
Figure 56 - Creativity rank against order of creation ... 88
Figure 57 - Creativity rank as a function of time for selected designers...89
Figure 58 - Creativity ranks for concepts, grouped by designer ... 94
Figure 59 - Normalised cumulative function for a designer - example one...95
Figure 60 - Normalised cumulative function for a designer - example two...96
Figure 61 - Normalised cumulative function for a designer - example three ... 97
Figure 62 - Distribution of ranks base on graph shape ... 97
Figure 63 - Cumulative distribution functions for all designers ... 98
Figure 65 - Per group averages, based on performance in creativity ... 101
Figure 66 - Average cumulative distribution functions for the four groups...102 Figure 67 - Average number of concepts created in each of the four groups ... 103 Figure 68 - Average of the most creative idea created in each of the groups...103 Figure 69 - Differences in the most creative, and average creativity ranks...104
LIST OF EQUATIONS
Equation 1 - Ranking accuracy ... 60
1
INTRODUCTION
1.1 The design process
Unlike many other tasks that people encounter in their work or daily lives, the design process does not have a well-defined 'correct answer' towards which to strive, and some would argue that the problem itself is similarly not well defined (Simon 1973). One example of this understanding in popular culture is the joke below, of which there are several variations:
'How many designers does it take to change a light bulb?' 'Does it have to be a light bulb?'
This illustrates the basic tenet of the design process: there is no correct answer - the first step is finding the-eer-r-eet an appropriate question. The design process is not a search for the absolute truth, but rather an exploration of several different possible solutions to a complex problem. One could say that the solution and the problem develop together (Cross
1999).
Design is the process of finding better solutions to current problems. There exists a diverse set of different design processes, which differ based on their goals, executors and who formulated the process. They are all, however, a sequence of steps (that may loop back to earlier steps) focused on achieving a goal. Some have described the design process as a purposeful activity that includes both complex internal steps (thinking, evaluating and deciding) as well as external steps (writing, drawing and speaking). (R6mer, Leinert, and Sachse 2000)
As mentioned, there are numerous different theoretical models that try to describe the design process, although variations in actual practice make it hard to do so precisely. These are, none-the-less, valuable tools in helping to think about the process of designing, and how one might go about improving it. Some commonly referenced design processes are presented by Ulrich and Eppinger (Ulrich and Eppinger 2003), and Pahl and Beitz (Pahl and Beitz 1996). The 'Compendium of models' by Dubberly (Dubberly
Design outcomes. v si esigners and toois fluence design quality and creativity
2004) also gives a general overview of several different models suggested by design researchers and practitioners.
My personal favourite is perhaps still the one created by Damien Newman
(Newman n.d.), which visually describes the chaotic first exploratory steps of the process, with more clarity emerging as the process moves left to right, towards the final concept at the end.
Figure 1 - The Design Process as Described by Damian Newman
In the context of this thesis 'design process' will refer to solution-focused human-centred design processes, which do not set out to solve a specific problem, but rather have a solution or goal in mind, namely a better future situation. This type of design process is often called 'design thinking'.
According to Meinel and Leifer (Meinel, Leifer, and Plattner 2011), there are four main principles to design thinking, namely:
The human rule - all design activity is ultimately social in nature
The ambiguity rule - design thinkers must preserve ambiguity
The re-design rule - all design is re-design
The tangibility rule - making ideas tangible always facilitates communication
Distinct from analytical thinking, in design thinking one of the early phases
is called 'brainstorming', during which several early ideas are explored with little or no limits on breadth. Little investment in terms of time and effort
has been put into them, reducing the cost of failure and increasing the willingness to make changes. The focus of this thesis is on these initial phases of the design process when an individual designer formulates their mental models into tangible or visual concepts, and therefore the principles proposed by Meinel and Leifer (which pertain more to actions following the formalisation of ideas, or to design teams) will not be discussed in detail. This thesis will focus on the ways that ideas that designers have are formalised, and why that matters.
1.2 The early stages matter
Once initial needs and requirements are formalised, one of the first actions a designer does is to brainstorm and create initial concepts. The early stage concepts are important as they lay the foundation for the design process. Several studies (Asiedu and Gu 1998; Ben-Arieh and Qian 2003;
Dowlatshahi 1992; Duverlie and Castelain 1999; Huthwaite 1988; Schutze, Sachse, and R6mer 2003; Wu 1998) mention that the early phases of the design process influence a majority of the total cost of a product (many mention figures around 70%-80%), although most of these studies only reference a handful of original research conducted - some of it anecdotal -in the automotive -industry -in the 1980's (Corbett and Crookall 1986; Whitney 1988). Some researchers also suggest manufacturing decisions are
of equal importance in many contexts (Ulrich and Pearson 1998).
Regardless of the true number, it seems widely accepted that the early stages of the design process are important for the overall success of a given design, and that although creative problem solving is valuable at any stage of the design process, 'it is of critical importance in the conceptual design stage' (Robertson and Radcliffe 2009). Or as Huthwaite put it, the design of a product has a 'ripple effect' that 'reaches into every company function and moves forward into time', and that 'the penalties imposed by mistakes made during design reach every company employee from order clerk to floor supervisor' (Huthwaite 1988).
In real world situations, designers typically have a deadline to meet with a limited amount of resources at their disposal, and therefore, need to create drawings and models that elicit the maximum amount of useful information for the designer, with the minimum amount of spent time and effort
(Macomber and Yang 2011). Knowing which design processes and tools are most effective to use is important. Ulrich and Pearson also point out that 'design is hard' - different design teams will exhibit differences in design capability and produce quite different outcomes (Ulrich and Pearson 1998). In other words, there is skill involved, and the expertise of the designer matters.
Ulrich and Pearson also found that perceived industrial design quality and reliability quality were not significantly correlated with manufacturing costs. They called this 'design is free' (Ulrich and Pearson 1998), which is to say that with better processes and methods, designers can create products that have a higher aesthetic quality and are more reliable, without incurring additional manufacturing costs.
Although many factors are pre-requisites for a successful design, novel concepts or new creative ways of combining or utilising existing components or solutions are often required. Creativity is therefore an important part of any design process.
1.3 Research questions
As noted earlier, the design process is complex and ambiguous, with no clear answer and results that are difficult to judge. None-the-less, there seems to be wide agreement that in addition to the skills of the designers, the process itself is an integral part of determining the quality of the design outcome. Although products and services are in most cases designed by a design team (which can consist of product designers, engineers, industrial designers, anthropologists, and a number of other professions, that in this case will all be simply referred to as designers in a design team), significant amounts of initial ideation occur individually, after which the results are shared with the design team - although group brainstorming sessions are also common.
However, in order to focus on a manageable number of metrics, and since a lot of research on design teams already exists, the focus of this study is on individual designers working alone in the early conceptual phases of the design process.
With the proliferation of computer tools designers have begun moving to computer-aided modelling (CAD) earlier in the design process, instead of relying on hand sketching further into the design process. CAD poses a unique set of constraints that, it is assumed, negatively affect the quality and breadth of the ideas that are produced due to the constraining nature of current computer tools. Software companies are aware of this issue, and have begun designing tools aimed at the earlier stages of the design process, to facilitate more free-form unconstrained idea generation.
Similarly, making physical prototypes is often cited as an important part of the design process, but little research exists on the effect these different
design tools have on individual designer (although several studies have examined the role different design representations play in facilitating communication and idea exchange between designers in a design team).
In order to study the influence that a select number of design tools (free-hand sketching, foam prototyping, and computer modelling software) have on the concept generation process in individual designers, the following research questions were formulated:
1. Are there significant differences in terms of the creative value of concepts between the chosen design tools?
Does the use of a specific design tool influence the mental processes of a designer to the extent that the concepts produced are of a different creative value? Simply put, are ideas produced by sketching, for example, more 'creative' than concepts produced while using computer modelling software?
2. How does the rate of idea generation differ between the chosen design tools, in terms of quality of design outcomes?
Although it is obvious that concepts created by computer modelling software will take longer to make than concepts created by foam models and hand-sketching, how is this associated with the quality of the design outcomes. In other words, when examining the concept output of designers in terms of quality and time, how do the tools differ?
3. Do the different chosen design tools influence designers to create a certain type of concept, distinct from the other
design tools examined?
Does the tactile feedback of making foam models make the designer more aware of ergonomic issues, thereby influencing them to produce -presumably - more organic shapes? Do designers using computer modelling software create more rectangular designs? Do designers who hand-sketch create more ambiguous concepts?
2 LITERATURE REVIEW
Extensive research exists on the design process and the design tools used. As this study focuses on comparing three common design tools - sketching by hand, foam prototyping and computer modelling - the literature review will focus on how these are used in the design process. Additionally, as crowd sourced data forms the basis for a large part of the study, crowd sourced data collection methods will also be discussed.
2.1 Design tools
Sketching and drawing are some of the oldest forms of visual communication known to man, and precede written language by thousands of years (Tversky 2011). From cave paintings to Picasso, humans draw naturally. Young children will draw if given a medium and canvas to express themselves with, and sketching is initially at least, a very natural form of expression. It is a quick and flexible way to explore design ideas (Cross 2000), although severe societal constraints may be imposed as children grow up ('I can't draw') through self-criticism and censoring. None-the-less, it is assumed that designers assigned to the sketching group will be less constrained in expressing their ideas, leading to larger breadth and variety.
Sketching by hand is an effective technique for early stage design (Eckert et al. 2012), and an integral part of the conceptual phases of the design process. There are several different types of sketching, suited best for different phases of the design process, and serving different purposes. Kudrowitz et al. categorise sketching into three main types: thinking, explanative, and persuasive (Kudrowitz, Te, and Wallace 2012), although other researchers have also proposed alternative categorisations. As these different types of sketching aim to achieve different goals, the type of sketching employed may also have an effect on the results, as will be seen later.
One of the perhaps most obvious functions of sketches are to convey ideas and meaning; 'this is what it will look like' (explanative sketches). Maps convey information about terrain, portraits about physical appearance, and blueprints give instructions on how to build. In the same way concept
sketches externalise thought (Tversky 2011) and convey the idea of what the concept will look like, and possibly how it will function.
Freehand sketching is a common way for designers to express and develop their design concepts (thinking sketches), and some research has found that designers who sketched on paper were better at formulating and analysing the design problem (Bilda and Demirkan 2003; Cross 1999; Jonson 2005; R6mer et al. 2000), more efficient with their time use, and produced more alternative solutions in the conceptual design phase than designers who sketched in digital media (Bilda and Demirkan 2003).
When designers sketch, they have a 'discussion' with the sketch while working through the design problem, and may realize things they would not otherwise have (Visser 2006). The 'roughness' of quick sketches can induce creativity, as the designer re-interprets their own sketches (Tseng and Ball
2011), and the ambiguity allows for the exploration of different design
alternatives (Goel 1995), which is in line with Meinel's and Leifer's second design principle, 'design thinkers must preserve ambiguity' (Meinel et al. 2011).
Sketching can also act as a repository of information, by allowing the designer to unburden themselves of their ideas (by sketching them down on paper) thereby lightening the mental load, and freeing up resources for processing new ideas or thinking of ways to combine existing concepts into new combinations. Sketching down ideas also enables designers to return to them later in the design process (Pan, Kuo, and Strobel 2013).
Some argue that drawing in classrooms may aid the learning experience, enhance engagement and make students understand concepts on a deeper level (Ainsworth, Prain, and Tytler 2011). Unfortunately, students in one study felt they did not have sufficient opportunity to sketch, that their classes did not provide them with sufficient opportunities to improve their skills, and that their teachers were lacking as role models for sketching (Jonson
2005). Some research does suggest, however, that sketching may not
necessarily improve the design outcome for expert designers in all situations (Bilda, Gero, and Purcell 2006).
Building physical models offers an alternative way to formalise ideas, offering tactile information not available in sketching. Foam modelling was chosen as one of the design tools to study, due to the fact that it is easy to
Haqman - Massachusett Insrltute of Technology 2016
work with, does not require special expertise or tools, and offers an avenue to create organic shapes easily - something not all physical prototyping methods are suited for (think for example about Lego). When one hears the word 'prototype', it may trigger different mental images of people in white lab coats and frizzy hair working on a complicated apparatus, pre-production cars shown at car shows, or a prototype aircraft taking off for its maiden flight. However, as this study focuses on the early stages of the design process, prototypes in this context are often significantly less detailed, and focus on a specific question rather than demonstrating system level performance. There is a widely circulated image of an early prototype for a medical device conceived of at IDEO, that demonstrates the level of fidelity that is referred to when talking about prototypes in this study (Kelley and Littman 2005) - on the left, and early prototype of the medical device, on
the right, a computer rendering of the final product (Figure 2).
Figure 2 - IDEO prototype for medical device
Low-fidelity prototypes (Yang 2005) can be quick to fabricate, and reduce uncertainty in the design process (Gerber 2009). The question then arises, how low-fidelity can a prototype be? 'Is a brick a prototype?' The question posed by Houde and Hill elegantly presents the problem of defining what a prototype is. As they point out, the answer to the question depends on how the brick is used. Simulating the scale or weight of an object with the brick would make it a prototype, demonstrating how prototypes are not necessarily self-explanatory. What matters is how the artefact is used to help the designer or designers explore or demonstrate a certain aspect of the concept, not what it is made of, or how it was made (Houde and Hill 1997). Although outside the scope of this thesis, research also suggests the importance of prototypes in design team settings (Edelman et al. 2009; Schrage 1999).
In addition to sketching and prototyping, computer modelling was considered. Since their inception years ago, computer-aided design (CAD) tools have become more and more popular at all stages of the design process. Newly graduating students are more competent and comfortable with computer tools, and as they have developed to become more efficient and intuitive, they have also begun to replace the traditional notepad in the early conceptual phases. (Veisz et al. 2012)
CAD tools have become popular in part due to the fact that they are very
useful for communication and visualization of concept ideas (Robertson and Radcliffe 2009). However, one of the challenges with computer models is that there is a cognitive bias to accepting detailed representations as being superior to abstract representations (Veisz et al. 2012) as they can convey an illusion of being complete, and thereby discourage creative thought in group situations (Robertson and Radcliffe 2009). Some design practitioners also reported using computer modelling as a result of the expectations of clients to see photo-realistic images early on in the design process (Jonson 2005).
Typical problems that may arise while designing with computers include circumscribed thinking, premature fixation and bounded ideation. Circumscribed thinking refers to situations where the design tool limits the designer through interfering with the designer's intent. (Veisz et al. 2012)
Premature fixation refers to situations where the designer becomes devoted to a certain idea prematurely, without exploring a full range of other possible design avenues, because of a high level of detail or complexity of the model they have created (Linsey et al. 2010; Veisz et al. 2012). In a case
study, Robertson and Radcliffe found that designers were wary of incorporating modifications to existing CAD models if it involved making
too many changes to the model or its underlying structure, even if these modifications would solve several problems at once, or reduce overall project risk (Robertson and Radcliffe 2009). Some research also suggests that using CAD tools too early in the design process encourages a focus on detailed design, rather than concept exploration, in other words a depth rather than breadth approach (Fixson and Marion 2012; Ullman, Wood, and Craig 1990).
Bounded ideation, on the other hand, refers to an overuse of a design tool, in this case a computer modelling program (CAD), which reduces the
research suggests that teams that use advanced 3D CAD tools for a larger proportion of the workday create fewer ideas than teams who use less time working with computer modelling programs (Robertson and Radcliffe 2009).
Although a lot of work has gone into developing the functionality of computer tools, they still often limit the solutions available to the designer, and it is possible that CAD tools may never match the imaginative capabilities of designers (Robertson and Radcliffe 2009). Robertson and Radcliffe, however, note an even more serious problem with computer tools in that they may not only limit creativity by what is possible, but also tend to push design decisions towards what is easiest to create with the available tools (Robertson and Radcliffe 2009).
According to Robertson and Radcliffe, there is growing evidence that the over-use of computer modelling tools is influencing the ability of designers to solve engineering problems creatively. There also seems to be a tendency to over-use CAD, even in the conceptual design stage, where other design tools might be more appropriate. (Robertson and Radcliffe 2009)
In order to study the nuanced differences between concept generation using the aforementioned three design tools, it was determined that a large pool of design reviews would be needed to reliably determine any possible differences in outcomes. Online data collection was determined to be the most feasible method of collecting reliable data, which will be discussed next.
2.2 Mechanical Turk as a research tool
Amazon's Mechanical Turk (later simply Mechanical Turk, or M-Turk) is an online crowdsourcing tool that co-ordinates the supply and demand of, usually relatively short and uncomplicated, tasks that require human intelligence to complete. Mechanical Turk is named after an 18th century chess playing 'automaton' that was in fact operated by a concealed person. (Paolacci, Chandler, and Ipeirotis 2010)
Tasks, called HITs (Human Intelligence Tasks), are posted on the Mechanical Turk website, where workers can browse posted HITs and complete them for usually very modest financial rewards (Gosling et al.
2004; Mason and Watts 2010) in a short amount of time (Buhrmester, Kwang, and Gosling 2011; Paolacci et al. 2010). Some research suggests that the compensation amount does not impact data quality, just the rate at which responses are collected (Buhrmester et al. 2011; Mason and Watts 2010).
In their experiments Horton and Chilton found that Mechanical Turk workers had a median reservation wage (the wage at which they will no longer accept the job) of $1.38/hr. (Horton and Chilton 2010). There doesn't seem to be a minimum absolute wage though, as many respondents were willing to complete HIT's for even 1 - assuming the task was short enough (Buhrmester et al. 2011). Although varying from month to month, (Ross et al. 2010) estimated average wages to range from $1.50/hr. to $2.00/hr., with a bit over half reporting working less than 5 hours per week and around 60% of US workers declaring that the Mechanical Turk income had no impact on their financial situation, implying that they were completing the HITs due to some combination of other inducements, such as entertainment, information, the chance to be altruistic or gaining attention from others (Horton and Chilton 2010).
The Mechanical Turk workforce has previously been predominantly from the United States (Ross et al. 2010), but although greater proportions of Indian subjects have become available in recent years (Eriksson and Simpson 2010), it is assumed that the demographics of the US population of M-Turk workers has not changed, and is still representative of the US population as a whole. To avoid cultural and standard of living differences impacting the results, only reviewers residing in the US were chosen to complete the tasks, or HITs, by only accepting IP addresses from the United States.
Research suggests that online subject pools, although not perfect, are diverse, and more representative of the US population as a whole (and less prone to biases) than traditional subject pools recruited through universities (Buhrmester et al. 2011; Gosling et al. 2004; Paolacci et al. 2010).
In addition to a subject pool more representative of the general populace, a major benefit of online surveys is that they allow research to obtain a sample size that far exceeds those obtained with most traditional techniques. Some less obvious benefits also include reduced need for manual data entry (as the
data is gathered electronically) (Gosling et al. 2004) and ease of payment and subject pool collection (Chandler, Mueller, and Paolacci 2014).
Paolacci et al. found that non-response error was the most challenging aspect of collecting data through Mechanical Turk, while at the same time noting that this error was likely higher in traditional web studies. In a study
by Paolacci, subjects recruited through M-Turk were far more likely to
complete the survey than subjects recruited from online discussions forums
(91.6% and 66.7% respectively). (Paolacci et al. 2010)
In all other aspects, apart from multiple response errors, (Paolacci et al. 2010) found that M-Turk data was less susceptible to errors ranging from heterogeneity of samples to experimenter effects and dishonest answers, than was data collected in laboratory settings and was overall a reliable source of experimental data in judgement and decision making. M-Turk data quality also met or exceeded the psychometric standards associated with published research (Buhrmester et al. 2011).
Mechanical Turk was chosen due to the benefits associated with collecting data through Amazon Mechanical Turk, the most important of which was the fact that large populations representative of the general US populace could be reached quickly and inexpensively.
3 METHODOLOGY
Design is a highly complex, constantly changing process, affected by a multitude of inputs that are hard to describe, many of which are unknown. As such, it is clear that all facets of the process cannot be studied at once. The focus of the research was on early stage concept generation, and hence the methods were chosen to emulate - as far as possible - an actual early stage design experience, so that insights could be gained that could then be used to improve design practice.
3.1 Introduction
Some of the key features that were identified as important in re-creating a design scenario that was as realistic as possible, were motivation to complete the task in a serious manner, and a sufficiently long
observation period. To address the first point, careful consideration was
given to specific ways of motivating the participants. Without any external pressures to perform, it was feared that participants might take the experiment as an opportunity to have careless fun, and create 'wilder' ideas than they typically would in a work environment.
As the participants were anonymous, peer recognition could also not be utilised as motivation, although several of the participants were curious and wanted to know 'how they had performed' compared to other designers who had taken part in the study. In the end, a monetary incentive and an (anonymous) competition were devised to provide an appropriate level of motivation and pressure on the participants. The design experiments were conducted in two phases, and data was collected through controlled experiments and surveys, in two sections labelled part I and part II, as seen in Figure 3.
NOV JAN JAN JAN JAN
2011 2013 2014 2015 2016
Participants in both parts were informed that there would be roughly thirty designers that they would be competing against, and that the designer who created the 'best' design - as judged by an independent panel of judges -would be awarded an additional $75 in addition to the $50 that was already given to everyone as a token compensation for their time.
There were twenty-one participants in part I, and six in part II. Additionally, some participants in part I were disqualified due to the fact that they did not produce any concepts for products (instead producing new service and business models), further improving the odds in favour of the participants. Although, it seemed that for many of the designers, winning the competition was more motivating than the additional cash prize.
One issue that design experiments face is the disconnect between studies performed in the lab, which typically range from a few minutes to an hour, and real working environments, where designers may be working on the early conceptual stages of the design process for days. Further complicating the issue is the fact that designers may be thinking of the challenges and problems even while not at work.
Reconciling the challenges of recording reliable data on participants not tightly monitored in a controlled experiment environment (but providing data over a longer period of time) with data collected during a shorter duration task in a tightly controlled environment (providing better quality data, although in a less realistic environment) it was decided that in order to control as many variables as possible the experiment data would be collected in a laboratory environment, but that the length of the experiment would be pushed as far as reasonably possible.
Based on previous experience and initial probes sent via e-mail to design firms and design students, it was assumed that the sample size of suitable designers for the study would be relatively limited. The number of dependent variables was kept small, in order to be able to make meaningful insights into the design process with the (assumed) relatively small sample size. Factors that were predicted to influence the design process, but which could not be studied with the current sample size were identified and their impact minimised as far as possible, some examples of which are given
- - -- - - --- =~-~--~-~ - -T~~*~*
-For instance, length of work experience, design background (architect, industrial designer, product designer, mechanical engineer) and age were factors that were not examined - due to the scope of the study, it was not possible to make meaningful comparisons. Therefore, background factors that could not be studied were mitigated by distributing designers into one of the three groups in an even fashion, to minimise their impact on the data.
One of the distinguishing features of this research compared to many others is the use of, mainly, design professionals as research subjects, and the longer than usual observation period. Although teamwork is an essential part of many well functioning design teams, significant amounts of ideation and early concept development also happens in single-person settings (alone). Therefore, since research directly comparing different design tools is limited, and due to the fact that design teams have been more readily studied, only individual designers working alone were observed. This was done in order to decouple the substantial effects that team dynamics have on the design process; the design process in team settings was left outside the scope of this study.
3.2 Controlled design experiments
The following section describes controlled design experiments that were conducted on professional designers that were individually engaged with a design task; using either sketching, foam prototyping or computer modelling. In both parts I and II, the designers were interviewed, the artefacts they created were collected, and audio- and video recordings were made. Additionally, further data was collected through online surveys for artefacts created in part I, as shown in Table 1.
Table 1 - Type of data collected during parts I and 11
on-line design
video audio interviews surveys artefacts
0 data used
part I
part il
data collected, but not used data not collected
The experimental set-up and design brief remained nearly identical in both parts to allow for direct comparisons between experiments, with the
exception of a few minor differences, described next.
During the experiments in part I the designers were allowed to design freely, whereas in part II, the designers were asked to verbalise their thoughts continuously throughout the experiment. As both experiments were nearly identical, unless otherwise explicitly specified, the methods described apply for both parts. In cases where the experimental conditions differ, specific mention will be made whether the condition applies to part I or part II.
In addition to the two time periods during which the design experiment was run, additional data was also collected through an online survey based on artefacts from part I. The methodology for the online survey is described later in section 3.3.2 on page 31. The design experiment itself is described next.
3.2.1 Experimental set-up for part I
The design experiment was devised to study the impact of three different design tools on the design process and design outcomes. To that end, participants were divided into three groups - sketching, foam prototyping, and computer modelling. Due to the expectation that qualified participants for the study would be hard to find, the number of design tools being studied was limited to three, so as not to spread the participants too thin over several design tool categories.
Sketching, being an essential tool in any ideation process, was chosen as one of the tools to be studied. Due to the proliferation of computer tools in the last couple of decades computer-aided design tools have become ubiquitous in the design field - even for very small companies or individual consultants. The main challenge with studying CAD tools, however, is that there are a large number of different variations with different fields favouring different programs. Some common examples include programs made by Dassault
Systemes, Autodesk, Siemens PLM Software, PTC and the Blender Foundation.'
Based on a few sample contacts within the pool of possible candidates for the study, it was found that SolidWorks (by Dassault Systemes) was a widely used tool amongst the pool of designers who were candidates to take part in the experiment. To remove bias caused by the use of different CAD programs, all participants in the CAD group used SolidWorks. Furthermore, only subjects who were familiar and comfortable with SolidWorks were recruited to take part in the computer-aided design tool group.
It was hypothesized that the tactile aspect of building physical models may have an impact on the thought processes of designers, and therefore a third design tool that offered tactile feedback to the designer was sought. Several different alternatives from foam core and Lego to clay were considered, but ultimately polystyrene foam, referred to simply as 'blue foam' or 'foam' in this study, was chosen based on its relatively widespread use in the early stages of the design process and suitability for making quick mock-ups in both geometric and organic shapes, with fewer restrictions on the shape than some of the other quick, physical mock-up materials.
Clay was also considered as an alternative, but due to it being less commonly used it was assumed that it would be easier to find designers who were comfortable working with blue foam than ones who were used to working with clay (which was corroborated by early inquiries with people who were considered possible participants in the study).
Designers in the sketching group were provided with a variety of pencils, markers, ruler, eraser and pencil sharpener. Designers in the foam prototyping group were given a variety of rasps and grits of sandpaper, a metal ruler, toothpicks and a variety of glues to join foam pieces, a hot wire cutter, and a marker for drawing out cutting lines. Brainstorming or sketching out ideas with the marker was expressly prohibited. Participants in the computer modelling group were provided with a workstation and copy of SolidWorks. For a more detailed discussion on the specific equipment used in the study, see (Higgman et al. 2015).
1 See www.3ds.com, www.autodesk.com, www.plm.automation.siemens.com/en-us,
Design outcomes: how designers and tools influence design quality and creativ ty
Participants were provided with a working table, quiet location to work in, water and design tools according to the group they were assigned to. For participants in part I of the study, two cameras were positioned to record the design experiments, as seen in Figure 4. One camera was angled top-down to give a view of the working surface (labelled A), and the other (wider angle) camera, was positioned to capture the working table and hands of the participant from a lower angle (labelled B).
- =
" I
Figure 4 - Experimental setup for part I
The working area for the sketching and prototyping groups was roughly 80cm x 90cm or larger, but varied slightly based on experiment location. Participants in the computer modelling group were provided a conventional computer workstation - as they were prohibited from sketching they did not need table space in the same fashion that participants in the sketching or prototyping groups.
Participants worked alone in a quiet room with few distractions. They also did not know who the other participants of the study were (the experiments were not run consecutively), and more importantly, were not recruited from
companies, lived in different parts of the city, and had few friends in common) - therefore one can safely assume, that the designers had not heard details regarding the experiment beforehand.
3.2.2 Experimental set-up for part I
The experimental set-up for part II was largely the same as in part I. However, due to the implementation of a talk-aloud protocol, there were some minor additions. The main differences were the addition of a high-quality microphone (to ensure the audio high-quality was good), and the placement of a permanent experiment facilitator who sat in the room with the participant for the duration of the experiment. The main task of the observer was to monitor the test subject, and make sure they kept verbalizing their thoughts, by gently reminding the participants to 'please, continue speaking' whenever they fell silent. If the test subject was silent for roughly 5-10 seconds, they would be reminded to speak, although depending on the frequency of previous reminders and what they were doing, the time after which a reminder to speak would be expressed could be increased slightly, to avoid having to repeatedly remind the test subject and thereby annoying them and possibly influencing the data by affecting their mood.
As it was foreseen that having an experiment moderator sitting in the experiment area observing the participants might make some participants self-conscious or uncomfortable, a few abbreviated trial studies were conducted to test the effects of moderator placement. These trial studies lasted roughly half an hour. The data collected during these sessions was not used in the actual experiment, as the session durations were incompatibly short, and the experiment moderator moved around trying different seating arrangements, undoubtedly affecting the concentration of the participants.
The participants knew that the experiment was a trial study and that they would be abbreviated in length, but were not made aware of what specifically was being tested. The trial experiments were abbreviated to roughly one design session, instead of the three sessions in the actual experiment. After the design session the participants were asked if they had noticed the different seating arrangements that the experiment moderator had sat in, and if so, how the different seating arrangements had affected them.
Design outcomes. how designers and tools influence design quality and creativity
In addition to the general discomfort that most participants felt due to the awkwardness of verbalising their stream of consciousness and talking in incomplete sentences, there were three specific findings as well. The three main qualitative findings from these abbreviated trial studies dealt with: a. the positioning of the experiment moderator, b. the facial expressions of the moderator, and c. the importance of reminding the participants to speak. Although some subjects did not seem to care about the positioning of the moderator, some participants had surprisingly strong emotional reactions and expressed anxiety and pressure caused by the placement of the moderator when in their field of view. Three different seating arrangements were tested with each trial participant. Based on verbal feedback, a position behind the test subject, out of the field of view of the participants (labelled
'C'), was chosen as the least obtrusive, as depicted in Figure 5.
video ca mer~ microphone
A //\