Publisher’s version / Version de l'éditeur:
Vous avez des questions? Nous pouvons vous aider. Pour communiquer directement avec un auteur, consultez la première page de la revue dans laquelle son article a été publié afin de trouver ses coordonnées. Si vous n’arrivez pas à les repérer, communiquez avec nous à [email protected].
Questions? Contact the NRC Publications Archive team at
[email protected]. If you wish to email the authors directly, please see the first page of the publication for their contact information.
https://publications-cnrc.canada.ca/fra/droits
L’accès à ce site Web et l’utilisation de son contenu sont assujettis aux conditions présentées dans le site LISEZ CES CONDITIONS ATTENTIVEMENT AVANT D’UTILISER CE SITE WEB.
Internal Report (National Research Council of Canada. Division of Building
Research), 1970-08-01
READ THESE TERMS AND CONDITIONS CAREFULLY BEFORE USING THIS WEBSITE.
https://nrc-publications.canada.ca/eng/copyright
NRC Publications Archive Record / Notice des Archives des publications du CNRC :
https://nrc-publications.canada.ca/eng/view/object/?id=18b1ac35-7db6-440d-9a17-61cda7cfb54c https://publications-cnrc.canada.ca/fra/voir/objet/?id=18b1ac35-7db6-440d-9a17-61cda7cfb54c
Archives des publications du CNRC
For the publisher’s version, please access the DOI link below./ Pour consulter la version de l’éditeur, utilisez le lien DOI ci-dessous.
https://doi.org/10.4224/20386759
Access and use of this website and the material on it are subject to the Terms and Conditions set forth at
Condensation in flat roofs
NATIONAL RESEARCH COUNCIL OF CANADA DIVISION OF BUILDING RESEARCH
CONDENSATION IN FLAT ROOFS by
G. H. Kuester
Internal Report No. 377 of the
Division of Building Research
Ottawa August 1970
The problem of condensation in frame roofs is well recognized in Canada and construction practices have developed to minimize the
resultant difficulties in most systems. The problems with respect
to flat wood-frame roofs have not yet been adequately solved even when the traditional remedial measures have been applied.
The design features and practices presently accepted have
involved qualitative judgements based on idealized steady state concepts
of water-vapour flow without adequate aas e s s rn e nt of the actual conditions.
The study described in this report was intended to facilitate observations of the nature of condensation problems in a numbe r of simulated flat roof systems under actual weather conditions.
This progress report covers the first winter of observations of a two-year program intended to develop an understanding of the problem and appropriate design recommendations.
Ottawa August 1970
N. B. Hutcheon Director
T ABLE OF CONTENTS
INTRODUCTION AND PURPOSE THE BUILDING
Description of Test Building Inside Environment
General
ARRANGEMENT OF TEST SPACES OBSER VA TIONS
General
Space to Space Account SUMMARY
Summary Ventilation
Degree of Condensation in Respect to Size of Orifice Outside Temperature and Roof Space Temperature Inside Humidity
Quantity of Frost Wind
Sun
Snow and Ice Cover on Roof FIGURES 1 1 4 6 12 21
by
G. H. Kuester
Condensation in attics and flat roofs of residential dwe l l ing s
in Canada is a problern which. be side1:1 being a nu i s a nc e , can and doe s
cause damage to ceiling and wall structure. Each individual factor
involved in the formation of condensation is known and Can be cal-culated. but it is very difficult to predict when and how these factors. which together cause condensation. will combine.
The purpose of the test was strictly to observe condensation in
flat roofs; it does not purport to draw any conclusions. Visual and
instrumental observations were made; the kind and type of instrumenta-tion was determined during the course of the test. thereby eliminating
unnecessary wiring at the beginning of the test. As far as was possible.
the visual observations were taken by the same person so that misinter-pretation of the degree of condensation found inside the joist space s
would be eliminated. A rating system was e atahli ahe d in the following
way:
Damp - an even darkening of the plywood deck.
Wet - reflecting surface water and water dripping off nails.
Traces of Frost - light frost occurs in patches.
Light Frost - light frost cove ring entire surface. but surface still visible.
Heavy Frost.- white frost covering entire surface. Very Heavy Frost - degree of frost in thickness.
The study was discontinued on March 28. 1969. exactly ten weeks after the study began.
THE BUILDING DESCRIPTION OF TEST BUILDING
A 20 ft by 20 ft wood frame building, with an 8-ft high ceiling.
2
-on c-oncrete - block foundati-on po st s , with an unde r -floor clearance
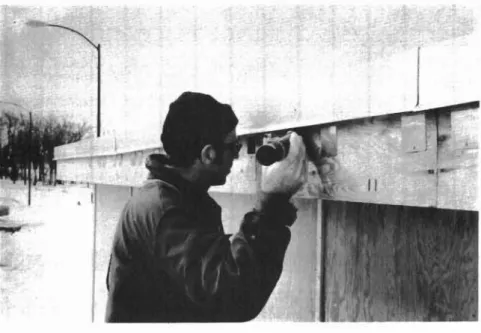
of approximately 1 ft. The completed building is shown in Fig. 1.
Floor construction:
2 by 8 in. joists at 16 in. on centre masonite sheets on underside of joists
3-in. fibreglass insulation between joists 3/4 in. plywood subfloor
6 mil polyethylene sheet lapped 18 in. and taped at joints masonite floor finish.
Wall Construction:
1/2 in. exterior plywood sheathing, not painted
2· by 4-jn , studs at 2 ft 0 in. on centre
2-in. friction-type fibreglass insulation
6 mil polyethylene sheet taped at joints and held tightly against studs with wood battens.
Roof Construction:
Asphalt and gravel roof 3/4-in plywood
2- by 8-in. joists at 16 in. on centre
Insulation and polyethylene vapour barrier were installed individually to suit test requirements (see "Arrangement of Test Spaces").
The joists were arranged in north-south direction, to face into
the prevailing wind. A l2-in. roof overhang was provided to allow for
soffit ventilation where it was required by the test. Before the plywood
roof deck was installed, a continuous caulking bead was applied to the top of all joists in order to minimize air leakage between joist spaces. When the test required a ceiling vapour barrier, a 6-mil thick poly-ethylene sheet was used, which was well stapled and taped, and held
tightly against the bottom of the joists by wood battens. The vapour
barrier was left exposed to the room so that water dripping through the insulation could be observed.
Two observation holes at both the north and south end, each approximately 2 in. by 2 in., were cut into the fascia board of joist spaces 4 to 12 and were covered with movable aluminum plates as
shown in Fig. 2. An exterior platform was built for easier
THE INSIDE ENVIRONMENT
The test building was built with no windows and with a reason-ably tight fitting access door in order to minimize uncontrolled air
leakage. Air was allowed to enter the building from the vented crawl
space through two 4 - by 12 -In , holes in the centre of the floor as shown
in Figure 1(b). This arrangement was de signed to lower the neutral
pressure plane and provide a pressure difference due to stack action across the ceiling of 0.01 in. W. G. at an inside to outside temperature difference of 100°F.
Orifice plates. as shown in Figure 3. were installed to permit
different rates of air flow into specific joist spaces. Plates having
sixteen. eight. and two 1 -In , -diameter holes were used to simulate
high, medium and low leakage conditions. With the test arrangement.
a pressure difference of 0.01 in. W.G. across the ceiling could provide potential leakage rates of 8. 4 and 1 cfrn per joist space for the three orifice arrangements.
The relative humidity was maintained at between 30 and 40 per cent by vaporizing approximately 4 gal of water per 24 hr in an ordinary
household humidifier. The water was heated to achieve this RH level.
The temperature in the building was maintained at between 70° and 72°F.
GENERAL
The building was first in operation on January 13. 1969. The
first observations were recorded for the week starting January 20. The readings and observations were taken each morning at 8: 30 during the 5-day working week, and were recorded and compiled on a weekly
basis. No readings and observations were taken during the week-ends.
Daily average outside temperatures were obtained from the
records taken at DBR (9:00 a. rn , and 4:00 p, m.). Wind direction
and speed were also taken from the records at DBR and averaged on a
daily basis. At the end of every recording week. the prevailing
direction and average speed of the wind were established and related to the location of the building on the site.
Snow and ice on the roof and the total number of sunshine hours per day were recorded daily.
4
-ARRANGEMENT OF TEST SPACES
The building was divided into fifteen joist spaces as shown in
Fig. 4. It should be mentioned that although every effort was made
to seal off each joist space from its neighbouring space, some air leakage between the spaces did take place.
A percentage system was chosen to record the observed degree
of condensation in the joist spaces. The building was divided into north
and south halves at the centre roof beam, which was 10 ft from either
end of the exterior wall and well inside the observable distance. The
10-ft halves were divided into I-ft sections, each representing 10 per
cent of the total. Thus if condensation occurred through 3 ft, it would
be said that there was 30 per cent condensation, and if through 10 ft,
there was 100 per cent condensation.
Starting at the west end of the building with Space No.1, and terminating at the east end with Space No. 15, the spaces were arranged as follows:
Space 1:
Space completely filled with fibreglas s insulation with paper removed
polyethylene vapour barrier no air-leakage
no soffit ventilation Space 2:
3-in. thick fibreglass insulation with paper pushed against under side of roof deck
loosely stapled against sides of joists (every 12 in , ]
glued to roof board in the centre to prevent sagging no polyethylene vapour barrier
no soffit ventilation. Space 3:
3 -Ln , thick fibreglas s insulation with paper pushed against under side of roof deck
well stapled against sides of joists (every
6
in. )glued to roof board in centre to prevent sagging
no polyethylene vapour barrier no soffit ventilation.
Space 4:
3-in. thick fibreglass insulation with paper r ern ove d
conventionally installed (flush with bottom of joist) polyethylene vapour barrier
no air-leakage
1 in. by 14 in. continuous soffit vent (1/300 of ceiling area NBC Standard).
Space 5:
3-in. thick fibreglass insulation with paper removed conventionally installed (flush with bottom of joist) polyethylene vapour barrier
no air -leakage
l-dn , by l4-in. continuous soffit vent (1/300 of ceiling area
NBC Standard). Space 6:
3-in. thick fibreglass insulation with paper removed conventionally installed
polyethylene vapour barrier medium air-leakage (8 holes)
I-in. by 14-in. continuous soffit vent. Space 7:
3-in. thick fibreglass insulation with pape r removed conventionally installed
polyethylene vapour barrier high air -Le akage (l6 hole s)
l-dn , by 14·in. continuous soffit vent.
Space 8:
3-in thick fibreglass insulation with paper removed conventionally installed
polyethylene vapour barrier no air -leakage
6
-Space 9:
1-ill. thick f'i b r e g Ia s s inxul ntion with pn pe r r e niovorl
conventionally installed polyethylene vapour barrier high air-leakage (16 holes) no soffit ventilation
Spaces la, 11 and 12:
3-in. thick fibreglass insulation with paper removed conventionally installed
polyethylene vapour barrier high air-leakage (16 holes)
I-in. by 14-In, continuous soffit vent
Space l Z was reduced to low air-leakage (Z holes) on February la, 1969. Space 13:
3 -j.n , thick fibreglas s insulation with paper pushed against the bottom of roof deck
stapled every 6 in. to the side s of the joists taped to the joists
no polyethylene vapour barrier no soffit vent.
Space 14:
Same as No. 13, except a l/Z-j.n, thick gypsum -board ceiling
was added. Space 15:
Space com.pletely filled with fibreglass insulation with paper removed
polyethylene vapour barrier high air-leakage (16 holes) no soffit ventilation.
OBSER VATIONS GENERAL
Observations were begun during the week of January 6, hut
range and the relative humidity in side the tcat buiIding was 30 pc r cent.
Condcus.rtfon , although anticipated, did /10! OCCIIr ,
Corrdcn s ation first occurred on Janua.ry I () 0/1 the n or-th Hide
(prevailing wind side). During the first recorded week, Htarting Jn nu a ry
20, it became obvious that all spaces, with the exception of Space 5 (no
air leakage, vented), started to have some degree of condensation, and
the unventilated spaces 8 and
9,
had accumulated a fair amount of frostby this time. It appeared that these two spaces had a lower temperature
than the ventilated spaces; this was later proved correct during the test period when thermometers were installed inside some roof spaces.
The under side of the roof deck at the centre of the building appeared to have less condensation above the orifices than near the exterior walls.
On January 24 (Friday) the humidification was purposely
dis-continued. The relative humidity dropped rapidly, and by Monday,
January 27, a very cold morning (-1. 8°F, N. W. wind at 8mph), no condensation at all was observed, except in Spaces 8 and 9 (unventilated)
where there continued to be 100 per cent of frost. The humidity was
quickly raised to 35 or 40 per cent, and condensation occurred within a few hours, with very heavy frost in all spaces (except Space 5): on the north side 100 per cent, and on the south side 80 per cent wet with 20 pe r cent of light to heavy frost near the exte rior wall.
The first water puddles on top of the vapour barrier appeared
on January 30 (outside temperature 25. 3°F) in Space
9
south, and in10 and 11 north. At some time during the test period, all spaces that
had a polyethylene vapour barrier, with the exception of 4 and 5, showed water puddles similar to those evident in Fig. 5.
Some days, when the wind speed was above 10 mph, the
pressure inside the building and in the space above the insulation (referred to as roof space) caused a pumping action on the ceiling vapour barrie r membrane which in some spaces (particularly in Space 4) was strong enough to move the insulation upward into the spaces.
The first fogging was observed at the north end of Space 7 on
February 6, a sunny day with a temperature of 5.20
F, and a
south-west wind of 5 mph. No snow was on the roof, but there was a 1/4-in.
ice cover. The fog seemed to circulate between the insulation and
H
-On Friday, February 7, the air intake area. wa s inc r e a s ed by 100 per cent by raising the board above the air-intake opening at floor
level. No condensation could be found on the following Monday except
in Spaces 8 and 9.
On February 10, 1969, the number of holes in Space 12 was
reduced to 2 (low leakage) for the remainder of the winter. Subsequently,
it appeared that mild outside temperatures kept this space dry, whereas cold temperatures in the below 20°F range aggravated the frost accu-mulation to a higher degree than ever.
A smoke test was undertaken in Space 10 on February 12, an
almost windless day (N. E. 5 mph). A smoke stick was deposited into
one of the I-in. diameter holes. Within 30 sec, smoke appeared at
both north- and south-soffit vent openings. A second smoke test was
taken on February 13 (N. W. wind 17 mph). Spaces 7 and 12 were
chosen; Space 7 to study the influence of pressure differences and wind, and Space 12 to study wind action only (by taping all openings after the
smoke stick had been deposited). In both spaces no smoke was visible
inside the spaces or outside the vent areas. Some smoke was forced
into the building, indicating that, at times, the pressure in the spaces was positive.
It can be assumed either that: (a) higher wind speed resulted
in dilution of the smoke in such a way that actual smoke was invisible
to the naked eye, or (b) higher pressure inside the roof space kept
the smoke inside the insulation.
On February 20, a fungus growth was observed in Space 12
south, near the exterior wall. Throughout the remainder of the test
period this fungus continued to be observed when there was a "wet"
degree of condensation. Later observations, however, indicated that
the fungus had existed in the plywood sheet before installation. Roof temperature readings were begun in roof Space 10 on
February 24, and later in Spaces 4 and 9 also. The vapour barrier
was removed from Space 4, leaving the insulation exposed to the
inside. On February 28, one section of the insulation in Space 2 north
was removed for inspection of condensation on the plywood. The
ply-wood had been wet and/or covered with frost at times. At no time
during the test period was it observed that Spaces 2 and 3 were dry. SPACE TO SPACE ACCOUNT
The insulation, ceiling and vapour barrier in Spaces I, 2, 3,
checked for moisture content; it was found that there was a higher moisture content above or near the joint of the insulation batt s ,
Space 1 On February 3 a small (2-in.) diameter puddle was observed
on the polyethylene vapour barrier on the south side, but it disappeared
a few days later for the remainder of the winter. The roof-board
moisture readings ranged from 19 to 65 per cent on the south side, and from 20 to 72 per cent on the north side.
Lower moisture readings were found near an area where unintentional ventilation with outside air, caused by the shrinkage of the structural members, had occurred.
Space 2 Investigations taken at regular intervals showed that condensation
occurred to varying degrees, but did not show up as water or stains on
the under side of the insulation paper. When the insulation was removed
at the end of the test, on March 27, drops of water were hanging from the centre of the roof boards, where a coat of glue, applied to keep the
insulation from sagging, formed an unintended, relatively impermeable,
additional vapour-barrier. Moisture readings of the roof board under
this layer of glue were in the 20 per cent range, while the exposed wood had a moisture reading of up to 65 per cent.
A fungus growth occurred on the plywood roof board on the south
side, extending inward from the exterior wall approximately 18 in. It is
not known, however, whether the fungus developed during the test period or had attacked the plywood prior to its installation.
Space 3 The same results were obtained in Space 3 as in Space 2.
The same sheathing board covered both Spaces 2 and 3, and the same
fungus was again seen in the first 18 in. from the exterior wall on the
south side.
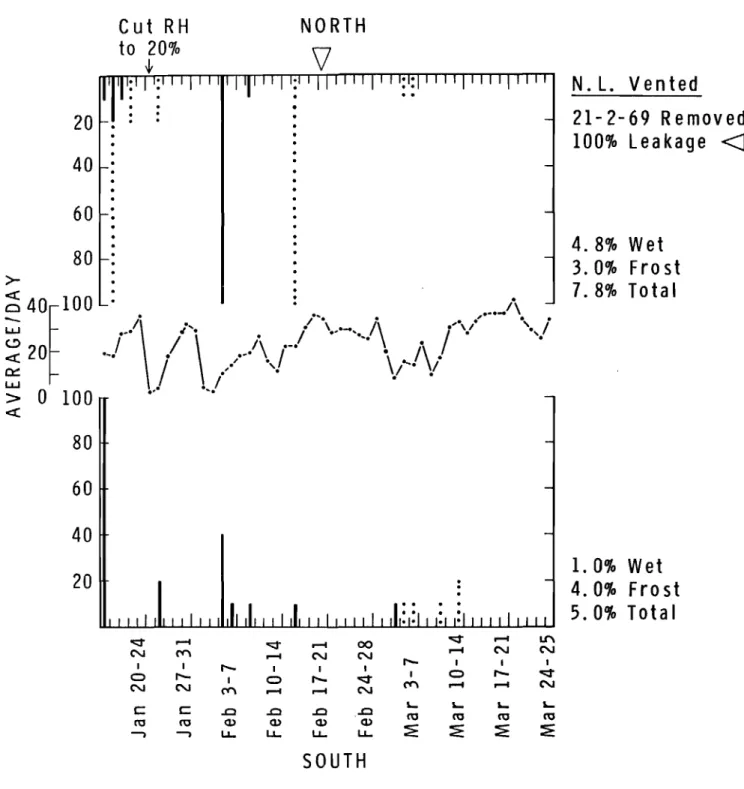
Space 4 (No leakage, but vented; total condensation, north 7.8 per
cent, south 5.0 per centJ Although this space was designed to prevent
any air-leakage, some condensation did occur. Cross leakage between
spaces was assumed to be a major source of the small amount of water
vapour deposited in this space. Migration, however, could have taken
place from the west side only (Spaces I, 2 and 3) as there was no
condensation in Space 5. Another factor is possibly the deposit of
frost on hoar-frost days: Fig. 6, which shows the percentage of frost in Space 4, indicates that frost occurs in the first 1 or 2 ft of the joist space from the exterior walls.
10
-When the vapour barrier below the insulation was removed on February 21, condensation did not take place for the rernainde r of the
test period (i. e , , until March 28), although 6 d avs in the liel ow 20°F
tern.pe r a.tu r e range were recorded, as c orn pa r e d with 13 d av s be I ow
20°F between January 20 and February 21. Frost, observed in the
first 12 in. fr orn the exterior wall after February 21 was a s surn ed to
be hoar frost.
Two sets of ternpe r atur e readings were taken for the outside and
for the centre of the free roof-space area. The first set, taken between
March 5 and 14, gave an average outside terripe r atu r e of 18. 50 F, and an
average roof space t.ernpe r atu r e of 41. 7°F. The second set, taken
between March 17 and 28, averaged an outside temperature of 33. 2°F
and an average roof space ternpe r atu r e of 52. 8°F. Thus Space 4 was
an average of 20°F or 23°F above the outside temperature for these
two tirn e periods.
On March 11 at 8:30 a. m , , the temperature at the inside face of the insulation was 75°F, at the roof-space face of the insulation it
was 42°F, and inside the roof space it was 10°F. At this particular
tirn e the outside terripe r atur e was 8. 3°F with partly sunny skies.
On particularly cold rn o r-nirig s (such as March 5 when it was 3.0 OF) frost was found on top of the insulation, but it disappeared rapidly during the next 2 to 3 h r s ,
Space 5 (No leakage, but vented.) The only day condensation
developed in this space was March 6; on this day there was a light
frost, covering 100 per cent of the south half. The average outside
temperature was 18°Fj the previous day it had been 10°F and sunny,
with a 5 rn ph westerly wind. The condensation had disappeared
corriple te ly by March 7.
Space 6 (MediuIn leakage, ve nt ed ; total condensation: north 24
per cent, south 31.8 per cent.) As shown in Fig. 7, the percentage
of frost is higher than the percentage of wetne ss at both north and
south ends. This is significant when compared with "high leakage"
spaces where the opposite results were recorded, I,e , , higher
percentage in wetness than in frost.
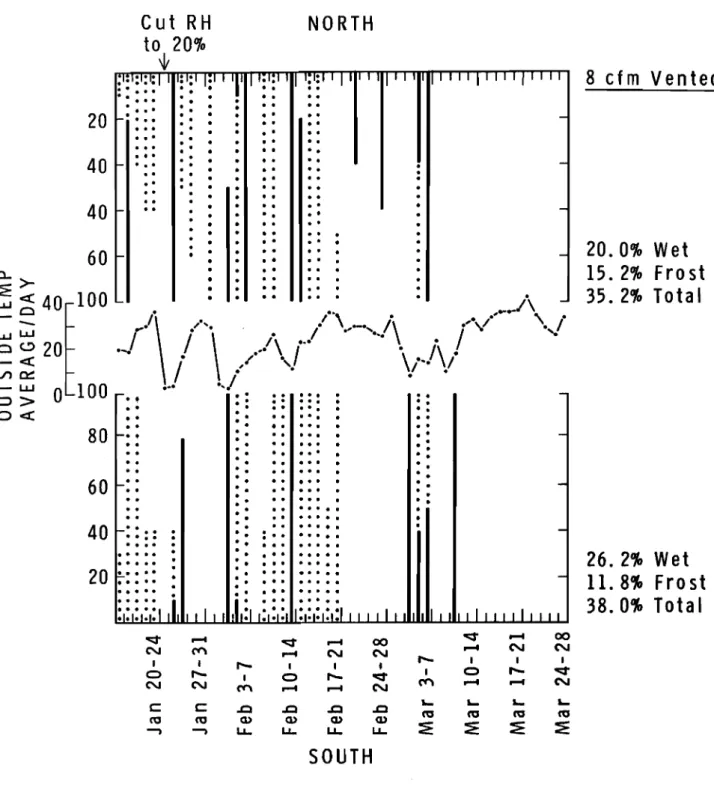
Space 7 (High leakage, verite d; total condensation: north 35.2
per cent, south 38.0 per cent. See Fig. 8.) Nothing unusual was
observed. It is difficult, however, to explain why this space had
a smaller total percentage of condensation than did either Space 10
visual observation of frost may not indicate actual quantity of water involved.
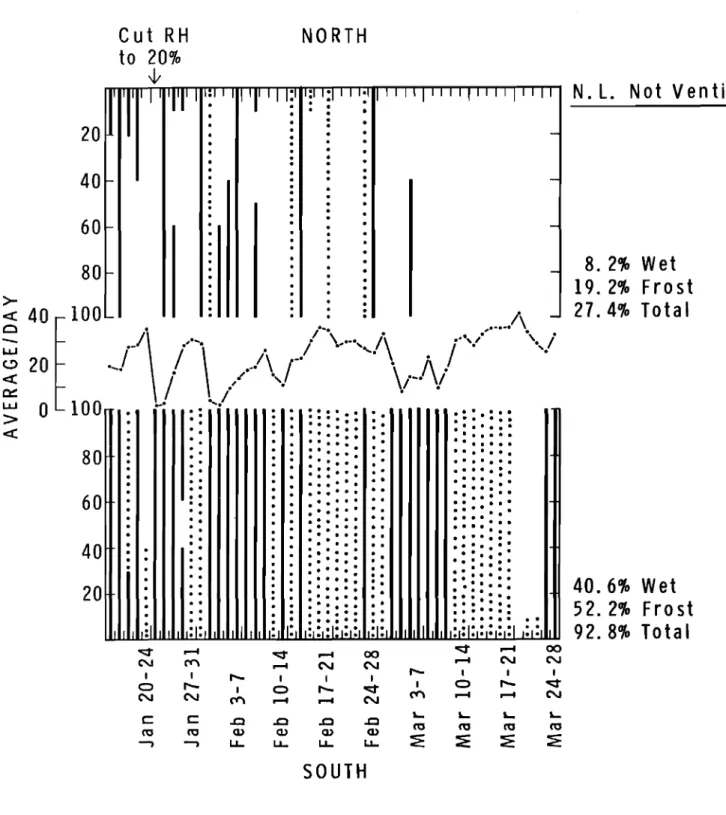
Space 8 (No leakage, not verrte d ; total condensation: north 27.4 per
cent, south 92.8 per cent. See Fig. 9.) Even if one allows for some
cross-joist space leakage, the heavy condensation in this space must
be attributed to some factor other than leakage alone. Vapour diffusion,
if taking place in an unventilated space, might be an underestimated potential.
Space 9 (High leakage, not vented; total condensation: north 86.2 pe r
cent, south 99.0 per cent. See Fig. 10.} The heavy condensation in
this space is probably not surprising. Temperature readings indicated
that terrrpe r atu r e s in this space were a pp r oxirn a te ly 10 to 14°F higher
than outside. From March 5 to 14, the average outside temperature
was 18. 5° F, and the average roof -space temperature was 32.4 ° F. Between March 17 and 28, the average outside temperature was 33.2°F
and the average roof-space temperature was 43°F. Indications are that
in the early part of the test period, roof temperatures were possibly substantially lower, approaching the outside temperature mark.
This space had the most and the largest water puddles on top
of the vapour barrier. The puddles never completely disappeared
but they did not increase in number or size after their initial occurrence at the beginning of Fe bruary.
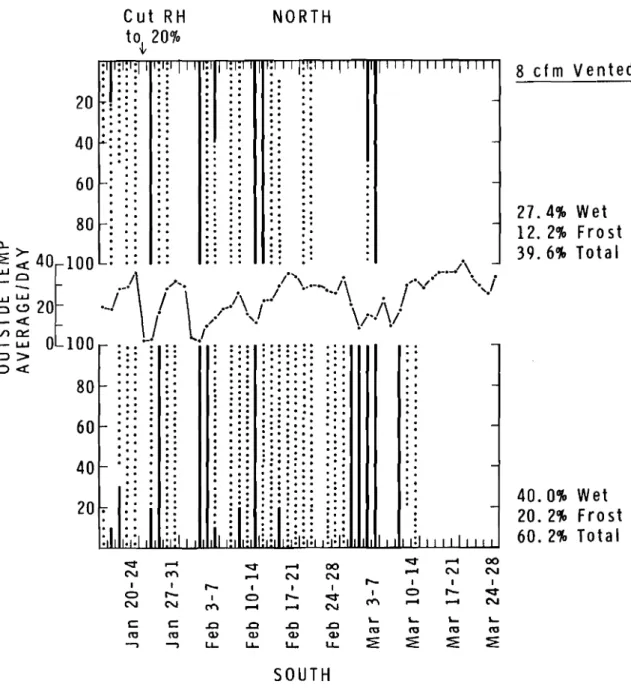
Space 10 (High leakage, vented; total condensation: north 39.6 per
cent, south 60.2 per cent. See Fig. 11.) Temperature readings
indicated that tempe rature s in the roof space we re approximately lOoF higher than those outside between March 5 and 14, and 12°F
higher than those outside between March 17 and 28. The average
outside temperature between March 5 and 14 was 18.5°F, and the
average roof-space temperature was 28. 6°F. Between March 17
and 28, the average outside temperature was 33.2 °1'; and the average
roof-space temperature was 45. 8°F.
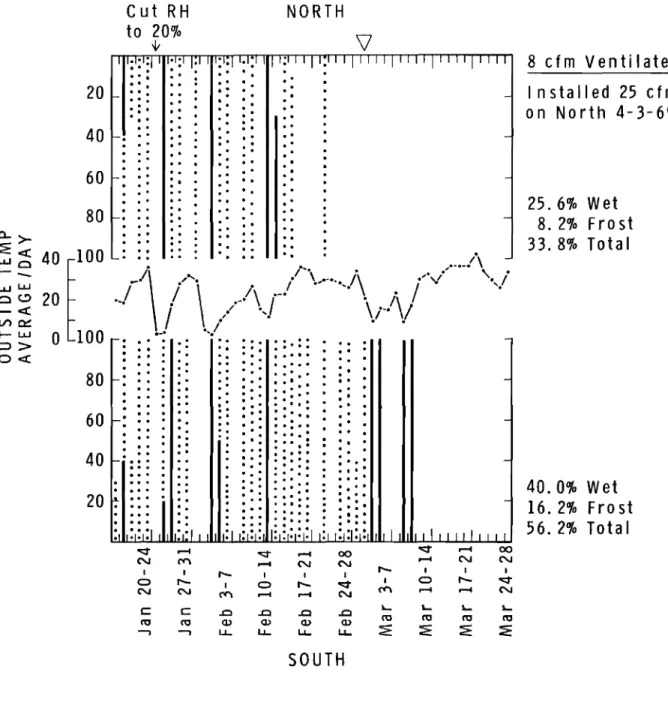
Space 11 (High leakage, vented; total condensation: north 33.8 per
cent, south 56.2 per cent. See Fig. 12.) There was very little
difference in the amount of condensation in this space and in Space No. 10.
A small fan (25 dm) was installed on March 4 at the north
side, which blew outside air into and through the space. No condensation
took place on the north side, but condensation remained on the south side in varying degrees.
12
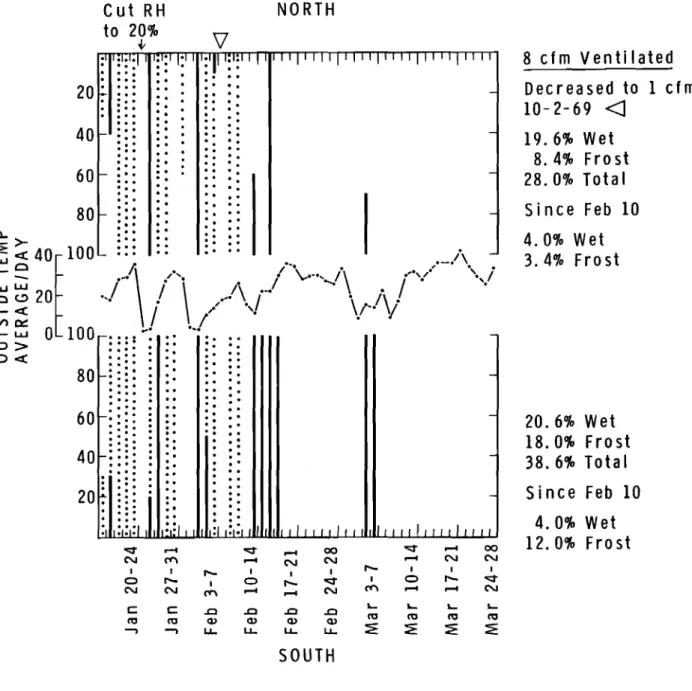
-Space 12 (High air-leakage January 20 to February 10; low
air-leakage February In to March 28; vented; tota.l corHlpIIH;d:illn:
north lH po r cent , south 38.6 pcr cent. Sne '·'ig. '3.) 'l'11t'
Hignificallce of the test in this s pa c e HUH ill th« clllllpal'iHlllI ho t.wo e n
the different air-leakage areas. High leakage r e s u It a in a high
percentage of wetness, but low percentage of frost whereas low leakage results in a high percentage of frost and almost no wetness.
Space 13 When the insulation was removed on March 27, no wetness
was observed at the ceiling boards. Moisture readings ranged from
21 to 67 per cent with highest readings at or near the joints of insulation. The plywood at the exterior wall between the joists was wet.
Space 14 The insulation was dry when it was removed, and the roof
boards were also dry to touch, but they had moisture readings of
between 22 and 70 per cent. The first 18 in. of the roof board on
the south side were damp and showed fungus growth, similar to
the fungus growth in Spaces 2 and 3.
Space 1S The top layer of insulation was damp, wet, or very wet
above the orifice area. Roof-board moisture content measured
between 25 and 70 per cent.
SUMMARY
This study indicated the extremely complex nature of
condensation in attics in general, and condensation in flat roofs in particular under certain climatic conditions.
This section summarizes some conclusions drawn from the observations and, although not definitive, they may provide some guidance for further investigation and tests.
VENTILA TION
There is no doubt that ventilation of roof spaces effectively
controls condensation (a) by removing vapour entering the space fr orn
below, and (b) by removing vapour that has evaporated from collecting surfaces.
It is quite obvious that, even on a windless or nearly windless day, some air movement, whether caused by air-pressure differences or outside conditions alone, takes place in the ventilated spaces of the flat roof; thi s was shown by the smoke te st in Space 10.
Throughout the test period both of the unventilated Spaces
(8 and 9) had the highest percentage of condensation. Even after
all other spaces had reached the zero percentage rrra r k , they were
still showing a substantial degree of darnpne sa or wetness (week
starting March 17, 1969). Darnpne s s was still observed in Space 9
on May 2, 1969.
Increased ventilation by rne charric al rn e an s , as applied to Space 11 on March 4, indicated that condensation rn ay have been prevented in the north section, which had been dry since February 26, but had no obvious influence on the south section, which kept
a degree of wetness and even frost until March 12. The fan rn ay ,
however, have been too srna.Il in capacity, or the season too late, to show anything conclusive; or perhaps no pressurization took place and the south air was a mixture of outside and inside air.
DEGREE OF CONDENSATION RELATIVE TO SIZE OF ORIFICE
If one compares Space 6 (medium air-leakage) with Space
7 (high air-leakage), one finds that there was very little difference
in the percentage of total condensation (compare Figs 7 and 8).
although Space 7 has twice the orifice area. There was, however,
a difference in the relative percentages of frost and wetnes s in the
same period of time (January 20 to March 7). Space 6 has a higher
frost percentage than 7, but only 50 per cent the orifice area. One
also finds that Space 12 had a higher percentage of frost after the orifice was reduced from high to low air-leakage than before.
The percentage of actual condensation in the ventilated spaces as related to the total possible condensation seems to alter with a change
in the size of orifice or leakage area. This was demonstrated in Space
12 after February 10, when air-leakage was reduced, and in Space 6 which showed a relatively high degree of frost although only m ediurn
air-leakage took place. Large orifices produced a smaller percentage
of frost, but a greater percentage of wetness (see Figs 14 to 21 which illustrate the percentage of condensation in degrees of frost and wet-ness).
When the opening into the roof space was increased to the rn axirnurn by removing the vapour barrier completely (Space No. 4
after February 21), no condensation of any degree took place. An
explanation for this m ight be simply the fact that the resulting larger flow of heat into the roof space, throughout the entire area of the space, created a favourable air-temperature mixture.
14
-By contrast a restricted flow of air (and heat) into the roof space, as might occur through joints and openings in the otherwise relatively irnpermeable vapour barrier, would probably have resulted
in u nf a v ou r abl o air-rnixture conditions, not directly above the o riIi.c o ,
but in its immediate vicinity.
One might suggest that high air-leakage into the roof space would prevent condensation; also to be taken into account, however, is the added heat loss necessary to maintain the potential condensing
surfaces above the dew point temperature. The observations point
out the marked effect of air leakage on the thermal as well as moisture
conditions within the roof space. They also suggest that greater
emphasis needs to be placed on the air tightness of the ceiling rather than the vapour tightness.
OUTSIDE TEMPERATURE AND ROOF-SPACE TEMPERATURE Roof-space temperatures were recorded in three spaces, 4,
9, and 10; unfortunately these records were not begun until near
the end of the season.
'I'e rn pe r a.tu r e s in Space 4 were observed with the following re sults:
Between March 5 and 14,
Average outside temperature Average roof-space temperature
Difference
Between March 17 and 28,
Average outside temperature Average roof-space temperature
Difference Temperatures in Space 9 were as follows:
Between March 5 and 14,
Average outside temperature Average roof-space temperature
Difference
Between March 17 and 28,
Average outside temperature Average roof-space temperature
Difference 18.5°F 41. 7°F 23.2 OF 33.2°F 52.8 OF 19.6°F 18.5°F 32.4°F 13.9°F 33.2 OF 43.0oF 9.8°F
Space 10 gave the following re suIts: Between March 5 to 14,
Average outside temperature Average roof-space temperature
Difference Between March 17 and 28,
Average outside temperature Average r oof-cs pac e temperature
Difference 18.5°F 28.6°F 10.1°F 32.2OF 45.8°F 12.5°F
As was expected, the highest ternpe r atuz-e was recorded In Space 4.
The pattern of temperature recordings in Spaces 9 and 10, as they have been presented here, might be misleading if applied to the
entire winter season. More extensive records show that the
roof-space ternpe r atu r e in Space 9 (and also 8) was always colder during
the earlier part of the winter. Sorrretirne during the latter part of
winter, this pattern changed: the temperature in Space 9 became slightly higher than in 10 in the noon and afternoon readings only. The morning readings of Space 9 in most cases still r erna ined substantially below that of Space 10.
The temperatures for the same three spaces were recorded on a chart, and subdivided into two periods, the first between March 5
and 12, and the second between March 13 and 28, The following pattern
ern e r g ed ,
The outside ternpe r atu r e s ranged from 10 to 30°F between
March 5 and 12, and from 25 to 35°F between March 13 and 28.
In Space 4 from March 5 to 12, the roof-space temperatures
were widely scattered, ranging between 20 and 60°F. In the second
period, they clustered between 50 and 60°F.
In Space 9, during the first period the temperatures were
clustered, ranging fr orn 20 to 40°F, and were again clustered during
the second period, ranging from 40 to 60
°
F.In Space 10, they were widely scattered between 10 and 40°F
during the first period, but were clustered, ranging between 30 and 60°F from March 13 to 28.
16
-The temperature of the air in the roof spaces became significant,
when Figs. 6 to 13 were studied. Despite all the other factors that
dictate conditions inside roof spaces (air dew-point temperature, RTf
of outside and inside air, wind, Hun, SIlOW cover, Hセエ」NIL the 20°F out s iclr:
air temperature appeared to be the dividing line QIHセャNキHセ・ョ Lro st on one
hand and wetness or dryness on the other. (In Spaces 8 and 9 t.h i s
dividing line might have been 2 to 4 degrees higher). INSIDE HUMIDITY
With the local conditions in and near the test building, the
percentage of humidity (when above 30 per cent) seemed to have had no
influence upon the amount of condensation produced. When mechanical
humidification was discontinued on January 24, condensation disappeared
in all spaces except 8 and
9.
Soon after January 27, when humidificationwas begun again, condensation built up very rapidly. QUANTITY OF FROST
At no time during the test period and in none of the spaces did
the quantity of frost exceed 1/4 in. in thickness. The release of energy
through the formation of frost and the resulting tem.perature of the frost
surface might be factors controlling further frost accumulation. It was
observed that on dry and relatively speaking colder-than-air surfaces of the roof boards, condensation can occur in a very short period of tim.e (within one hour), but once the 1/4-in. thicknes s has ac cum ul at ed , further build-up of frost stopped, even though climatic conditions, inside and out, remained constant.
To gain some indication of the difference in temperature in
the area below the frost surface, and in the rest of the roof space above
the insulation, fog was observed in some of the spaces. The fog moved
in a circular motion between the top of the insulation and about 1 in. below the frost surface, never touching the frost surface itself.
WIND
The importance of the action of wind is three -f'old ,
(1) It is a primary force affecting the location of frost formation.
As a rule, condensation seems to be deposited at the side
opposite to the wind inflow area. The reverse appears to be
the case, however, at very low outside temperatures and at the beginning of frost ac curnuIat ion in a previously dry space. Frost is deposited on the windward side before it migrates along the remainde r of the roof space.
(2) It influences ventilation rate, a primary factor in dete rrnining the mixture condition where air leakage occurs.
(3) It is a force in respect to negative or positive pressure inside
the roof space; in the light of the whole process of condensation,
however, this wind action may have been overemphasized. Its
uncertainty and unpredictability as to direction and speed works, in the end, as an equalizing force.
At higher speeds, the force of wind can pressurize the roof space; that is, air from the inside will be prevented from flowing into
the ceiling. The level of equalization lies somewhere inside the
in-sulation; this was clearly demonstrated during the second smoke test,
taken on February 13 in Spaces 7 and 12 when there was a north-west
wind, 17 rnph, As was previously mentioned, no smoke was detected
inside the roof space. This could be attributed to higher ratio of
mixing, but more likely, it was caused by the higher pressure which held the smoke inside the insulation.
SUN
The influence of direct sun radiation on the drying process of liquid or solid condensation in a flat roof seemed to be negligible during
the first part of the test period (up to February 15). After this date,
sun radiation (even on cloudy days) apparently became a factor of importance.
No change, however, was observed in the unventilated spaces (8 and 9).
SNOW AND ICE COVER ON ROOF
A I-in. deep snow cover was recorded on only 8 days (out of
a total of 50 test days). These days were not in consecutive order.
Ice, however, covered the roof area for almost the entire test period. It is extremely difficult to relate the amount of frost below the roof board to the thickness of the ice cover above from strictly visual
observations. No attempt was made, therefore, to study the influence
of snow or ice on the behaviour of condensation.
This paper has summarized the observations taken during the
first of two winters of various roofing systems. These observations
18
-With the data that will have then been obtained, it is hoped that a greater understanding of the mechanism of condensation in flat roofs will be reached so that improved designs for residential flat roofs can then be recommended.
SOFFIT VENTILATION INFILTRATING AIR EXFILTRATING AIR THROUGH ORFICE PLATE DOWNFLOW HEATER '/1\'.
PLYWOOD COVER FOR AIR DISTRIBUTION
Figure 2. Observation Openings into Joist Spaces.
Figure 3. P'Ieriurn Showing Openings into Joist
zc:;"
iセ
:;:0 fTl -. Cll 0 0 3..
(0 c.:E セ ::r- _. 0:::' c: 0 _. セN 3 ::;. ..., " VI 0 ..., - 0 セM o -Cll _ 0 » - -. Cll 0 "< m..., 0 ",Cll セcGZャ o - " ' 0 .... "'m0(O::r-- :;::0 °O(Om"< Z » (0 Cll _ C':l3: m6"
m (0 1 ; j -13: I Cll ' " Cll fTl»I
'"
-< 0'-1 tr: 0 VI -I 0 ZZイM」Zッセ"
I -... セ ZZイMセ 0 ('")....
c: » m 0 ..., :;::0 "'tJ CII -:;:0 .--m cr CII 0 » » I 0 ..., z Z ...,-.
I ; j m C':l0 fTl"'T'1 3:c....fTl O Z Miセ VI-I VI/
"'tJ » ('")MMMNセM
fTl VI.
/
Ii1 it. .jlt
..
I-I
FILLED WITH INSUL, VB, NL, NO VENT -I
I
INSUL. PACKED AGAINST ROOF BOARD, NO VB, NO VENT NI
I
INSUL. PACKED AGAINST ROOF BOARD, NO VB, NO VENT \J.JI
I
INSUL. BOTT. JOIST, REMOVED VBVB, NL, VENTED21 FEB セI
I
INSUL. BOTT. JOIST, VB, NL, VENTED V1I
I
INSUL. BOTT. JOIST, VB, ML, VENTED 0 'I
INSUL. BOTT. JOIST, VB, HL, VENTED -.J
I
I
INSUL. BOTT. JOIST, VB, NL, NO VENT 00I
I
INSUL. BOTT. JOIST, VB, HL, NO VENT -.0I
I
INSUL. BOTT. JOIST, VB, HL, VENTED C;I
I
INSUL. BOTT. JOIST, VB, HL, VENTEDI
SAME AS II - REDUCED TO LL 10 FEB N
I
I
INSUL. PACKED AGAINST ROOF BOARD NO VB, NO VENT ;:;;I
I
INSUL. PACKED AGAINST ROOF BOARD NO VB, NO VENT-I
GYPROC CEILING :I
I
FILLED WITH INSUL. VB, HL, NO VENT V1I
イMMMMMMMMMMMMMMMMMMMMMMセ
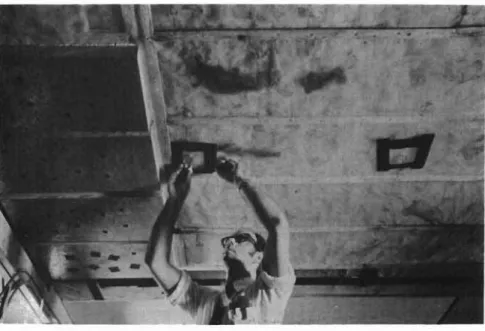
Figure 5. Installation of Instruments for Measuring 'I'erripe r atu r e Inside Joist Spaces.
20
40
to 20%
{-N. L. Vented
21-2-69 Removed V. B.
100% Leakage
<J
4.8% Wet
3.0% Frost
7.8% Total
1.
0% Wet
4.0%
Fro st
5.0% Total
'<:j" r-4 '<:j" r-4 00 '<:j"...
Lt'\...
N N N ('1"\ r-4 N N I I r- I I I r- I I I I 0 r- '<:j" 0 r- I 0 r- '<:j" ('1"\ r-4...
N N N ('1"\ r-4 r-4 N C C .c .c .c .c L.ro L.ro L.ro L.ro ro ro <1> <1> <1> <1>セ :iE :iE :iE
...,
...,
u.. u.. u.. u..SOUTH
20
60
60
80
80
40
0..>-セ <t •セ
£::)40
セ 100 . .
. .,
•.•
.r.
-....-. / /. .
. . ' . .
LJ.J LJ.J ••• \r-.
.
i \.._-.,/\
/'
v
'.'/
セ セ
20
.j
I \ ./...'\
r
.\
セA|
.
VI 0:= / . '<:
I!
I-- L.LJ • • / •::) >
0 100
.-
'.
o<tFIGURE 6
PERCENTAGE OF CONDENSATION
IN
SPACE 4
••••••••• PERCENTAGE OF WETNESS
Cut RH
to 200/0
V
NORTH
4 cfm Vented
r-·
·
·
.
·
.
-· -·
·
:. ·.
·
.
·
·
·
·
·
·
·
· ·
·
.
.
·
·
l -·
·
·
· ·
.
-·
·
·.
· ·
·· ·
.
·
·
·
·
·.
·
·
·
·
··
·.
l-·
·
·
·
·
.
-· -·
·
·
·
·.
·
·
·.
.
· ·
··
·.
· ·
·. ·.
l-·
.
·
··
·.
-·
:
:
·· ·
·
·.
.
· ··
·
.
··
·
·
.
· ··.
:
. ·.
e;-·
·.
.
· ·.
-·
·
·
.
·
·
·
:,
I,:,:
·.
I , I II I,1,
I:' ,·
I , ,1 , I • ,I 1,,"1,,"11111III
1:'1':1 I II II II:• IIII:' I
1111111111111 I II I II I II I II 1I I·
·
..
·
l-·
·
..
..
·
-·
·
..
·
·
..
·
·.
·
·.
·
-l-·
.
·.
·
·
.
·
·.
·
·
·
·
.
.
l -·
·.
-·
·
·
·
·.
·
· ·
.
·
· ·.
l-·
·
·
.
-·
·
·.
·
·
·
.
·
·
·
·.
·.
·
·
·
.
.
'-·
· ·
.
-40
20
12.0%
Wet
19.8% Frost
31. 8% Total
20
60
80
40
60
80
7.4%
Wet
a..16.6 Frost
セ セ
40 -100
/>
.,._/\
•
24. 0% Tota I
:
セ
20
...
ャェセ
/....
.1\ ..
i \.-
<,J\ .
l'V
'..../
セセ
i \./ ..
J
V
i \;
セ セ
0 100
.
"/.
:::J>
0 «o:::t ...-I o:::t ...-I 00 oo:::t ...-I U"\
N ('t'\ ...-I N N ...-I N N
I I r- I
• I r- I I I
0 r- I 0 r- o:::t I 0 r- o:::t
N N ('t'\ ...-I ...-I N en ...-I ...-I N
c: c: .c .c .c .c L-co L-co L-co L-co
co co Q.) Q.) Q.) Q.)
:E
:E
:E
:E
..,
..,
LL. LL. LL. LL.SOUTH
FIGURE 7
PERCENTAGE OF CONDENSATION IN SPACE 6
•••••• PERCENTAGE OF WETNESS
26. 2% Wet
11. 8% Frost
38. 0% Tota I
8 cfm Vented
20.0%
Wet
15. 2% Fro st
35. 2% Tota I
·
.
·
.
·
.
·
.
·.
·
.
.
·
.
·
.
·
.
·
.
·
•·
·
..
·
..
·
..
·
..
·
..
·
..
·
..
·
..
·
..
·..
·
·
.
·
.
·
.
·
.
·
.
·
.
·
.
·
.
·
.
·
..
·..
·.
·
.
·
.
·.
·.
·.
·
.
·
.
·
.
·.
·
.
·
.
:..
·
..
.
·
.
·
.
·
.
·
.
·
to 20%
'-it
·
.
·.
·
.
·.
·
.
·.
[iセiZiZiZi I : I: I1:
1 , III I ':1:1 1 1:1:I I I III 1'1 II 1 1I I II , I " II·....
·
.
·
.
··
·
..
..
·
...
·
.
.
. ·. ·
·
.
·
.
.
··
..
·
. . ·
. ·.
-·· ·
· ·
.
·
.
·
..
·
·
·
· ·.
·
.
·
..
·
· ·
· ·. ·
.
·
..
·
·
•· ·.
·
.
·
..
·
·
·
·
·
. ·
.
·
..
·
-·
·
·
·
. ·
.
·
·
. ·
·
·.
· ·
·. · · ·
· ·. ·
.
·
.
.
·
·
·
. ·
· · ·.
·.
·
·.
·
•· ·
.
·.
•·.
·
·
.
-·
· ·.
·
·
· ·
·.
·
.
·
·
·
·
·
.
·
.
·
·
·
·
·
·
· ·.
·
·
· ·
· ·
.
·
.
·
·
•-·
· ·
•·. ·
·
· · ·
•·
·· ·. ·
.
·.
·
·
·
·
· ·
.
·.
·
·
·
· ·
. ·
.
·
·
.
-·.
60
·
.
40
·
·.·. ·
·... ·
...
·
·
.... ·
·.... ·
20
·
·
·
....
....
....
20
40
40
60
a.. >-セ -d::40 100
UJ l --
e UJ UJ et=>20
-c
V') c:::: I - UJ0 100
::::l>
O-d::80
セ-
セ-
00 セ-
00 N ("t'\-
N N-
N N I I r- I I I r- I I I I 0 r- qo 0 r- I 0 r- セ ("t'\-
-
N N N ("t'\- -
N s:: s:: .c .c .c .c....
fa....
fa....
fa....
fa fa fa Q) Q) Q) Q) セ セ セ:E
...,
...,
u; u. u, u,SOUTH
FIGURE 8
PERCENTAGE OF CONDENSATION IN SPACE 7
PERCENTAGE PERCENTAGE
OF WETNESS
Cut RH
to 20%
W
I1'1'1'
20
40
r-60
r-11; 1 III
II' I
I iセiNORTH
:1':1
I 11:1·
•··
·
I I I I I I I I II I I I I I1 1I I-N. L.
Not Ventilated
a..ZZeセ
LU O 1 -LULU oセ ct: tn 0:::: I-- LU :::» Oct:40
20
o
80
r-80
60
40
20
SOUTH
-
8.2% Wet
19.2% Frost
27.4% Total
FIGURE 9
PERCENTAGE OF CONDENSATION IN SPACE 8
PERCENTAGE PERCENTAGE OF OF WETNESS FRO ST
40.0% Wet 59.0% Frost 99.0% Total 40.2% Wet 46.0% Frost 86.2% Tota
I
8 efm Not Ventilated
L. m :E L. m :E o:::t ... 00 ... N N I I I C) r- o:::t ... N
·
.
·
.
·
·
:.
.
·
.
·
.
·
.
·
·
.
.
.
·
.
.
·
.
·
.
·
.
·
.
·
·
.
.
·
.
·
..
.
..... ....
·
.. ....
·
"" "." I,:1.1 :.: 1.,.,,1010"1 to 20% -} ::1,
II·
::セiセ : II:II II:1:
·
:1: I:
I:·
·
·
·.
·
·
·
·
·
·
·
·
·
·
·
·
.. ··
·
·
·
··
·
·
·
·
·
·
·
· ·
·
·
·
·
··
··
·
·
·
.··
····
·
·
·
···
··
·
··
·
·
·
··
·
·
··
· ·
·
·
·
·
··
·
···
··
·
· ·
·
···
·
·
·
·
·
· ··
···
·
· ·
···
·
·
·
·
·
·
·
··
·
·
·
··· ·
·
·
··
·
·
·
·
·
·
·
·
·
·
·
·
·
·
·
·
·
·
·
·
·
·
··
·
·
· ··
· ·
·
···
·
·
· ·
·
·
·
·
·
·
···
··
·
·
·
·
···
··
·
· ·
·
·
·
·
··
··
·
·
·
·
·
·
·
··
···
· ·
·
··
·
·
·
··
· ··· ·
· ·
·.
··
·
·
·
·
·
·
··
·
· ·.
·
·
· ·
·
·
·
·
,·
··
·
·
··
···
·
·
·
·
·
·
···· ·
·
·
, ,··
,·
·
·
··
·
·
,·
,·
,··
,·
,·
·
·
·
·
·
·
,· ·
· ·
,·
··
,·
·
·
·
·
·
·
,·
·
· ·
·
·
, ,··
·
·
·
·
,··
, ,·
·
, .,·
,·
,·
·
·
·
·
·
····
·
,····
,·
·
·
,·
·
·
·
,·
·
·
·
·
' ,·
··
·
·
·
·
·
·
·
, , ,·
·
,·
,·
·...
...
·
...
·...
...
... .
...
·
....
"... .
·...
·...
... .
·
...
·
...
·...
·
...
·
...
·
...
...
...
·...
...
.
, II:,
:,
:,:1:1:,:,:1
II:, o:::t...
o:::t...
00 N m...
N N I I r- I I I r-C) r-,
C) r- o:::t I N N m...
...
N m c c .c .c .c .c L. m m Q) Q) Q) Q) m...,
...,
u. u. u. u. :E SOUTH · .... ..•.•1\'\
/ - . . ',.
I
,,'
/
.",..\
../\ ..,
.
;' \.···,..1\
. i\
/"".,
"/
'" ...i
...
,.
/ "/
v-·
V·
20 40 60 20 40 60 80 0- >-セ eX:40
セ
100
LLJ Cl ... -LLJLLJ cQセ 20 -eX: VI Ck:: ... LLJo
100::J>
0eX: 80FIGURE 10 PERCENTAGE OF CONDENSATION IN SPACE 9
. . . PERCENTAGE OF WETNESS PERCENTAGE OF FROST
Cut RH to{,20% NORTH 40.0% Wet 20.2% Frost 60. 2% Tota I 8 efm Vented 27.4% Wet 12.2% Frost 39.6% Total ,
.
:
.
·
.
·
.
·.
·
.
·.
·
.
·.
·.
·.
.
·
.
·
.
:.
·.
·
.
·
.
·.
·
.
·
.
·
.
·
.
·.
·
.
·
.
·.
·.
:.
·
.
·.
·
.
·
·.
·
·.
.
·
.
·
·.
.
60 40 60·
.
·.
·
.
·.
·.
·
.
·.
·.
::
:.
·
.
".
·
.
.
. .
.
·
.
.. .
.
.
.
·.
.
.
.
..
'...
..' . ..
·. ..
..'
. .
.
::::
::::
::
I I I I . : : : I I : : 80·
.
:'. .'.
.
: : .. " .,.. .
.
0->-II::
::"
::::
セ セ ZZセャoo
JJ\
i/"
l
o o / \r>.
i\
<>
- «
/
/'
'.
/:
/
セセi
.
.
t-LI.I 0 100 .•• -" " ='> : . : : : : : : ::::::: ::: o et: . : . , : . I ' : . : :• • : , " ' : I I : : : : : : . : : :80
..
, _ , : :
. .
.
.
::
.
::::::: :::
.
....
" '.,.
.
.
..
.
.
.
: ::
.
" '..
::
::
:::.:::
:::
·
.
..
:..
:.
'. '"·
.
.
.
.
....
" " .·.
.
..
.
..
"".
I I : : : : : : : : : : :·
.
..
. .
.
::
.
.::
:::
·
.
..
.
::
.
..
..'
·.
.
.
.
.
.
.
.. ..,
I I : : : . : : : : 20 • ' . , •.•' .. .
: ..
·
.
.
· .
·
.
"'"
..."'"
... 00"'"
... 00 C'J ("t'\ ... C'J C'J ... C'J C'J I I.-
I I I.-
I I I 0 l"- I 0.-"'"
I 0.-
"'"
C'J C'J ("t'\ ... ... C'J ("t'\ ... ... C'J c: c: ..c L.. L.. L.. L.. ..c ..c ..c ro ro ro ro ro ro Q) Q) Q) Q) :E :E :E :E ...,...,
u. u. u. u. SOUTHFIGURE II PERCENTAGE OF CONDENSATION IN SPACE 10
. . . PERCENTAGE OF WETNESS dセ セGBゥBGNSMW
25.6% Wet 8. 2% Fro st 33.8% Tota I 8 cfm Ventilated Installed 25 cfm Fan on North 4-3-69
<J
-40.0% Wet-
16.
20/0 Fro st I11'"11,,"
56. 2% Tot aI o::t ... 00 ... N N r- I I I I 0r-"'"
('t"\ ... ... N L.. L.. "- L.. ro ro ro ro :?: セ セ :E·
.
·
·
.
·
·
.
·
·
.
·
.
·
.
·
.'
·.
·
.
"'"
... 00 ... N N r- I I I I 0r-"'"
('t"\ ... ... N . 0 . 0 . 0 . 0 Q) Q) Q) Q)u.. u.. u.. u..
SOUTH
··
·
·
·
·
·
·
·
·
·
·
··
· ··
·
·
·
··
·
· ·
.'
.
.
'.
·
:
o::t ... N ('t"\ I I o r-N N c:: c:: ro ro -, -, 20 ; :::.
...
J: ::
..
: :,:,:1,1
:,:11
·
80
f-:
·
··
60
1-:
·
·
·
40
·
to 20% t·
·
.
20·.
·.
·
.
·
.
40·
·
·
.
.
.
·
.
·
.
.
·
.
·. .
60· ·
·
·
.
.
:
.
·
.
·.
·
.
80
..
·
·
·
.
:
..
·
,..
401
00 :セ セ セ セ セ
: : .: • ..•j\ 20l ..
/1\ / \
.j, /._/ .\
J\,
i\
/,,·v·..
"'/
/ ,'/ <,r: /
o
100
r- • • • ' .-: • •••<. '" .. ".
"
· .
:
It.. .. ....•
:::
:
..,
.
...
.
..
.
..
.
.. .
::
.
:.
::.
:
': :
::
:
:.
:
::
.::
::
:::
ZZセNZ: .:
.
·
.
..
.:
..
....
.'.
::
:::
セセ
::: :::::
:
::
:
::
::.
-.
:.:
:::::
:
:.
:
..
.
.,
..
.
:...
:.
:.
:
..
.
.'
:
::
::::..
. .
...
.
..
.
..
.
.
.
.
.
...
:::.::
:::::
.
..
..
...
. .
·
:::
_::::
.
::::
·
:
..
::::.
::::
·
:::
::
.
I,: I,:,:,: 11:1:':':,:
I ,:,1:1:1 :,:,
0..>-セᆱ LLJo 1 -LLJLLJ oc.::>- «
V'l a:::: I-- LLJ ;:::» 0 «FIGURE 12 PERCENTAGE OF CONDENSATION IN SPACE II
. . . PERCENTAGE OF WETNESS
20.6% Wet 18.0% Frost 38.6% Total Since Feb 10 4.0% Wet 12.0% Frost 8 cfm Ventilated Decreased to 1 cfm 10-
2-
69<J
19.6% Wet 8.4% Frost 28.0% Total Since Feb 10 4.0% Wet 3.4% Frost NORTH'e::t
...
'e::t.-.
00 'e::t.-.
00C'J ('t'\
.-.
C'J C'J.-.
C'J C'J I • r- I I I r- I I I 0 r- I 0 r- 'e::t I 0 r- 'e::t C'J C'J ('t'\.-.
.-. C'J ('t'\.-.
.-.
C'J C C . 0 . 0 . 0 . 0 セ セ セ セ l'tl l'tl Q) Q) Q) Q) l'tl l'tl l'tl l'tl...,
...,
u. u. u. u. :::;: :::;: :::;: :::;: SOUTH Cut RH to 20%.v
r-' :·...
: : :· ·
·.
.
·. ·
:
.
·
.
.
:'.
·
.
...
.
·
.
·
... ·
·
:. ·
.
-:
::
:
·
· ··
·
·
·. ·.
·.
-:
: :
:
·
·
·
. ·. ··
·
. ·
.
:
..
·
·
.
·
·.
.
·
·.
·. ·
..
·
. ·
.
-.
:
·
..
·
.
·
.
-·
·
·
·
:.
. ·. ·.
,·
. ·.
·
.
:'.
·
·
:
·
.
'.
·
·
. ·
·.
·
:
.
-·
.
·.
:·
·.
· ·.
·
·.
·
..
·.
·
·
·
.
· · · ·.
·
セ·.J
·
· .
·
.
· ·
:.
.
·
·
·
·.
:
.
.
-·
·
セIL
·
.
· ·
·
·
:,
·.
:.:1
I I:1 ,:,:,
·
I I II I I III , 11111111111/1/ 80 60 40 20·..
·..
.
,.
·..
20 .- •••:::
::.
::.
. ••::::.
::
40 : : : ::::::
...
::::·
.. ..
:::
:
:
:
:
:.
...
60 :::::·.. ..
::.:.
.
::.::
::::
80 ::::
.. .
:..
: : :.:
..
c. • • • • • ••• •;
セ ZZセャoo
,;J\
>\
ZZLセセ
j.jl"\.""..j\
i\
<>
- «
/ , . '
\/"
If
V') 0::I
.
r-LLJ0
100 ..' '•• ::» 0 «FIGURE 13 PERCENTAGE OF CONDENSATION IN SPACE 12
. . . PERCENTAGE OF WETNESS - - - PERCENTAGE OF FROST
セXャMカャ •.JeW 0
I
セ .pIII
W t
::I:
J1Z-1I
· .JeW u•
l
-e/
vr-ut
«
•
::> a... 0 •.JeW Vl Vl \ \ z a> \i-s
· .JeW Vl 0> 0 10 Vl Mセ 10 8l-vl Gア。セ wZ "C a>-
I -a> ...J VI I w VI 0 -e'-{) Il-l1 Gア。セ セ 10 ......
Q.)\
:
Q . ) ' -LL. セ C... «
セCI
/ : vt-nt
Gア。セ z«
- 0 I I -0 I Vl-
• -0 l-£ Gア。セ\:
0 セ c::: 0 LL. w/1
1 £ - U· uer
LL.....
Z 0 w· uer
> • -0 vl-Ol L&J L&J c::: w e." C> L&J « 0 0 0 0 0 0 c :..:: 0 00 \0 セ N «-
z w セ ...J 0 Z "" 0 « I - 0-e
8l-vl •.JeW«
Vlz
I
z L&J -@ Il-l1·Jew
cI
z0-
::I: -@ vl-0l · .JeW u l-II
LL. c::: 0Q.) 0
o-e
l-£·Jew
L&J0> Z