HAL Id: hal-03193879
https://hal.archives-ouvertes.fr/hal-03193879
Submitted on 9 Apr 2021
HAL is a multi-disciplinary open access
archive for the deposit and dissemination of
sci-entific research documents, whether they are
pub-lished or not. The documents may come from
teaching and research institutions in France or
abroad, or from public or private research centers.
L’archive ouverte pluridisciplinaire HAL, est
destinée au dépôt et à la diffusion de documents
scientifiques de niveau recherche, publiés ou non,
émanant des établissements d’enseignement et de
recherche français ou étrangers, des laboratoires
publics ou privés.
Distributed under a Creative Commons Attribution - NonCommercial| 4.0 International
License
End-to-end Systems
M. France-Pillois, Jérôme Martin, Frédéric Rousseau
To cite this version:
M. France-Pillois, Jérôme Martin, Frédéric Rousseau. A Non-intrusive Tool Chain to Optimize MPSoC
End-to-end Systems. ACM Transactions on Architecture and Code Optimization, Association for
Computing Machinery, 2021, 18 (2), pp.1 - 22. �10.1145/3445030�. �hal-03193879�
21
End-to-End Systems
MAXIME FRANCE-PILLOIS and JÉRÔME MARTIN,
Univ. Grenoble Alpes, CEA, LETI, MINATEC Campus, FranceFRÉDÉRIC ROUSSEAU,
Univ. Grenoble Alpes, CNRS, Grenoble INP, TIMA, FranceMulti-core systems are now found in many electronic devices. But does current software design fully leverage their capabilities? The complexity of the hardware and software stacks in these platforms requires software optimization with end-to-end knowledge of the system.
To optimize software performance, we must have accurate information about system behavior and time losses. Standard monitoring engines impose tradeoffs on profiling tools, making it impossible to reconcile all the expected requirements: accurate hardware views, fine-grain measurements, speed, and so on. Subse-quently, new approaches have to be examined.
In this article, we propose a non-intrusive, accurate tool chain, which can reveal and quantify slowdowns in low-level software mechanisms. Based on emulation, this tool chain extracts behavioral information (time, contention) through hardware side channels, without distorting the software execution flow. This tool con-sists of two parts. (1) An online acquisition part that dumps hardware platform signals. (2) An offline process-ing part that consolidates meanprocess-ingful behavioral information from the dumped data. Usprocess-ing our tool chain, we studied and propose optimizations to MultiProcessor System on Chip (MPSoC) support in the Linux kernel, saving about 60% of the time required for the release phase of the GNU OpenMP synchronization barrier when running on a 64-core MPSoC.
CCS Concepts: • Computing methodologies → Simulation tools; • Software and its engineering →
Software design tradeoffs;
Additional Key Words and Phrases: SW profiling, HW/SW optimization, emulation platform, non-intrusive tool chain, clustered MPSoC
ACM Reference format:
Maxime France-Pillois, Jérôme Martin, and Frédéric Rousseau. 2021. A Non-Intrusive Tool Chain to Optimize MPSoC End-to-End Systems. ACM Trans. Archit. Code Optim. 18, 2, Article 21 (February 2021), 22 pages.
https://doi.org/10.1145/3445030
1 INTRODUCTION
High performance computing introduces complexity to hardware platforms (multiple computing units, heterogeneous platform, etc.). To benefit from these complex platforms, software must be
Institute of Engineering Univ. Grenoble Alpes.
Authors’ addresses: M. France-Pillois, J. Martin, Univ. Grenoble Alpes, CEA, LETI, MINATEC Campus, F-38000 Greno-ble France, F-38054 GrenoGreno-ble, France; email: [email protected], [email protected]; F. Rousseau, Univ. Grenoble Alpes, CNRS, Grenoble INP, TIMA, F-38000 Grenoble, France; email: [email protected].
This work is licensed under a Creative Commons Attribution International 4.0 License.
© 2021 Copyright held by the owner/author(s). 1544-3566/2021/02-ART21
tuned directly on the hardware support to cope with difficult-to-predict hardware and low-layer software behavior (multi-threading, cache hierarchy, etc.).
As a consequence, the accuracy of behavioral information (timing, memory access, and so on) is the starting point to efficiently optimize embedded systems.
In a native environment, timing information is usually obtained by inserting some specific in-structions into the initial program in order to observe the system clock. However, this code instru-mentation leads to time-shifting, which can change the program’s behavior, and distort or mask slowdowns encountered during nominal execution.
Therefore, since simulators can extract data related to software execution without distorting nominal execution flow, they become the de-facto solution. Nevertheless, relevant timing infor-mation can be retrieved only with a simulator running an accurate model of the hardware plat-form, taking any hardware specificities into account. Unfortunately, this accuracy is not free, and simulation running times are extended with this level of precision.
Being aware of this difficult tradeoff between accuracy and simulation time, we designed a non-intrusive tool chain to analyze software mechanism performance issues in fine detail. Based on an emulation platform, this tool can extract accurate information on a Register Transfer Level (RTL) cycle accurate platform for applications with a long running time without distorting the software’s behavior. The data are then post-processed by a set of tools extracting useful information (latency, memory access, etc.).
In this article, we introduce several contributions:
— A full non-intrusive fine-grain profiling framework monitoring a cycle accurate RTL em-ulation based system. The proposed tool-chain encompasses existing solutions enabling cross-CPU events tracing and broad spectrum hardware signals watching.
— A software/hardware study of the GNU OpenMP synchronization barrier mechanisms on a 64-processor MPSoC platform.
— An optimization of the MPSoC support of the Linux kernel.
The remainder of this article is organized as follows: Section2introduces the notion of soft-ware observability. Section3presents an overview of other research into the same trends, and emphasizes the originality of our tool and its advantages. Section4presents the architecture of the design tool chain. Section 5details the tool chain’s implementation and its specificities. Fi-nally, in Section6, we illustrate the use of our measurement tool chain to improve the OpenMP synchronization barrier mechanism on MPSoC.
2 SOFTWARE OBSERVABILITY
To optimize a mechanism, it is necessary to accurately know its behavior. Slowdown sources must be identified, and relevant counter-measures proposed. So, the first stage in the optimization pro-cess is to clearly identify the metrics we wish to measure (i.e., the observability of the mechanism). An ideal measurement tool should combine the following features:
(1) Non-intrusive: the timing of data extraction should not impact the initial behavior by introducing additional delays.
(2) Fine-grained measurement: an accurate time-map for the software application can be built from determining the latency for each instruction executed.
(3) Hardware platform knowledge: since hardware platforms have some inherent restrictions, the tool should provide a picture of hardware usage during software running (memory access, Network on Chip workload, system hot-spots, etc.).
(4) An overall view of the mechanism over the multiple cores running the software: threads of a single task may run on different cores in parallel; thus, software events occurring on different threads must be correlated to extract relevant timing information.
(5) Mild impact on the design running time (wall clock delay): this allows software mecha-nisms to be studied in a realistic environment (operating system, complex applications, etc.).
3 RELATED WORK—MOTIVATIONS
The emergence of MPSoCs integrating a large number of services on a single chip has raised new issues related to the design flow. Designing efficient software applications independently, with-out confronting them to the hardware platform, has become almost impossible. Thus, hardware platform capabilities and limitations must be taken into account during the software design pro-cess. Moreover, support platforms (hardware architecture and low-level software, e.g., operating systems) have become very complex. Consequently, system performances must be assessed and tuned experimentally.
3.1 Native Evaluation
One way to evaluate software performance, taking the hardware platform into account, is to run the applications directly on the target system. The rapidity of software execution makes it possible to run large applications. However, this approach is a black box, from which software behavior and timing information are difficult to extract. The main method to retrieve timing information for software is to instrument the code. Although this method is easy, it has several drawbacks: (1) Instructions are added to the initial program code. These instructions may introduce delays in addition to the original execution flow, thus, potentially distorting the initial software behav-ior and shifting or masking issues. To reduce this intrusiveness, only large-grained samples can be taken. (2) Access to the source code of the application is required to add the instrumentation instructions. Otherwise, this issue can be circumvented by instrumenting the kernel system calls, but this approach considerably limits the accuracy of measurements.
Alternatively, software execution profiles can get through the debugging interface such as that proposed by Zheng et al. [28]. In their work, Zheng et al. used the debugging interface of the ARM bus to extract memory data through JTAG. Then, they built the function call stack tree. Even if the non-intrusive strategy appears attractive, it considerably slows down the software’s execution. The authors report a duration of execution 74x slower than the initial duration. Moreover, data dumping occurs only on system calls. The grain of measurement is consequently still too large to accurately study the timing of a software application.
3.2 Simulation Platform
To non-intrusively obtain software behavior information, we must use side channels. Simulators are good candidates to obtain this information since they can be used to extract information from the simulated hardware platform while the software is running. Gem5 [4] is an example of these simulator tools modeling hardware architecture, while platform system information (like CPU Program Counters) can be dumped throughout the simulation run. Since these data are tagged with the cycle number of the dumped event, it is possible to extract useful timing information and to reconstruct the behavior of the application during execution. However, the rapidity of this methodology depends on the speed of the simulator. The more accurately the simulator describes the hardware support, the slower the simulation’s running time.
In this context, we can wonder about the level of abstraction used in simulation platforms. High-level simulation is inadequate since many hardware-related issues could be missed. On the other
hand, to accurately simulate a system takes a long time (weeks, months). Hence, although RTL cycle accurate platforms, which expose all hardware weaknesses and software behaviors, are the most appropriate to perform an accurate measurement campaign, the extended simulation time makes it unfeasible. Even intermediate simulation levels, like the SystemC cycle accurate model, take a long time to run complex software applications, such as applications running on a full Linux kernel. For instance, with a System Cass platform (System C optimized [5]), our MPSoC 16-core device takes several days to boot a Linux kernel. Gligor et al. [10] proposed to avail of the binary translation technology to speed-up event-driven SystemC simulation. Even if this approach considerably reduced the simulation time, it did not allow software performances to be profiled at the instruction level.
Virtual platforms [19, 20] appear to overcome this simulation/speed tradeof by providing several Intellectual Property (IP) block accuracies: high-level modeling for validated blocks, and cycle-accurate modeling for in-study IPs. However, this method does not meet our requirements. First, we aim to optimize mechanisms closely, interacting with almost all the platform’s IPs (processing unit, memory hierarchy, interconnects, etc.). Hence, by elevating the modeling level of one of these blocks, we directly deteriorate the accuracy of profiling results. Virtual platforms are more suited to architectural design-space exploration objectives and not for accurate HW/SW optimization. In addition, simulated blocks remain only assumption-based models of hardware IPs. Consequently, even cycle-accurate models are subject to errors [6,15], which are problematic when attempting fine-tuning.
3.3 Emulation Alternative
Dealing with the accuracy and the speed issues related to cycle-accurate simulations, FPGA pro-totyping and emulation appear to be good options to accurately profile HW/SW mechanisms. Indeed, we usually consider emulator platforms running 1,000 times faster than RTL simulation [22]. For example, our 64-core platform presented in Section6.1runs at 600K cycles per second on the emulator while an RTL simulator should not exceed 100 cycles per second.
FPGA prototypes can be used to run software applications on top of systems that are very close to the final ones, while information relating to hardware blocks can be retrieved thanks to additional tracer modules, as proposed by Kurth et al. [18]. Unfortunately, FPGA prototypes fall short when dealing with large MPSoC, since they can only run a limited number of cores.
Emulation can overcome this size limitation by aggregating several re-configurable devices. In-deed, the principle of emulation is to configure re-configurable devices (typically FPGA) with RTL descriptions of the MPSoC hardware platform. Thus, this platform is no longer simulated by soft core, but emulated on re-configurable hardware devices. The emulation acceleration is notable, since the boot of the Linux kernel on the same 16-core MPSoC takes only 15 min on an emulator with the accuracy of the RTL.
The emulation principle is not novel, and major Computer Assisted Design companies pro-pose emulation platforms (e.g., Mentor [13], Synopsys [25], Cadence [7], etc.). Most of the time, these platforms are used to speed-up traditional simulation verifications to validate complex de-signs (SoC, etc.) [1,11]. These emulators are very powerful, but also very expensive. Between the expensive fully-emulated solution and the simulation, hybrid-prototyping methodologies can be used to analyze MPSoC performances (time, power). For example, Saboori et al. [24] proposed an engine simulating several cores on a single true core implemented in FPGA.
A large number of works dealing with emulators aim at performing “co-emulation”. Even if this principle initially designates the cooperation between the emulator platform and the host computer, it is commonly used to refer to modules of high abstraction level running on a host computer and blocks of low abstraction level executing on hardware support (i.e. emulator). By
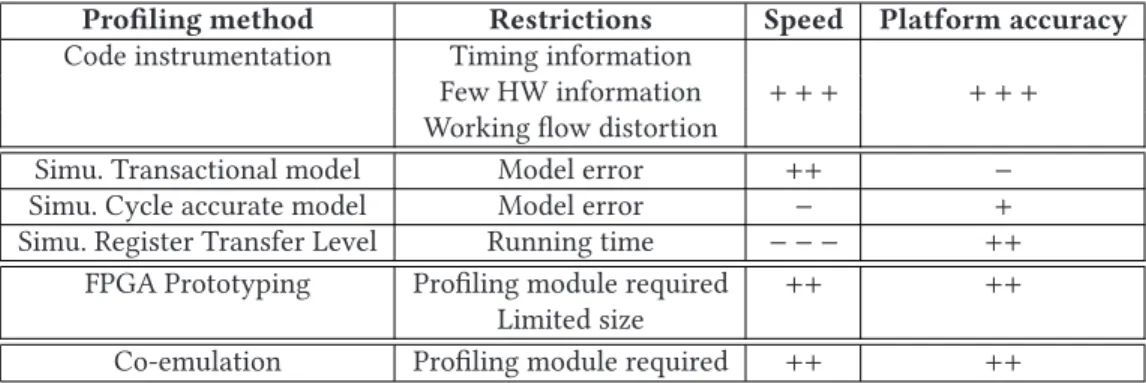
Table 1. Profiling Methods Summary
Profiling method Restrictions Speed Platform accuracy
Code instrumentation Timing information
Few HW information + + + + + + Working flow distortion
Simu. Transactional model Model error ++ − Simu. Cycle accurate model Model error − + Simu. Register Transfer Level Running time − − − ++
FPGA Prototyping Profiling module required ++ ++ Limited size
Co-emulation Profiling module required ++ ++
this way, the global system verification time is reduced. Compared to the simulation, the main drawback of emulation is the loss of design observability. Indeed, emulation platforms cannot observe each signal and perform fine-grained debugging like simulators. Some studies [3,27] ad-dressed this issue by combining simulation and emulation. Simulation is used for components to
be debugged, whereas emulation can deal with already debugged components or IPs. The
combi-nation of the two approaches speeds up the verification process. In Ref. [23], Ohba and Takano emulated on FPGA modules with different definition levels (RTL modules and more abstract ones like Instruction Set Simulator (ISS) modules, SystemC blocks, etc.), to leverage the full capacity of these re-configurable components. In this way, they avoided time-consuming external com-munications with a host computer, which are usually required to perform co-emulation. Indeed, these communications largely slow down the emulation speed. This observation led Nakamura [22] to propose a high-speed link between the emulated circuit and the host computer based on a registry bank, to reduce the duration of communication delays. Nevertheless, these works, as the majority of FPGA-accelerated or Emulator-accelerated simulators, do not provide an accurate and non-intrusive profiling service. Their primary goal is to speed-up the simulation. Moreover, unlike usual co-emulation proposals like in Refs [22] and [23], our purpose is not to elevate the abstraction level of any system blocks, but we want to keep the whole support platform at the RTL level. Hence, since all IPs of the MPSoC are described at RTL level, no timing model is required. Behaviors of the RTL platform are the same as the real platform (except the signal propagation delays, but they are negligible compared to measured durations). Thereby, we avoid errors neces-sarily introduced by simulation modeling as mentioned in the previous section. Table1sums up pros and cons of aforementioned approaches.
Although most emulation platforms were initially designed to perform functional verification, industrial emulators now provide some debugging facilities for software monitoring. A good ex-ample of this kind of tool is the Codelink tool designed by Mentor Graphics [12]. This tool provides more or less the same functionality as the GNU GDB debugger, but in the case of Codelink, infor-mation is post-processed from traces generated by the emulation platform. After the lengthy and involved configuration phase, users can emulate an MPSoC design and extract CPU signals during the emulation. At the end of the emulation, the traces generated are post-processed by Codelink to rebuild the whole software application execution, and allows users to re-play the execution step-by-step, exposing CPU registers and the function call stack. This tool is powerful and some of the analyses performed with our tool could be done with it. However, unlike Codelink, our tool can monitor for hardware platform weaknesses (contention, etc.), and correlates information extracted from several CPUs (cores) as detailed later in this article.
This last point is also the feature missing from the FirePerf profiling tool [17]. FirePerf is de-signed to profile end-to-end system behavior, including CPU execution flow traces and hardware performance. It benefits from the FPGA-accelerated hardware simulation platform, FireSim [16]. However, this proposal has an important limitation: its profiling is restrained to a core indepen-dent perspective and does not handle the MPSoC as a whole. Indeed, watched events are associated with a physical core. Therefore, cross-core events, as well as process (or thread) migrations from a core to another, is not supported by this tool. Our work copes with this limitation, which also exists with the Codelink tool, by associating events directly to a process (or thread) and not any more core as explained in Section5.2.2. Moreover, the FirePerf profiling tool can only trace signals exposed by hardware blocks through debugging ports, while our solution enables the dumping of any hardware register of the targeted system.
Based on this review of the available options, no tool meets our expectations. We therefore decided to design our own tool.
4 TOOL CHAIN ARCHITECTURE
The tool chain designed is based on side-channel extraction. The tool benefits from emulation and combines the following valuable advantages: (1) a precise hardware definition, (2) fine-grained accurate data (timing, etc.), (3) monitoring of large software applications running on top of a Linux kernel, and (4) no distortion of software behavior.
The emulation platform consists of a set of FPGA devices configured with the target design RTL model. It substitutes behavior and interactions of this system.
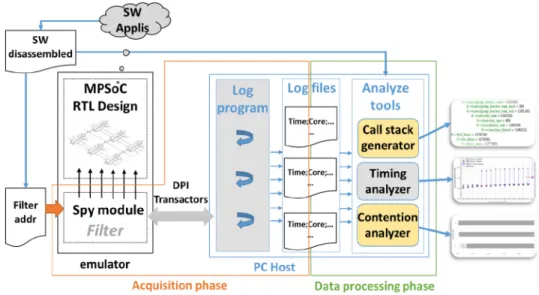
Our tool chain takes advantage of the co-emulation capability of emulators. This principle allows data to be exchanged between the emulation platform and a host computer during the emulation. The two main phases when using this tool are shown in Figure2: the (data) acquisition phase, highlighted by the orange box in the left of the figure; and the data processing phase, represented by the green box on the right.
4.1 Acquisition Phase
The acquisition phase consists in extracting signals and sending them to a host computer (the data processing part).
As a reminder, we want to run large software applications on top of the emulated platform. Consequently, the two following restrictions are raised: (1) it will be impossible to pick up all signals due to the huge amount of data to process; (2) data cannot be stored in a hardware buffer due to buffer size limitations allowing only a few milliseconds of run data to be stored. Moreover, sending data from the hardware side to the host computer is not cost-free since emulation is stalled throughout data transfer. Hence, we decided to add a filter layer before sending data to reduce the amount of data to be transferred.
The logged data reduction also makes this tool more scalable since the number of signals to log increases with the hardware platform size.
4.2 Data Processing Phase
Data processing is managed by a set of software applications designed to analyze the dumped data and to extract relevant information. In this article, we focus on three tools: call stack generator,
timing analyzer, and contention analyzer.
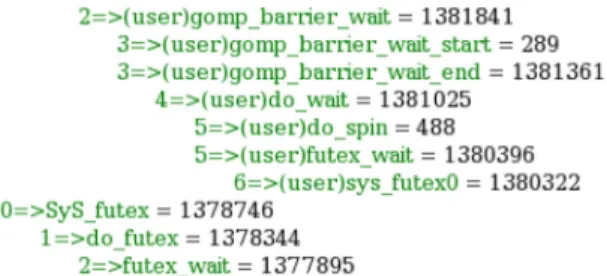
4.2.1 Call Stack Generator. This tool generates an accurate time-annotated stack of the
Fig. 1. Example of a timing-annotated call stack generated by our tool for one core.
This file lists all the functions (i.e., function labels) called during software execution, along with the time spent in each of them, as shown in Figure1.
The first number (to the left of the arrow) indicates the depth of the stack. To the right of the arrow, the function name is indicated. In front of some functions, the mention “(user)” indicates that the function is called from the (Linux) user-space. At the end of each line, the number of cycles spent in the function is indicated. Reported times are inclusive. Thus, a rank ‘n’ function delay is the sum of the rank ‘n+1’ function delays called, plus the body function instruction delays, which are not shown in this stack.
4.2.2 Timing Analyzer. This program correlates the dumped data to extract and determine the
average time spent in various sections of the mechanisms studied. The reduced data set extracted by this type of analysis can be used to average results over several application runs. In complex hardware/software systems, it is very important to study averaged values to discard pitfalls that could arise for multiple reasons (Hardware: cache miss, incorrect branch prediction, etc.; Software: task rescheduling, interruptions, etc.).
The main advantages of this tool compared to a call stack generator are: (1) the durations are averaged over multiple iterations, excluding odd measure samples; (2) the correlation is made through different threads running on top of different CPUs.
4.2.3 Contention Analyzer. Since software performance is affected by hardware platform
limi-tations, this tool provides information about contention (which is the major limitation) occurring on the MPSoC.
Hardware signals at critical components of the hardware support (e.g., memory controller, NoC router) are monitored. Then, the tool builds a load counter from this data (i.e., number of memory requests pending, etc.). Finally, it determines which hardware weaknesses deteriorate software performances from these performance counters.
5 TOOL CHAIN IMPLEMENTATION
The previous section sets out the overall architecture of the tool chain we designed. This section presents the implementation choices made to meet the challenges identified.
Figure2shows the diagram of the tool’s implementation. It presents the two phases of our tool chain: the acquisition phase and the data processing phase. The first is an online phase, whereas the second is performed offline. As shown in Figure2, log files are used to communicate between the two phases. The need to be aware of current and past events to properly compute latencies led to this implementation choice (i.e., to log data). Moreover, postponing data-processing and performing it offline helps to reduce the time spent in the software part during the emulation. Since the co-emulation engine requires the design emulation to be stalled when the software part
Fig. 2. Diagram of implementation of our non-intrusive tool chain measurement with MPSoC systems.
is running, it avoids adding an extended time overhead to the emulation execution. In addition, the same set of data can be used to run several processing tools without requiring emulation.
5.1 Acquisition Phase
On the emulator side, data is extracted from the platform using an additional module, the spy
mod-ule. This hardware module, written in System Verilog, is plugged into the initial MPSoC design and
runs alongside it on the emulator device. It picks up signals at various levels of the design hier-archy. Since the extracted signals depend on the target design, they must be defined during the tool’s configuration, as detailed hereafter. The values of the extracted signals are then wrapped in software objects sent to the host computer through transactors [26] by the Direct Program-ming Interface (DPI) SystemVerilog standard. In simple terms, transactors can be seen as C++ host software functions called by the emulation platform that passes data through function parameters (i.e., serialized objects). To be called by the emulator, a function must be declared as a DPI
trans-actor function. Function calls can then be executed directly in the SystemVerilog emulated device
description.
For example, the Program Counter values are extracted as follows:
(1) The hierarchical path to the Program Counter registered for each CPU is defined in the
spy module.
(2) For each clock cycle, the Program Counter value along with a clock cycle counter (times-tamp) are packaged into a software object. The clock cycle counter is implemented with a 64-bit hardware register. A software overflow check guarantees the full range of the 64-bits is available for all profiled durations.
(3) The spy module calls a software DPI transactor function designed to manage the object’s reception (and unpacking).
This is the initial principle. However, as mentioned in Section4.1, we added data filters to the spy
module to reduce the number of sends through DPI transactors. Thus, transactors are called only
when the signal values reach predefined conditions. A basic example of this could be to send the Program Counter value tagged with the clock cycle number only when its value has changed (i.e.,
no send occurs when the Program Counter is stalled). More complex filters are also implemented in this module so that data is only sent when specific instructions (e.g.,function call instructions) are executed by the CPU, or when the Program Counter reaches predefined addresses. An external file defines the trig condition variables: log beginning and ending addresses, list of addresses to trig on, and list of instructions to trig on. Since these conditional variables are specific to each software application, this external file is loaded by the spy module at start-up (through the DPI transactor). Consequently, the trig conditions can be modified without re-synthesizing the whole hardware platform. The signals are dumped, and the kind of filters to apply are selected according to the expected output. For example, to obtain the call stack of an application, the PC registers of CPUs and the registers containing the jump destination address have to be dumped, and the minimal filter configuration is to trig on jump/return instructions. For a contention analysis, we selected to dump the memory interfaces signals, and so on. Hence, sets of filters have been designed for each kind of analysis provided by our tool-chain. Users have just to choose the set corresponding to the expected output. It is worth noting that these filters guarantee to dump all data impacting the accuracy of the measurements while keeping the amount of the extracted data as reduced as possible to speed-up the global execution time.
On the host computer side, we designed a C++ software program to receive data extracted from the hardware platform, then to write them in files using the compact ASCII format (a binary ultra-compact standard has also been designed). In this article, we refer to this program as the log
program. Since the emulation is stalled as long as the DPI functions are running, the log program is
designed to quickly return the control to the emulation part. Thus, this program is multi-threaded to parallelize data reading from the DPI transactors. Since writing to the file can take a while, data is first buffered, and the file-writing operation is postponed to be performed later. We chose not to generate a file for each core, but rather a file for each type of data. This option facilitates data processing as one file is generated containing executed instructions, one for memory frames, and so on.
As a matter of fact, the acquisition chain is highly adjusted to the hardware design. This char-acteristic is essential to maintain a fast emulation over a long period of time. Indeed, Emulators like the Mentor Graphics Veloce offer the possibility to log all signals from the emulated design in a hardware buffer. Since this log is only performed by the hardware side, it only slows the emulation down slightly or not at all. However, this buffer has a limited size. Once it is full, either the old data is replaced by incoming data, or the full contents must be uploaded to the host computer. In the first case, emulation remains rapid, but only a short time-lapse (a few micro-seconds) can be dumped. Hence, this strategy is incompatible with the study of a whole complex software mech-anism. In the second case, the synchronization and the uploading of the hardware buffer to the host computer takes a very long time, during which the emulation is stalled. With this approach, the emulation becomes very slow and is no longer competitive. In addition, the log file generated is very large resulting in storage issues.
5.2 Data Processing Phase
The data processing phase consists in the off-line processing of the data extracted during the ac-quisition phase.
5.2.1 Call Stack Generator. This script builds the function call stacks for the software
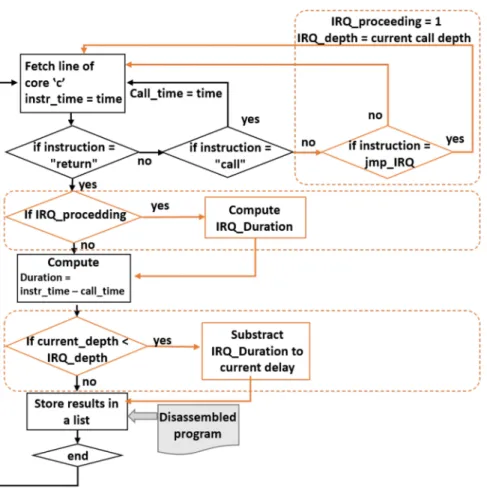
applica-tion by parsing log files and extracting the “jump” and “return” instrucapplica-tions. Then, it annotates this stack with the time spent on each function at clock cycle accuracy, since each event is tagged with its clock cycle by the acquisition engine. Figure3presents the block diagram for the algorithm implemented to build the function call stack. The black elements correspond to a simple linear use
Fig. 3. Algorithm to build the function call stack.
case (i.e., without interruptions); the orange blocks inside the dashed boxes handle interruption subroutines.
We will start with a simple use case description. The first step consists in fetching lines from the input log file, looking for event core ID fields matching the in-processing core ID. Once found, the timestamp for the event is stored and we move on to the next step, checking the instruction type. If the instruction is a “call,” the timestamp is tagged as call time, and we recall the main algorithm function in a recursive way. If the instruction is a “return,” we go to the next step to compute the function duration. The name of the function is then retrieved thanks to its address in the disassembled application file if available,1; otherwise, the call stack mentions the function ad-dresses. Next, the result is temporarily stored in a list. The list is then “inverted” to write the stack, in the output file of the core, according to the call order. The same algorithm is run for each core. This generation approach only works for linear calls. However, it does not take into account any jumps to the interruption subroutine (IRQ) which disrupt the nominal execution flow and can introduce errors into the call stack proceedings. The steps dedicated to managing IRQs are illustrated in orange in Figure3. (1) An additional test is performed before the recursive function loop. If the instruction is a jump to an IRQ subroutine, the current call is stored as an IRQ call,
1If applications’ source codes and executable files are available, the disassembled application file can be obtained just using
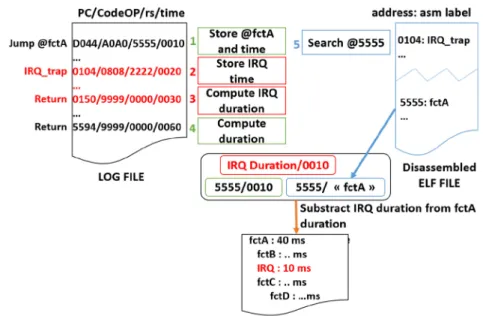
Fig. 4. Call stack generator working example.
and the depth of the call stack is saved when this IRQ occurs. (2) When a “return” instruction is found, the IRQ delay is computed in place of the function delay computation. (3) Then the delay due to the IRQ subroutine is subtracted from the duration of functions affected by it. Since these additional steps are part of the recursive call process, nested interrupts can be handled.
Figure4shows how the call stack generator works in practice. The input log file is represented in the top-left corner. This file contains the Program Counter value, the operational code of the executed instruction at this address, the register “rs” that contains the destination address of the “jump” operation, and finally the timestamp. The program’s pseudo-code has been written to the left of this file to facilitate comprehension. In the other corner, the disassembled program file is presented. This file associates memory addresses with the assembly language labels of each instruction. The box in the middle shows the states of the software memory variables. At the bottom, the output file generated is shown.
The first processing step is to fetch the “jump” instruction line, identified by its operational code (codeOP). The “rs” register contains the address of the destination function “fctA.” This address is stored with its associated timestamp. Subsequent lines are fetched from the log file until we find the address of the IRQ management subroutine. The timestamp of this instruction is then stored. The next lines are then fetched until the return instruction for the IRQ subroutine is encountered. The duration of the IRQ management is then computed and stored. The following lines of the log files are then fetched until we find the return instruction for the “fctA” function. The “fctA” address is sought in the disassembled file to retrieve its name. Then, the total time spent on the “fctA” is computed (50 in our example). However, since an IRQ occurred during the execution of the “fctA,” the duration of the IRQ is subtracted before writing the actual time spent on “fctA” in the output file.
5.2.2 Timing Analyzer. The main idea here is to store the timestamp for a predefined set of
instruction addresses, disregarding the CPU or the thread executing them. The set of addresses monitored is defined in the “addr filter” file. Then, the tool computes their durations, and it asso-ciates these durations with the threads performing the operation.
Hence, this tool requires information on the thread ID for threads running on each CPU. More-over, in some cases, we could be interested in identifying specific software variable access. To fulfill these two requirements, additional data must be dumped during the acquisitions phase. Even if, from a software point of view, it looks trivial to retrieve this information; it is not so easy to obtain it through the hardware platform.
Indeed, some processor cores do not expose the running thread IDs in accessible hardware regis-ters. This is the case for the MIPS core, taken as a reference here. To solve this issue, we found that threads can be identified using stack and heap pointers, which are different from one thread to an-other. Hence, a spy module extension can be used to dump the two registers storing these pointers. Software variables are more tricky to identify due to the use of virtual memory address spaces. A way to get real physical hardware addresses from virtual addresses could be to associate both addresses at the time of translation, capturing signals before and after the Memory Management
Unit. In fact, we did not implement this complex solution since our tool was initially devised for
synchronization mechanisms. Since synchronization mechanisms are based on specific atomic in-structions (i.e., lock), they can be identified by their operational code, then the lock address is re-trieved from the instruction destination register by analyzing the disassembled application code. Hence, we customized the spy module to dump both the instruction code register and the register storing the lock addresses.
5.2.3 Contention Analyzer. To quantify contention issues, we need to be aware of the state of
the memory request frames on their path to the memory. Hence, the spy module must be extended to dump signals related to communication wires linking the CPUs to the memories as illustrated hereafter in Figure8. Therefore, Network on Chip (NoC) data signals were monitored at different levels of the NoC: Memory Management Unit (MMU) outputs, NoC routers, memory controller inputs, and so on. Since the memory frame header contains a frame ID, a frame can be followed on its path. Thus, based on the log files, the contention analyzer can track a frame from a CPU to a memory, and the time spent in each section of this path can be extracted. Based on this information, we can identify components creating contention on the network.
6 APPLICATION TO SYNCHRONIZATION BARRIERS
This section presents an application case benefiting from the tool chain. We first present the test platform. Then, thanks to our tool chain, we study performance of the GNU OpenMP synchroniza-tion barrier and propose optimizasynchroniza-tions. We chose this mechanism among others since inter-process synchronization remains a slowdown source for highly parallel applications. Although this mech-anism is dependent on the application usages, it is a low-level kernel service requiring accurate and non-intrusive monitoring. Moreover, this mechanism is closely related to hardware support (NoC and memory), making it a privileged target for applying our software/hardware profiling tool capabilities. Hence, we take advantage of the tool chain’s capacity to run full benchmark ap-plications to validate our synchronization barrier optimizations. Finally, we discuss the use of the tool chain on other platforms.
6.1 Test Platform
6.1.1 TSAR Architecture. The TSAR many-core architecture was chosen for this study. TSAR
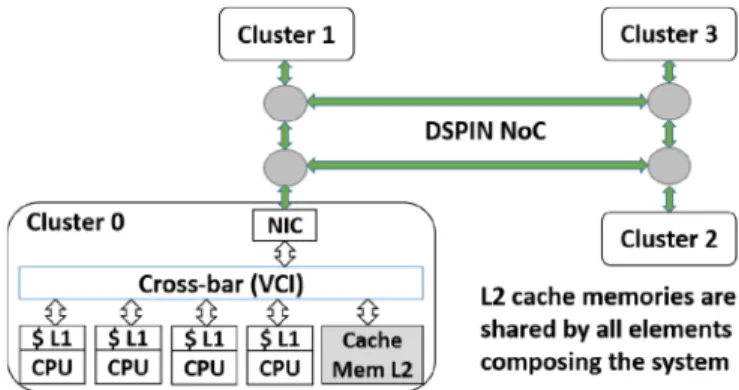
is a clustered manycore architecture based on Network-on-Chip, which makes it highly represen-tative of modern MPSoCs. As shown in Figure5, each cluster is mainly composed of four MIPS32 processors with their associated private L1 cache, and an L2 cache, which is also a shared memory segment. Each L2 memory is designed to cache part of the global memory, and the L2 cache for a cluster can be accessed by cores inside and outside the cluster.
Fig. 5. 4-cluster (16-core) TSAR MPSoC architecture.
Inside a cluster, all components are linked together by a crossbar implementing the Virtual Component Interface (VCI) protocol [14]. Each component integrates a VCI target interface, and master components integrate a VCI initiator interface. A fair scheduling strategy is implemented in the crossbar: if several initiator interfaces try to communicate with a single target interface, the same period of time is allocated to each initiator.
Communication between clusters relies on a DSPIN network-on-chip implementing a cut-through routing strategy with a 2D mesh topology. A Network Interface Controller (NIC) inside each cluster translates intra-cluster VCI requests into inter-cluster DSPIN requests, and vice-versa. Other networks-on-chip are also implemented on the TSAR system to handle exchanges related to the cache coherence protocol. However, here we have focused on explicit data path networks. (See Ref. [21] for more details on the TSAR platform.)
6.1.2 Measurement Environment. The emulated TSAR platform is composed of 64 cores
(16 clusters of 4 MIPS32). Since TSAR is a symmetrical platform, the number of cores (implemented in the MPSoC, and monitored by our tool) can easily be modified in a generic way.
As for the software aspect, we used a Linux kernel 4.6 port and the μClibc to boot the TSAR platform.
6.1.3 Benchmarks. Two kinds of benchmarks were used to evaluate the GNU OpenMP
synchro-nization barrier performances on our platform. (1) We first ran a micro-benchmark implementing the easiest OpenMP code: a slight computation inside an OpenMP parallel for loop. The OpenMP library then automatically adds (at compilation time) a synchronization barrier at the end of the loop. So we profiled the behavior of this barrier. The number of OpenMP threads was configured according to the number of cores available, hence, 64 threads for this application case. Moreover, to ensure the replicability of the observed behaviors, we run several times the whole OpenMP parallel section (3 times for the call stack generation and 400 times for the other measurements as detailed hereafter). (2) Then, in a second time, we ran a full application from the NAS Parallel Benchmark: Integer Sort. This application performs a sorting operation that is important in particle method codes. It tests both integer computation speed and communication performance [2]. Since the MP-SoC current state (initialization, I/O interrupts, and so on) can affect the application performances, we decided to average the measured results over five consecutive runs of the same application.
6.2 Measurement Tool Chain Application
We decided to study the performance of the synchronization barrier inserted by the OpenMP standard after each parallel code section. Due to its wide adoption and its open-source property, we choose the GNU implementation of the OpenMP library.
Fig. 6. Example of the tool configuration stages.
As a reminder, the basic principle of a synchronization barrier is: threads wait on the barrier until the last one reaches it. Then, all threads are released.
This waiting phase can be achieved for a thread: (1) either by doing a poll on a flag—this is usually called “active waiting”—(2) or by switching the thread to sleep mode until the release condition is met. This kind of waiting is usually referred to as “passive waiting.”
This article only presents the study of the “passive waiting” mode.
6.2.1 Analysis Road-map. The methodology to analyze performances of a software mechanism
using our tool chain is:
(1) Retrieve the input and the output addresses of the mechanism we want to study in the dis-assembled file(s). Here, the GNU OpenMP synchronization barrier.
(2) Analyze the full mechanism performances by tracing the function call stack using our tool chain.
To achieve this step, we must configure the “filter addr” file with the operational code for the “jump” (jal and jalr for the MIPS32) and “return” (jr for the MIPS32) assembly instructions. More-over, the mechanism’s “start” and “end” addresses must be written into the configuration file.
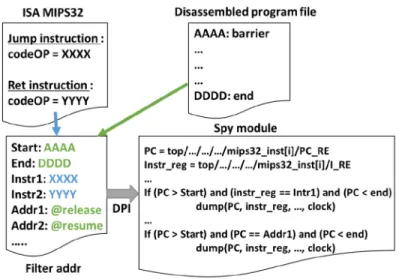
Figure6illustrates these configuration stages. Black elements are provided by the tool chain, whereas colored elements are user-defined. The operational instruction codes, required to create the function calls stack, are retrieved from the processor Instruction Set Architecture (ISA) and placed in the “filter addr” file. The start and the end points for the measurements are extracted from the disassembled program file, and written in the “filter addr” file. Regarding the disassembled program file, it is obtained from the binary file using the “objdump” utility of the GNU compilation tool-chain. This figure also displays a part of the spy module file. The two first lines create links to pick up the signals monitored in the target MPSoC design hierarchy. Then, some trigger conditions are visible. The first one trigs when the instruction currently being executed is one of those defined in the “filter addr” file. The second one trigs when the Program Counter reaches an address defined in the “filter addr” file.
Once the configuration is completed, we run the emulation platform with the evaluation soft-ware. After run completion, a log file containing extracted data is generated. The “call stack gen-erator” can be executed on it to produce output files: one file for each CPU.
An analysis of the results obtained for the mechanism studied here is presented in Section6.2.2. (3) The third step is the accurate study of the mechanism. It is useful to study cross-CPU events or to ensure the reproducibility of a defect identified during the second phase. In our case, we needed it to measure the thread release duration, which is a cross-CPU phenomenon. This duration corresponds to the delay between the start of the release process—when the last thread reaches the barrier—and the return to nominal execution of each thread. This is a key value to assess synchronization barrier performances.
The spy module is already designed to trig on specific addresses defined in the configuration file. In our case, we have to trig on the release phase start address, which is the address of the function performing the wake-up process, and to trig on the exit of the barrier function.
This new minimal configuration makes it possible to execute applications faster than the pre-vious one, since data is sent only for a few addresses. Therefore, applications can be run several times to determine average results. Hence, we ran the emulation platform another time with this fast trig configuration. Then, we ran the timing analyzer, taking the log file as input, and producing a timing report. Section6.2.3presents the results obtained for our case.
(4) We can add a fourth step, if necessary, with the study of the potential hardware contention issues occurring while the mechanism is running.
First of all, we have to define the Region Of Interest (ROI) we want to monitor. In our case, we chose to monitor the memory access behavior during the synchronization barrier release phase. Thus, we identified the start address and the end address for the ROI in the disassembled software application file. Then, we configured the “filter addr” file with both these addresses (ROI start and ROI end). The tool is designed to perform contention data extraction inside the given ROI. Once the configuration was completed, we ran the emulation platform to produce the log files. Then, we ran the contention analyzer to generate a memory access behavior report. A contention analysis for our case is presented in Section6.3.
6.2.2 Analysis of the Time Annotated Function Call Stack. Since the function call stack is a means
to obtain an overview of the time spent in each function for the mechanism studied, we configured our tool chain (“filter addr” configuration file) to start the log upon entry into the GNU OpenMP barrier mechanism, and to finish when this function completes. To prevent analysis of odd work-flows, we ran the barrier mechanisms three times. The call stack tool does not average the delays computed over executions, but we can manually check the result reproducibility over the three runs.
The log file produced during the “acquisition phase” was about 1,500,000 lines long. The function call stack script then processed this file to generate files containing call trees.
Upon analyzing the function call stack generated for the release process of the passive wait mode of the OpenMP synchronization barrier, we noticed an unexpected work-flow. The same function, sending Inter-Processor Interruption (IPI), was called as many times as there were cores in the system. In fact, these IPIs are required to reschedule the formerly sleeping task on the destination IPI core.
Thus, we propose to optimize this process by regrouping all the IPI requests into a single list, and then to send them all in a single function call.
6.2.3 Analysis of the Timing Analyzer Results. Once we had detected a defect in the awakening
process implementation, we wanted to accurately measure the thread release durations in order to evaluate the optimization proposal.
We first configured the “filter addr” file to trig only when the awakening process starts and when threads resume their nominal execution (exit of the barrier). Thanks to this reduced amount
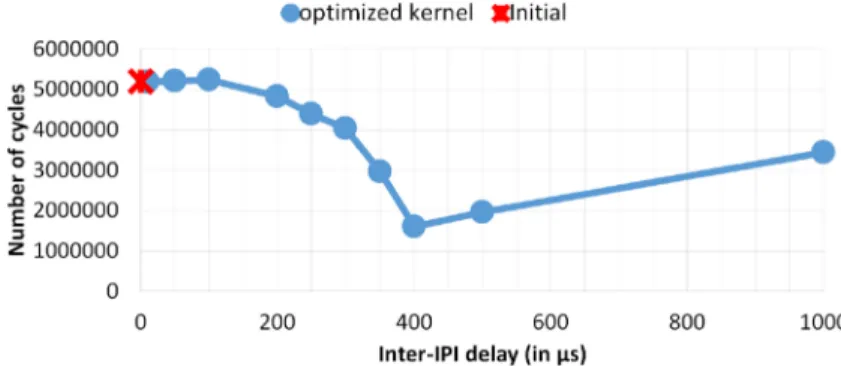
Fig. 7. Full release time for 64 threads according to the delay introduced between two sends of IPI.
of dumped data, we were able to run the OpenMP synchronization barrier mechanism 400 times, and thus eliminate odd values.
With the timing analyzer, we evaluated the release duration for 64-threads mapped to 64 cores with and without the optimization.
Against all expectations, no significant gain was noticeable with the optimized process—the “op-timized” release lasted about 5,185,900 cycles for 64 threads compared to approximately 5,196,200 cycles without optimization.
In fact, with the optimized version, all threads resume their execution at the same time. There-fore, they are trying to simultaneously access the memory (probably to load the remaining shared kernel code), resulting in memory contention issues. To avoid these issues, we decided to intro-duce slight delay between two IPI sends, inducing time shifting in the awakening processes for the different threads. This shift should reduce the contention issue.
To observe the impact of inter-IPI delay, we ran the loop of 400 OpenMP synchronization bar-riers with several inter-IPI delays, and measured the release duration for the 64 threads. Figure7
presents the median release durations obtained for the 64 threads as a function of the inter-IPI delay.
The X-axis represents the delay inserted between sending consecutive IPI (in microseconds). The Y-axis is the number of cycles spent in the release phase, i.e., the number of cycles between the start of the awakening process since the last thread arrived at the barrier and the last thread to resume its nominal execution. These results confirmed our assumption: the release phase duration starts to decrease as the inter-IPI delay increases. The cycle number reaches a minimum at a delay of 400μs as a result of the reduction of contention issues. Above 400μs, the time spent in the release phase increases since the inter-IPI delays start to exceed the gain achieved by reducing contention issues.
These results also show that, at the optimal point (delay of 400μs), the release phase lasts approx-imately 1,681,200 cycles, which represents a considerable gain (∼67%) compared to the 5,196,200 cycles required for the non-optimized kernel version.
6.3 Hardware Contention Analysis
We decided to continue the study of this synchronization barrier by monitoring the hardware support’s behavior during execution of this mechanism.
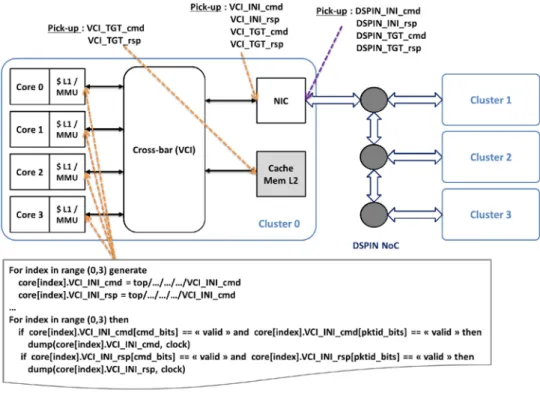
To do so, we dumped signals relating to memory access during the barrier awakening process. Figure 8 illustrates the signals dumping principle for one cluster. Signals of the VCI initiator interface (INI) of each core are dumped after the L1 cache/MMU module. A sample of the spy
Fig. 8. Illustration of signals dumping for contention analysis.
the in-going signal (VCI_INI_rsp) are first picked-up for each core. Then, when the transaction is valid, the frame is sent along with the current clock cycle to the host PC. Signals of the VCI target interface (TGT) of the shared L2 cache memory are also dumped, monitoring all requests received by this IP. As for the NIC, since this module is initiator and target on the VCI cluster cross-bar, both interfaces are dumped as illustrated in this figure. In addition to that, signals of the DSPIN initiator and target NIC interfaces are also dumped. In the interests of clarity, details of the DSPIN dumping are not shown. Indeed, DSPIN frames can be made of several flits. Specific frame bits identify the first flit and the last flit. Hence, the trigger condition of the spy module must take them into account to dump full coherent frames. Symmetrically, the same signals are dumped for the other clusters. In this way, latency of memory requests can be evaluated, and potential stalls highlighted.
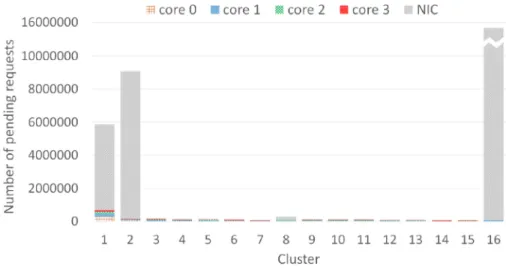
Figure9was generated from results produced by the contention analyzer. It shows the number of requests pending on the crossbars of the 16 clusters making up our 64-core platform. The X-axis represents the cluster identifier. The Y-axis is the number of requests generated during synchro-nization barrier releases.
Interestingly, three clusters (1, 2, and 16) are considerably more contended than the others. Since the TSAR architecture is symmetric, we can conclude from these results that the L2 memory for these three clusters is considerably more in demand than others. From this observation, we deduce that the Linux memory allocation policy does not spread data evenly across all the L2 memories since a few memory banks contain most of the data accessed during the awakening phase. Moreover, this phenomenon occurs despite setting the “replication of the kernel code” Linux option. Hence, another way to reduce contention issues could be to modify the Linux memory allocator and to spread the data more evenly across the memories of all clusters. Indeed, Garibotti
Fig. 9. Pending requests for each cluster on the 64-core platform.
Fig. 10. Full release time of 64 threads according to the delay introduced between two send of IPI with the modification of the crossbar priority.
et al. [9] studied several memory allocation policies on MPSoC and revealed large performance disparities depending on the selected policy.
Figure9also shows the distribution of the pending requests for the different crossbar initiators. This figure reveals that the large majority of pending requests are from the NIC. These results reflect a poor crossbar arbiter policy. With the current round robin policy, all distant cores (going through the NIC) get the same bandwidth as a local core. Hence, to optimize this component, increasing the number of time slices granted to external requests (NIC-initiated) should reduce contention issues at this level, and thus shorten the release phase duration.
In line with this observation, we modified the crossbar arbiter policy by granting four time slices to external requests (NIC-initiated), while internal core initiators were still granted one time slice. Then, on the platform with the modified RTL model, we ran again the loop of 400 OpenMP synchronization barriers with different inter-IPI delays and measured the release duration of the 64 threads. Figure10presents the results obtained with the crossbar priority improvement (orange plot).
When inter-IPI delays are short (i.e., when contention is high), this figure reveals a gain of almost 30% with the new crossbar policy. Since the number of pending requests stalled in the
Table 2. IS Nas Parallel Benchmark with and without Barrier Optimization (64 cores)
Application Non-optimized Optimized kernel Gain IS (class S) 2, 110× 106cycles 1, 924× 106cycles 8.8%
crossbar decreases as the contention is reduced, the results obtained with and without the crossbar improvement are the same for lower contentions. Nevertheless, we note that this optimization does not reduce contention enough to further reduce the optimal working point. As a matter of fact, most of the contention results from the poor L2 cache performances, preventing processing of requests as fast as required. Even if we reduced a contention bottleneck thanks to the change of the crossbar priority, only the improvement of the L2 cache significantly reduced contention issues on our platform, leading to extensive behavior changes.
Nevertheless, this use-case emphasizes the importance of combining hardware and software aspects when analyzing performance.
6.4 Running Large Applications
To quantify the gain provided by the proposed software optimization on a true benchmark appli-cation, we ran the Integer Sort application of the NAS Parallel benchmark with the Small dataset (Class S) [2]. To eliminate all artefacts resulting from the operating system (interruption, cache misses, etc.), we ran this application five times with and without the optimization, and then av-eraged results over these runs. This averaging was made possible by the high speed of our mea-surement chain, which allowed us to run the same applications several times within a reasonable time. Execution of the full IS application (with the Small dataset) took only 1 h for the 64-thread platform.
Table2presents the results obtained with the “timing analyzer” for the non-optimized initial version and for the kernel-optimized version with the optimized inter-IPI delay (400 μs). We note a substantial gain thanks to the reduced memory contention as a result of the proposed optimization. Notice that the 400us inter-IPI delay is probably not the optimal inter-delay for this application due to other application specific traffic. Our goal here is not to find the optimal delay for each operating point of an application since the optimal delay can change during an application according to the context of the barrier call. Rather, we found 400us inter-IPI delay is an interesting optimized configuration for 64 cores, and we evaluated the global time reduction on a full application.
6.5 Adjusting the Tool Chain to Other Hardware Platforms or Applications
To use our tool chain with other hardware platforms required some adjustments of the “acquisi-tion phase.” For the “data processing phase,” no modifica“acquisi-tion is required since it does not interact directly with the hardware but just takes log files produced by the “acquisition phase” as input.
6.5.1 A New MPSoC Design. As a reminder, the spy module extracts signals from the MPSoC
design and sends them to the host computer. Thus, this module is closely related to the MPSoC design, since register paths (e.g., the Program Counter register) depend on the design hierarchy and on the hardware blocks implemented (the CPU core). What may appear at first sight as a burden of complexity, in fact provides flexibility. Indeed, the spy module upgrade is enough to be able to use the tool-chain on a wide range of hardware platforms, including heterogeneous systems. In summary, if the design changes, the tool chain users must update the paths of snooped signals in the spy module in line with the new MPSoC design. Hence, some knowledge of the hardware platform is required.
6.5.2 Another Emulator. The tool chain is designed to be as independent as possible of the
emulator manufacturer. Data is extracted by the SystemVerilog spy module, leveraging the DPI facilities. We assume most of the emulators available on the market can handle the co-emulation with classical DPI standards. In this case, no specific modification is needed to deploy our tool chain on other emulator platforms. Unfortunately, we could not perform this experimentation. As mentioned previously, emulation platforms are very expensive, so we did not have the opportunity to access emulators from other manufacturers.
6.5.3 Another Low-level Mechanism. In this article, we used the designed tool chain to study
the synchronization barrier. However, we can profile other mechanisms. To do so, users have only to update the “filter addr” file with the addresses of the new ROI and eventually the addresses of the cross-CPU events to watch.
Hence, a large number of mechanisms, strongly dependent on the HW support, could benefit from the accurate HW/SW profiling provided by our tool. We can, therefore, consider the optimiza-tion of a large panel of operating system services: the network interface stack, other inter-process communication mechanisms, and so on.
Moreover, this tool enables the accurate study of the memory access pattern, or the network-on-chip usage, of applications or services. Thus, this valuable piece of information opens new optimization perspectives, for example, the improvement of the synchronization lock service based on the lock access patterns[8].
7 CONCLUSION
This article presents a methodology based on a new measurement tool chain to achieve a full and accurate HW/SW performance analysis. We propose a non-intrusive tool chain based on emula-tion, which can perform fine-grained accurate measurements while running large software appli-cations. This tool chain works in two steps, an acquisition phase and a processing phase, to extract, by a side channel, system information (timing, contention, etc.) during the execution of a software application.
We leveraged the strengths of this measurement chain on the GNU OpenMP barrier synchro-nization mechanism to illustrate the use of the tool chain through a practical case. The accurate fine-grained study allowed us to propose improvements to the Linux kernel. Based on the study of the awakening process of the synchronization barrier mechanism, we propose a kernel opti-mization that provides a gain of∼67% in the duration of this process for 64 threads. Thanks to our tool, we were also able to detect some hardware platform issues and to propose improvement opportunities.
In conclusion, this application case emphasizes the fact that obtaining accurate fine-grained information on the software’s behavior on the targeted platform is essential to co-design efficient systems. The proposed tool chain provides access to this type of information, opening the way to the optimization of challenging MPSoC software mechanisms.
In the future, we plan to work on generalizing this tool chain to facilitate its configuration with different kinds of hardware platforms, and to make it more user-friendly.
REFERENCES
[1] M. AbdElSalam and A. Salem. 2015. SoC verification platforms using HW emulation and co-modeling Testbench technologies. In Proceedings of the 2015 10th International Design Test Symposium (IDT). 14–19.
[2] D. H. Bailey, E. Barszcz, J. T. Barton, D. S. Browning, R. L. Carter, L. Dagum, R. A. Fatoohi, P. O. Frederickson, T. A. Lasinski, R. S. Schreiber, and et al.1991. The Nas parallel benchmarks. Int. J. High Perform. Comput. Appl. 5, 3 (Sept. 1991), 63–73.
[3] S. Banerjee and T. Gupta. 2012. Fast and scalable hybrid functional verification and debug with dynamically re-configurable co-simulation. In Proceedings of the 2012 IEEE/ACM International Conference on Computer-Aided Design
(ICCAD). 115–122.
[4] Nathan Binkert, Bradford Beckmann, Gabriel Black, Steven K. Reinhardt, Ali Saidi, Arkaprava Basu, Joel Hestness, Derek R. Hower, Tushar Krishna, Somayeh Sardashti, and et al. 2011. The Gem5 simulator. SIGARCH Comput. Archit.
News 39, 2 (Aug. 2011), 1–7.
[5] R. Buchmann and A. Greiner. 2007. A fully static scheduling approach for fast cycle accurate systemC simulation of MPSoCs. In Proceedings of the 2007 Internatonal Conference on Microelectronics. 101–104.
[6] Anastasiia Butko, Florent Bruguier, Abdoulaye Gamatié, Gilles Sassatelli, David Novo, Lionel Torres, and Michel Robert. 2016. Full-system simulation of big.LITTLE multicore architecture for performance and energy exploration. In Proceedings of the 2016 IEEE 10th International Symposium on Embedded Multicore/Many-core Systems-on-Chip
(MC-SOC). 201–208.
[7] Cadence. Cadence Emulation Platform. Retrieved from https://www.cadence.com/en_US/home/tools/system-design-and-verification/acceleration-and-emulation/palladium-z1.html.
[8] M. France-Pillois, J. Martin, and F. Rousseau. 2020. Implementation and evaluation of a hardware decentralized syn-chronization lock for MPSoCs. In Proceedings of the 2020 IEEE International Parallel and Distributed Processing
Sym-posium (IPDPS). 1112–1121.
[9] R. Garibotti, L. Ost, A. Butko, R. Reis, A. Gamatié, and G. Sassatelli. 2019. Exploiting memory allocations in clusterised many-core architectures. IET Computers Digital Techniques 13, 4 (2019), 302–311.
[10] Marius Gligor, Nicolas Fournel, and Frédéric Pétrot. 2009. Using binary translation in event driven simulation for fast and flexible MPSoC simulation. In Proceedings of the 7th IEEE/ACM International Conference on Hardware/Software
Codesign and System Synthesis (CODES+ISSS’09). 71–80.
[11] S. Gopikrishna, M. Jha, S. Sreekanth, and G. Savithri. 2016. A multiprocessor system on chip verification on hard-ware accelerator and Softhard-ware Emulation. In Proceedings of the 2016 IEEE International Conference on Advances in
Electronics, Communication and Computer Technology (ICAECCT). 423–428.
[12] Mentor Graphics. Codelink. Retrieved fromhttps://www.mentor.com/products/fv/codelink/.
[13] Mentor Graphics. Veloce Emulation Platform. Retrieved from https://www.mentor.com/products/fv/emulation-systems/.
[14] On-Chip Bus Development Working Group. 2001. VSI Alliance Virtual Component Interface Standard Version 2 (OCB 2 2.0). Retrieved fromhttp://home.mit.bme.hu/ feher/MSC_RA/VCI/VCI.pdf.
[15] A. Gutierrez, J. Pusdesris, R. G. Dreslinski, T. Mudge, C. Sudanthi, C. D. Emmons, M. Hayenga, and N. Paver. 2014. Sources of error in full-system simulation. In Proceedings of the 2014 IEEE International Symposium on Performance
Analysis of Systems and Software (ISPASS). 13–22.
[16] Sagar Karandikar, Howard Mao, Donggyu Kim, David Biancolin, Alon Amid, Dayeol Lee, Nathan Pemberton, Emmanuel Amaro, Colin Schmidt, Aditya Chopra, Qijing Huang, Kyle Kovacs, Borivoje Nikolic, Randy Katz, Jonathan Bachrach, and Krste Asanović. 2018. FireSim: FPGA-accelerated cycle-exact scale-out system simulation in the public cloud. In Proceedings of the 45th Annual International Symposium on Computer Architecture (ISCA’18). 29–42. [17] Sagar Karandikar, Albert Ou, Alon Amid, Howard Mao, Randy Katz, Borivoje Nikoliundefined, and Krste Asanović.
2020. FirePerf: FPGA-accelerated full-system hardware/software performance profiling and co-design. In
Proceed-ings of the 25th International Conference on Architectural Support for Programming Languages and Operating Systems (ASPLOS’20). 715–731.
[18] Andreas Kurth, Alessandro Capotondi, Pirmin Vogel, Luca Benini, and Andrea Marongiu. 2018. HERO: An open-source research platform for HW/SW exploration of heterogeneous manycore systems. In Proceedings of the 2nd
Workshop on AutotuniNg and ADaptivity AppRoaches for Energy Efficient HPC Systems (ANDARE’18). ACM, New York,
NY, Article 5, 6 pages.
[19] Rainer Leupers, Lieven Eeckhout, Grant Martin, Frank Schirrmeister, Nigel Topham, and Xiaotao Chen. 2011. Virtual Manycore platforms: Moving towards 100+ processor cores. In Proceedings of the 2011 Design, Automation and Test in
Europe Conference & Exhibition (DATE). 1–6.
[20] R. Leupers, Frank Schirrmeister, Grant Martin, Tim Kogel, Roman Plyaskin, Andreas Herkersdorf, and M. Vaupel. 2012. Virtual platforms: Breaking new grounds. In Proceedings of the 2012 Design, Automation and Test in Europe
Conference & Exhibition (DATE). IEEE, Dresden, 685–690.
[21] Lip6. InterconnexionNetworks TSAR. Retrieved from https://www-soc.lip6.fr/trac/tsar/wiki/Interconnexion Networks.
[22] Y. Nakamura. 2006. Software verification for system on a chip using a C/C++ simulator and FPGA emulator. In
Proceedings of the 2006 International Symposium on VLSI Design, Automation and Test (VLSI-DAT’06).
[23] N. Ohba and K. Takano. 2004. An SoC design methodology using FPGAs and embedded microprocessors. In
[24] E. Saboori and S. Abdi. 2016. Fast and cycle-accurate simulation of multi-threaded applications on SMP architectures using hybrid prototyping. In Proceedings of the 2016 International Conference on Hardware/Software Codesign and
System Synthesis (CODES+ISSS). 1–10.
[25] Synopsys. Synopsys Emulation Platform. Retrieved fromhttps://www.synopsys.com/verification/emulation.html. [26] Lawrence Vivolo. 2013. Transaction-based Verification and Emulation Combine for Multi-megahertz Verification
Performance. Retrieved from http://www.electronicdesign.com/eda/transaction-based-verification-and-emulation-combine-multi-megahertz-verification-performance.
[27] Zan Yang, Byeong Min, and Gwan Choi. 2000. Si-emulation: System verification using simulation and emulation. In
Proceedings of the 2000 IEEE International Test Conference (ITC’00). IEEE Computer Society, 160.
[28] Chengyu Zheng, M. D. Preda, J. Granjal, S. Zanero, and F. Maggi. 2016. On-chip system call tracing: A feasibility study and open prototype. In Proceedings of the 2016 IEEE Conference on Communications and Network Security (CNS). 73–81.