READ THESE TERMS AND CONDITIONS CAREFULLY BEFORE USING THIS WEBSITE. https://nrc-publications.canada.ca/eng/copyright
Vous avez des questions? Nous pouvons vous aider. Pour communiquer directement avec un auteur, consultez la première page de la revue dans laquelle son article a été publié afin de trouver ses coordonnées. Si vous n’arrivez pas à les repérer, communiquez avec nous à PublicationsArchive-ArchivesPublications@nrc-cnrc.gc.ca.
Questions? Contact the NRC Publications Archive team at
PublicationsArchive-ArchivesPublications@nrc-cnrc.gc.ca. If you wish to email the authors directly, please see the first page of the publication for their contact information.
NRC Publications Archive
Archives des publications du CNRC
This publication could be one of several versions: author’s original, accepted manuscript or the publisher’s version. / La version de cette publication peut être l’une des suivantes : la version prépublication de l’auteur, la version acceptée du manuscrit ou la version de l’éditeur.
Access and use of this website and the material on it are subject to the Terms and Conditions set forth at
Study of in-situ test methods in deltaic silt/ Etude des mé thodes
d'essai in-situ dans un limon deltaique
Konrad, J. M.; Bozozuk, M.; Law, K. T.
https://publications-cnrc.canada.ca/fra/droits
L’accès à ce site Web et l’utilisation de son contenu sont assujettis aux conditions présentées dans le site
LISEZ CES CONDITIONS ATTENTIVEMENT AVANT D’UTILISER CE SITE WEB.
NRC Publications Record / Notice d'Archives des publications de CNRC:
https://nrc-publications.canada.ca/eng/view/object/?id=70116b44-db0e-41dd-a323-fd6d8495f37e
https://publications-cnrc.canada.ca/fra/voir/objet/?id=70116b44-db0e-41dd-a323-fd6d8495f37e
ANALYZED
.-
I
Ser
/ y 5 3 /
TH1
National Research
Conseil national
N21d
I*
Council Canada
da recherches Canada
I
no.
1325
C.
2
,
Institute for
lnstitut de
BLDG
IResearch in
recherche en
- --
Construction
construction
Study
of in-Situ Test Methods
in Deltaic Silt
by
J.-M Konrad, M. Bozozuk and K.T. Law
Reprinted from
Xlth International Conference on Soil Mechanics
and Foundation Engineering
San Francisco, CA, 12-16 August 1985
Proceedings, Vol. 2.
p.
879-886
(IRC Paper No. 1325)
Price $2.00
NRCC 25042
N R C-
ClSTlBLDG.
RES.
L l 8 R A R Y
I86-
07-
3
B I B L I O T H ~ Q U E
)
Rsch.
Bbtim.
i. CNRC-
IC.ISTOn a mend dans un limon argileux deltafque de faible
plasticitg, sous
15 m de sable, un programme complet d'essai
sur place faisant appel
2
un scissom8tre,
3
un pdngtrometre
3
cane glectrique muni d'un manchon de frottement et d'une pointe
pi8zomgtrique,
2 un dilatometre et 2 un pressiomstre
autoforeur.
Les rgsistances du sol mesurges au pressiometre
6taient de
62
%
supgrieures aux rgsistances mesurdes au
scissom&tre qui elles-mdmes gtaient supgrieures aux rgsistances
mesurges au dilatometre. Les contraintes horizontales mesurges
au pressiometre ont donng un coefficient KO moyen de
0,56.
Elles ont aussi permis de mesurer l'indice de rigidit6 servant
5
l'6tude des rgsultats des essais au p6ngtrornGtre
pigzom6trique.
La prgsente dtude montre que les corrglations empiriques
6tablies pour des sols argileux ne sont pas directement
applicables au limon arnileux.
Les effets de la vitesse de
pGn6tration sont
I-
observe
Study of in-situ test methods in deltaic silt
Etude des methods d'essai in-situ dans un limon deltdique
J.-M. KONRAD, Research Officer, Division of Building Research, National Research Council Canada, Ottawa, Canada
M. BOZOZUK, Research Officer, Division of Building Research, National Research Council Canada, Ottawa, Canada K. T. LAW, Research Officer, Division of Building Research, National Research Council Canada, Ottawa, Canada
SYNOPSIS A comprehensive in-situ testing program using a field vane, electric cone
penetrometer with friction sleeve and piezometer tip, dilatometer and a self-boring pressuremeter, was carried out in deltaic clayey silt of low plasticity, below 15 m of sand. Soil strengths measured with the pressuremeter were 62% more than the vane shear strengths which in turn were greater than those measured with the dilatometer. In-si,tu horizontal stresses measured with the pressuremeter provided an average KO = 0.56. It also provided a measure of the rigidity index used to study the piezocone test results.
The present study revealed that empirical correlations developed for clay soils were not directly applicable to the clayey silt formation. Rate effect during cone penetration differed also from that generally observed in clays.
INTRODUCTION
The design and construction of safe, economical oil and gas exploration and production
structures for developing Canada's offshore energy resources require the measurement of engineering properties of the foundation
material. Various in situ tests that have been performed in the marine soils of the Beaufort Sea were repeated in similar fine-grained deltaic soil deposits at the mouth of the Fraser River in Vancouver. The test equipment consisted of an electric cone with a friction sleeve and a piezometer tip (piezocone), a flat plate dilatometer, a field vane and a Cambridge self-boring pressuremeter. The paper discusses the results of the test program related to the clayey silt deposits underlying 15 m of fine sands.
DESCRIPTION OF SITE AND SOIL CONDITIONS
The selected test area was at the northern tip of Sea Island, located at the mouth of the north arm of the Fraser River in Vancouver. The island is about 5.6 km from east to west, 4.1 km from north to south and is the site of the Vancouver International Airport. The subsoils are deltaic sands overlying silts, extending to more than 100 m deep. The ground surface is very flat with an elevation of +1.6 m and is protected from flooding by dykes. The depth of the groundwater table was about 1 m, and it fluctuated daily about 1 m due to the effect of ocean tides. Piezometric measurements showed that the pore water pressures were hydrostatic with depth.
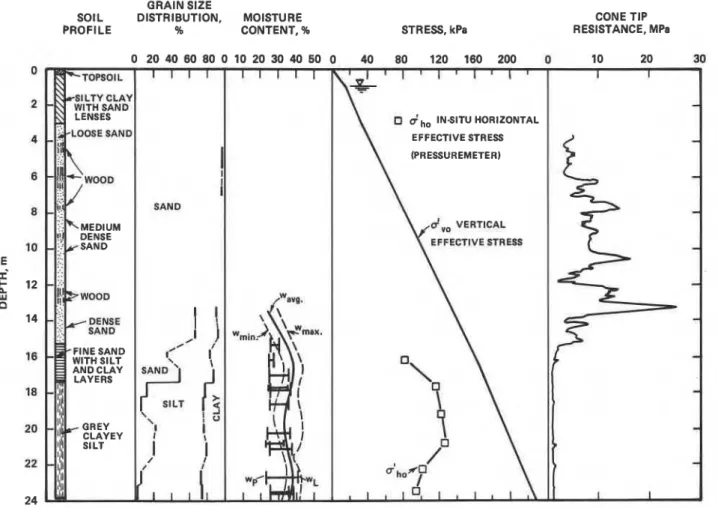
The soil profile is made up of 0.3 m of organic topsoil underlain by silty clay and fine sand
to a depth of 3 m. Between this depth and 15.3 m are loose to dense deltaic sands ranging in grain size from medium to coarse containing about 4% silt. Typical of most deltaic
deposits, numerous thin deposits of wood, some beach pebbles and occasional marine shells were
found. This was followed by 2 m of grey fine silty sand overlying the deep deposit of layered grey silt and clay. The variations in the soil profile were reflected in the cone penetrometer test results (Figure 1).
The soil formation from 15.3 to 17.4 m was fine sand with silt and clay layers. A composite grain size analysis indicated about 60% sand, 30% silt and 10% clay sizes. The plasticity index varied from 5 to 10 and the natural water content of 38% exceeded the liquid limits by about 10-15%.
Soil tests on samples obtained from 17.3 to 24 m indicated about 10% sand, 70% silt and 20% clay sizes. The liquid limits averaged 35%, slightly less than the average water content of 36%. The plasticity index of 10% is typical of cohesionless fine grained soils. The
sensitivity was 5 using the field vane and 3 using the Swedish Laboratory cone. These results indicate the soil is an inorganic clayey silt of low plasticity.
The saturated density determined from Shelby tube samples and from G, e and w relations was 18.8 k ~ / m ~ for the clayey silt below 15 m,
20 k ~ / m ~ for the overlying sand and 18.4 k ~ / m ~ for the silty clay above the 3 m depth.
The geological history of these deltaic soils indicates that the deposit should be normally consolidated (Campanella et al, 1981). Valid consolidation tests could not be performed because the Shelby tube samples were badly
GRAIN SIZE
SOIL DISTRIBUTION, MOISTURE
PROFILE % CONTENT, % STRESS, kPa
CONE TIP RESISTANCE, MPa
Figure 1. Soil profile, grain size distribution, soil classification, effective stress and cone penetration profile.
disturbed. Triaxial undrained strength tests on specimens isotropically consolidated to 0.8 abo gave an average 4 ' of 36.5'.
TEST RESULTS
Field Vane and Pressuremeter Tests
(a) Soil strengths measured in situ and in the laboratory include the Cambridge
self-boring pressuremeter, the NGI field vane, triaxial CIU and Swedish cone tests (Figure 2). Vane sizes of 110 mm x 55 mm and 86 mm x 43 mm were used at V-1 and V-2, respectively. Both vane profiles, although 9 m apart, were in good agreement except at 24 m depth where a hard layer was encountered at V-2. The vane strengths (Suv) were about equal t o the CIU values and considerably greater than those obtained with the Swedish cone on Shelby tube soil samples. Both vane profiles indicate a slight strength increase with depth, a mean S
uv of 74.5 kPa and an average Suv/a;o of 0.33.
The pressuremeter strength (S ) was determined UP
by the method proposed by Ladanyi (1972) which assumes soil homogeneity around the pressuremeter probe but does not require prior assumption of a stress-strain model. S was
UP about 62% greater than Suv (Figure 2). A summary of the results of six pressuremeter tests is given in Table I.
Table I. Summary of Pressuremeter Test Results
Test Depth aho G S
UP IR
STRENGTH, kPa
-
-
-
-
-
22-
23-
-
-.-VANE HOLE NO. 1 IdlOx55rnm)
-
-4- VANE HOLE NO. 2
(86 x 43 mm)
-
-0- PRESSUREMETER A TRlAXlAL ClU TESTS
SWEDISH CONE, NATURALAND
-
REMOULOED I 1 I IFigure 2. Comparison of soil strengths obtained with the NGI vane, pressuremeter, triaxial CIU and Swedish cone in the clayey silt formation.
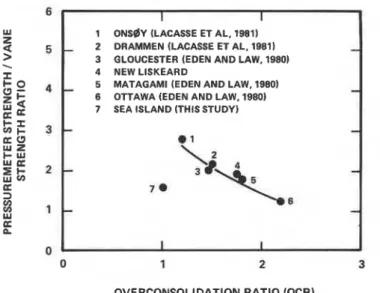
The fact that the pressuremeter measures a higher strength than the field vane has been well documented (Baguelin et al, 1972; Eden and Law, 1980; Lacasse et al, 1981). The
relationship between S U D / ~ U v and the overconsolidation ratio- (OCR) is shown in Figure 3 for a number of clays with plasticity indices between 25% and 40%. Although there appears to be a correlation between the strength ratio and the OCR, the data for Sea Island clayey silt (In = 10%) does not fall
r
into this relationship.
In clay soils. the trend of decreasing S
U J S U V
with increasing OCR is reasonable. ~atural soils at high OCR are commonly fissured and under high in situ horizontal stress. The vane measures high intact strengths in spite of fissures, and the higher in situ horizontal stresses also lead to higher vane strengths. This was demonstrated from a slope stability analysis of a natural slope involving clay soils with OCR = 3.8 where the vane measured a much higher strength than was available in the slope (Eden and Jarrett, 1971). The
pressuremeter, however, imposes less constraint on the fracture surface and often stresses the soil horizontally beyond the preconsolidation
I 1
1 ONSt6Y (LACASSE ET AL, 1981)
-
2 DRAMMEN (LACASSE ET AL, 1981)-
3 GLOUCESTER (EDEN AND LAW, 1980)
4 NEW LISKEARD
5 MATAGAMI (EDEN AND LAW. 1900)
-
6 OTTAWA (EDEN AND LAW. 1980)7 SEA ISLAND (THIS STUDY)
-
-
1-
7 .\
i
\
-
6-
-
i I IOVERCONSOLIDATION RATIO (OCR)
Figure 3. Correlation of pressuremeter/vane strength ratio and the
overconsolidation ratio of soils.
pressure. Consequently, the effects of high OCR leading to high undrained strength is less significant for the pressuremeter test and the ratio s ~ ~ decreases with increasing OCR. / S ~ ~ (b) The in situ horizontal stress, oho, is obtained by noting the lift-off pressure at the beginning of the pressuremeter test. This pressure which.corresponds to the pressure surrounding the probe may be different from the original in situ value due to the effects of disturbance introduced by the insertion of the probe. For the present silty soil, the effect of disturbance is small and the lift-off pressure is therefore close to the in situ horizontal pressure. From the results shown in Figure 1 the coefficient of earth pressure at rest, KO, varied from 0.42 to 0.67 with an average of 0.56.
Piezo-Friction-Cone (a) The piezometer in the
piezo-friction-cone is located above the conical tip where water pressure can act over a part of the base area of the cone inside the penetrometer and on both ends of the friction sleeve. The measured total stress qc will therefore be reduced. For the 10 cm2 GMF piezo-friction penetrometer used in this study:
where qT = corrected total stress and uT = measured total pore water pressure. To correct the friction sleeve measurements, consider the total pore water pressure acting
1.8 I I I I I I I
0 ST. ALBAN CLAY, ROY ET AL., 1980 d = 38 mm
1.6
-
ST. ALBAN CLAY, KONRAD. 1977 d = 203 mm-
3 0 NORMALLY CONSOLIDATED CLAY, TORSTENSON, 1975
Q
.
1 .4
-
A BOSTON BLUE CLAY. BALIGH ET AL., 1980 d = 3 6 mm-4
A MINE TAILINGS, SUGAWARA AND CHIKARAISHI, 1982d = 3 6 m m
6
1.2-
-
8 SEA ISLAND CLAYEY SILT,CAMPANELLA E l AL., 1981
DISTANCE FROM TIP, n
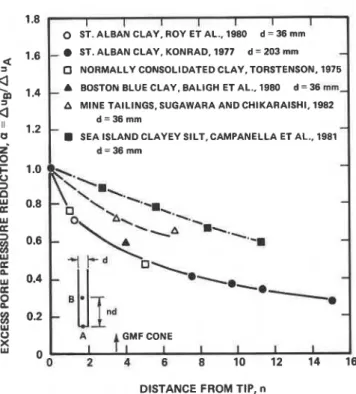
Figure 4. Distribution of excess pore water pressure in saturated soil along a penetrating cylindrical pipe.
at both ends of the sleeve. Figure 4 shows that the distribution of excess pore water pressure in saturated soil along a shaft of a penetrating cylindrical pipe is a function of the distance from the base. It may be
influenced by soil type, but it is quite insensitive to variations in diameter of the pipe. Th,e correction for the penetrometers used in the study will be:
f (corrected) = fs(measured)
-
guo-
yAUA (2)As
-
= surface area of sleeveAA = cross-sectional area of sleeve at bottom end
%
= cross-sectional area of sleeve at upper endA U ~ = measured excess pore water pressure at bottom end of friction sleeve A% = excess pore water pressure at upper
end of friction sleeve.
uo - = average hydrostatic pore water pressure in the soil around the tip of the cone.
It must be stressed that equal cross-sectional end areas of the sleeve will still require a
correction of the measured friction given by:
These are extremely important when dynamic pore water pressures are generated during penetration in clays or silty soils but are practically negligible in cohesionless soils because the tests are performed under
practically drained conditions.
(b) Four soundings were performed at adjacent locations spaced from 3 m to 4 m apart. At the first, measurements of cone tip resistance qc and skin friction fs were made continuously using a standard penetration rate of
2 cm/sec. The effect of varying the rate of penetration was studied at the other three soundings where measurements of qc, fs and total pore water pressure uT were obtained for penetration rates of 2, 1 and 0.5 cm/sec. The results of the cone tests are shown in Figures 5 to 7. There was no zero shift for qc and uT after each sounding; however, there was a slight shift in fs. The change was less than - 5% of the average measured friction and thus no further zero correction was made.
The piezo-friction-cone penetrometer is very sensitive to changes in the stratigraphy. There is a sharp increase in cone tip resistance, sleeve friction and an abrupt reduction in pore pressure at 20.5 m in test C3 only, probably due to the presence of a sand lens. Slight increase in qT with a concomitant decrease in uT are observed at depths 22, 24 and 26 m indicating possible layers of siltier soil (Figure 1).
CORRECTED TOTAL
STRESS, kPa CONE FACTORS 0 4 8 1 2 I I TEST C2 (ONLY)
I
I 0 I 0%
i
I I (b)Figure 5. Corrected cone tip resistance profiles and cone factors.
PORE WATER PRESSURE, kPa
I
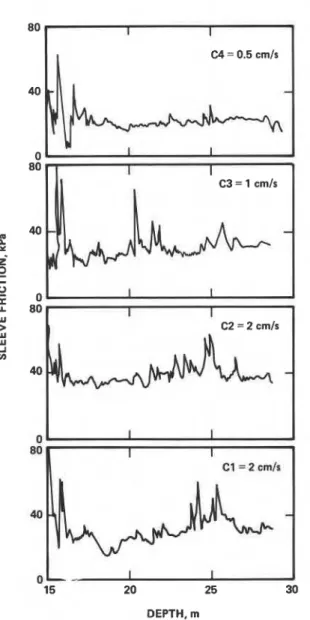
C4 = 0.5 cmls 40 0 C3 = 1 cmls DEPTH, mFigure 6. Measured sleeve friction for various cone penetration rates.
The presence of these various silt layers and sand lenses at different depths in the soft deposit, typical of most deltaic formations. results in some stratigraphic variations in the different cone logs, although the test holes were closely spaced. Therefore, the effect of different penetration rates are analysed using the average values of tip resistance, sleeve friction and total pore water pressure. The total tip resistance qT was penetration rate dependent in the clayey silt formation. Its average value increased about 10% each time the penetration rate was reduced 50% from 2 t o 1 to 0.5 cm/s. The cone tip resistance is dependent upon the behaviour of the soil and the effective stress conditions around the cone. One significant factor is the pore pressure distribution around the tip. This
Figure 7. Excess pore water pressure profiles obtained at three different rates of penetration.
increase of q,, at low rates is thought to be associated with the .development of partially drained conditions induced by pore pressure dissipation in all directions ahead of the tip. The pore water pressures have been measured at the base of the shaft and were not appreciably affected by the different rates of penetration (Figure 7). It must be stressed, however, that these pore pressures d o not reflect the actual pore pressures below the cone, owing to the different condolidation conditions around the penetrometer. Since the consolidation ahead of the tip is spherical and around the shaft it is cylindrical, the time factor for the latter pore pressure dissipation is much larger than in the soil ahead of the cone. Hence, the pore pressures generated below the penetrometer will dissipate much faster, especially in the more permeable silty soils.
The measured sleeve friction was also affected by rate of cone penetration. As shown in Figure 6, the sleeve friction decreased with decreasing rate of penetration. To illustrate, consider the profile obtained in the uniform silt below a depth of 27 m. The measured friction was 30 and 35 kPa at 2 cm/s, 30 kPa at 1 cm/s and 24 kPa at 0.5 cm/s. Note that by applying pore water pressure corrections
(Equation 3) and using a = 0.85, these
corrected values are respectively 22 and 27 kPa, 22 kPa and 17 kPa.
Cone Factors
(a) Cone tip resistance, skin friction and pore pressures generated during penetration depend upon the effective stresses developed in the soil surrounding the cone and on the
resistance may be empirically correlated to an undrained shear strength by the relationship:
where NK = cone factor.
S is not a unique soil property but depends on the stress path used to reach failure with different measurement techniques.
The effective value of tip resistance. q' =
9~
-
uT is also related to S by the u relation proposed by Senneset et a1 (1982):where the average N& = 9 i: 3.
For saturated cohesive soils typical values of NK are 10 to 15 for normally consolidated and 15 to 20 for overconsolidated clays
(De Ruiter, 1982).
Cone factors NK and Nb evaluated with respect to the undrained shear strength from the
field vane Suv are shown in Figure 5(b) for the standard rate of penetration. N increases
K
with depth and its average value is 9. NIC is fairly constant with depth and has a value of about 5.
Approximate theoretical evaluation of the cone factor can be obtained by spherical cavity expansion failure (Vesic, 1972) from:
where NC is the theoretical cone factor. For IR between 60 and 250, NC varies from 9.4
--
to 11.2. Back-calculated cone factors from:
1
(aVO
+
2oho) range between 6.8 where ooct =-
and 10.2 which agrees fairly well with Vesic's simplified approach.
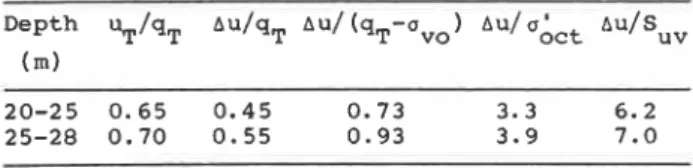
(b) Konrad (1977), Baligh et a1 (1980) suggested that the pore pressures measured immediately behind the tip during cone penetration could be used to determine the undrained shear strength and to indicate consolidation history of fine grained soils. Figure 7 shows the pore pressure profiles obtained from three cone tests. In the clayey silt formation below 15 m, the average pore pressure generally increased with depth. Table I1 presents average values of various proposed pore pressure ratios reported in current literature. As mentioned above, uT/qT varies with consolidation history. Work by Smits (1982) an_d_ Lacasse et a1 l1981) shows uT/qT varying between 0.6 and - - 0.8 in normally consolidated soils which seems to agree with the present study for clayey silt.
Table 11. Summary of Pore Water Pressure Data
Between 20 and 25 m, the ratio of the change in excess pore pressure with respect to the change in total vertical stress is 0.73 for the field conditions and 0.66 in CIU tests. The larger field value is due to a change in total
horizontal stress during the penetration of the cone. The undrained shear strength may also be determined semi-empirically from the pore pressure measurements using the following equation proposed by Vesic (1972) for a spherical cavity expansion:
The selection of representative parameters I,
-.
and Af is of paramount importance for adequate determination of Sll. The average rigidity - index of the soil layer between 20 and 25 m is 70 (from CIU tests) and 170 (from pressuremeter tests at 10% shear strain). Theoretical values of A U from Equation (8) vary
TI
from 6.3 to 7.4, which compare with the observations given in Table I1 using uncorrected field vane strengths (bu/SUv). Dilatometer (DMT) Tests
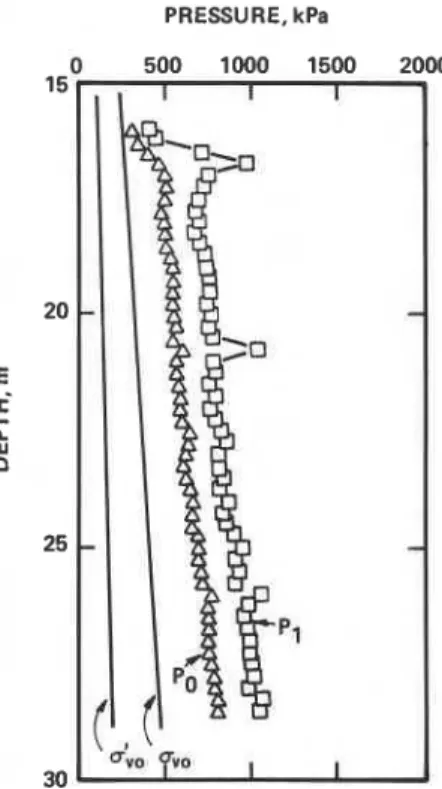
Figure 8 presents a typical DMT test profile in terms of lift off pressure, po, and,
Pll pressure at 1 mm deformation through the clayey silt below a depth of 16 m. The recorded profile is consistent with the cone, although less detailed. Nevertheless, the larger po and pl at depths of 21 m and 26 m
-
correspond to the sandy layers detected with the cone. Two DMT soundings showed almost
identical results, indicating a fair
repeatability with this tool. Figure 8 shows poand pl increasing uniformly with depth. The
-
soil type index Id defined as bp/(p -u ) is
0 0
relatively constant at about 0.18. According to Marchetti's (1980) soil classification this indicates a silty clay, whereas the actual clayey silt should have an Id value of about 0.6.
The determination of K OCR and SU is obtained
0'
from the horizontal stress index
%,
defined as (p -u0)/oko. It was relatively constant in the0
clayey silt with an average 1.8 i: 0.2. This is not, however, within the range of
Marchetti's empirical relationships which start at
%>
1.5 for determining K and K > 2 for0 D
determining the OCR. At
%
= 2, KO = 0.5 and OCR = 1, and for KD < 2 the OCR < 1, which is unrealistic. Consequently, further researchPRESSURE, kPa
Figure 8. Dilatometer test results for DMT-6.
1
is required in soils where K < 2 in order to Ddefine OCR reasonably accurately.
1
The determination of the undrained shear
I
strength SU is therefore affected because it isI
I calculated from the following equation given
,
by Mesri (1975).I
= 0.22 x OCR
<o (9)
From the DMT tests in the clayey silt, the empirically determined strength ratio
SU/oio = 0.19 which considerably underestimated the average value of 0.33 obtained in situ with the NGI vane.
CONCLUSIONS
(1) In situ tests with the
piezo-friction-cone, self-boring pressuremeter and the flat plate dilatometer demonstrated that empirical correlations developed for clay soils were not directly applicable to the low plasticity silt formation (I = 10) at Sea
P
Island.
(2) The self-boring pressuremeter measured 62% greater soil strengths than the field vane. In turn, the measured field vane strengths were a little less than the triaxial CIU values, significantly greater than those measured in situ with the dilatometer and at least double those obtained with the Swedish cone on tube samples.
(3) The in situ horizontal stress measured with the self-boring pressuremeter indicated a KO = 0.56 for the clayey silt formation.
(4) The rate of cone penetration was more important on the tip resistance and friction sleeve than on the pore pressure response. In silt soils a penetration rate of 1 cm/s is suggested.
(5) The piezocone is very sensitive to the stratigraphic changes in soil profile.
(6) The flat plate dilatometer does not
produce good empirical correlations for K OCR
0'
and SU in silt soils when the horizontal stress index KD is less than 2.
(7) Samples of the clayey silt formation obtained with thin walled stainless steel Shelby tubes were considerably disturbed.
ACKNOWLEDGEMENTS
Thanks are due to Professor R.G. Campanella, Department of Civil Engineering, University of British Columbia, and to Dr. J.M.O. Hughes, Western Geosystems Inc., Vancouver, who assisted the field research program at Sea Island.
This paper is a contribution from the Division of Building Research, National Research Council of Canada, and is published with the approval of the Director of the Division.
REFERENCES
Baguelin, F., J.F. JLzLquel, E. Lemee and
A. Le MBhantb (1972). Expansion of
cylindrical probes in cohesive soil. ASCE Jour. of the Soil Mech. and Found. Eng. Div., Vol. 98, SM 11, pp. 1129-1142. Baligh, M.M., V. Vivatrat and C.C. Ladd
(1980). Cone penetration in soil profiling, ASCE Jour. of the Geot. Eng. Div., Vol. 106, GT4, p. 447.
Campanella, R.G., P.K. Robertson and
D. Gillespie (1981). In situ testing in saturated silt. 34th Can. Geot. Conf., Fredericton, N. B.
De Ruiter, J. (1982). The static cone
penetration test: state-of-the-art report, Proc. 2nd Symp. on Penetration Testing, pp. 389-406.
Eden, W.J. and P.M. Jarrett (1971).
Landslides at Orleans, Ontario. National Research Council of Canada, Division of Building Research. Technical Paper 321. Eden, W.J. and K.T. Law (1980). Comparison
of undrained shear strength results
obtained by different test methods in soft clays. Can. Geot. Jour., Vol. 17, No. 3, pp. 369-381.
Konrad, J. M. (1977). Contribution au calcul du frottement lateral des pieux flottants fonces dans des argiles molles et
sensibles. M. Sc. Thesis, Dept. of Civ. Eng., Lava1 Uni., Quebec.
Lacasse, S., M. Jamiolkowski, R. Lancellotta and T. Lune (1981). In situ
characteristics of two Norwegian clays. Proc. of 10th Int'l. Conf. on Soil Mech. and Found. Eng., Stockholm, Vol. 2, pp. 507-511.
Ladanyi, B. (1972). In situ determination of undrained stress-strain behaviour of sensitive clays with the pressuremeter. Can. Geot. Journal, Vol. 9, pp. 313-319. Mesri, G. (1975). Discussion on new design
procedure for stability of soft clays. ASCE Jour. Geot. Eng. Div., Vol. 101, GT4, pp. 409-412.
Senneset, K., N. Jambu and G. Svanb (1982). Strength and deformation parameters from cone penetration tests. Proc. 2nd Eur. Symp. on Penetration Testing, pp. 863-870. Smits, F.P. (1982). Penetration pore
pressure measured with piezometer cones. Proc. 2nd Eur. Symp. on Penetration Testing, pp. 871-876.
Sugawara, N. and M. Chikaraishi (1982). On estimation of
+ '
for normally consolidated mine tailings using the pore pressure cone penetrometer. 2nd Eur. Symp. onPenetration Testing, pp. 883-888. Torstensson, B-A. (1975). Pore pressure
sounding instrument. ASCE Conf., In Situ Measurements of Soil Properties, Raleigh, N.C., Vol. 2, pp. 48-51.
Vesic, A.S. (1972). Expansion of cavities in infinite soil mass. ASCE Jour. Soil Mech. Found. Eng. Div., Vol. 98, SM3.