HAL Id: hal-00563184
https://hal.archives-ouvertes.fr/hal-00563184
Submitted on 4 Feb 2011
HAL is a multi-disciplinary open access
archive for the deposit and dissemination of
sci-entific research documents, whether they are
pub-lished or not. The documents may come from
teaching and research institutions in France or
abroad, or from public or private research centers.
L’archive ouverte pluridisciplinaire HAL, est
destinée au dépôt et à la diffusion de documents
scientifiques de niveau recherche, publiés ou non,
émanant des établissements d’enseignement et de
recherche français ou étrangers, des laboratoires
publics ou privés.
aerosol structures in the framework of AMMA SOP-0
Jean-Christophe Raut, P. Chazette
To cite this version:
Jean-Christophe Raut, P. Chazette. Radiative budget in the presence of multi-layered aerosol
struc-tures in the framework of AMMA SOP-0. Atmospheric Chemistry and Physics, European Geosciences
Union, 2008, pp.6839. �hal-00563184�
© Author(s) 2008. This work is distributed under the Creative Commons Attribution 3.0 License.
Chemistry
and Physics
Radiative budget in the presence of multi-layered aerosol structures
in the framework of AMMA SOP-0
J.-C. Raut and P. Chazette
Laboratoire des Sciences du Climat et de l’Environnement, Laboratoire mixte CEA-CNRS-UVSQ, CEA Saclay, 91191 Gif-sur-Yvette, France
Received: 6 May 2008 – Published in Atmos. Chem. Phys. Discuss.: 1 July 2008 Revised: 13 October 2008 – Accepted: 13 October 2008 – Published: 28 November 2008
Abstract. This paper presents radiative transfer calculations
performed over Niamey in the UV-Visible range over the period 26th January–1st February 2006 during the African Multidisciplinary Monsoon Analysis (AMMA) international program. Climatic effects of aerosols along the vertical col-umn have required an accurate determination of their opti-cal properties, which are presented here for a variety of in-strumented platforms: Ultralight aircraft, Facility for Air-borne Atmospheric Measurements (FAAM) research aircraft, AERONET station. Measurements highlighted the presence of a multi-layered structure of mineral dust located below and biomass-burning particles in the more elevated layers. Radiative forcing was affected by both the scattering and absorption effects governed by the aerosol complex refrac-tive index (ACRI). The best agreement between our results and AERONET optical thicknesses, ground-based extinc-tion measurements and NO2photolysis rate coefficient was
found using the synergy between all the instrumented plat-forms. The corresponding averaged ACRI at 355 nm were 1.53 (±0.04) −0.047i (±0.006) and 1.52 (±0.04) −0.008i (±0.001) for biomass-burning and mineral dust aerosols, respectively. Biomass-burning aerosols were characterized by single-scattering albedo ranging from 0.78 to 0.82 and asymmetry parameter ranging from 0.71 to 0.73. For dust aerosols, single-scattering albedo (asymmetry parameter) ranged from 0.9 to 0.92 (0.73 to 0.75). The solar energy de-pletion at the surface is shown to be ∼−21.2 (±1.7) W/m2as a daily average. At the TOA, the radiative forcing appeared slightly negative but very close to zero (∼−1.4 W/m2). The corresponding atmospheric radiative forcing was found to be
Correspondence to: J.-C. Raut
(jean-christophe.raut@lsce.ipsl.fr)
∼19.8 (±2.3) W/m2. Mineral dust located below a more ab-sorbing layer act as an increase in surface reflectivity of ∼3– 4%. The radiative forcing is also shown to be highly sensitive to the optical features of the different aerosol layers (ACRI, optical thickness and aerosol vertical distribution).
1 Introduction
In contrast to the radiative forcing attributed to greenhouse gases, which may be estimated to a reasonably high degree of accuracy, the uncertainties related to aerosol radiative forc-ings remain very large. Hence, aerosol particles have re-ceived an increasing amount of attention in the recent years. Scattering and absorption by aerosols have a significant im-pact on the energy budget of the atmosphere (Alpert et al., 1998), as well as on the surface (Fouquart et al., 1987). They reduce the solar radiative flux at the surface (Charl-son et al., 1992), can limit surface evaporation and surface heat fluxes, and may modify large-scale atmospheric circu-lations as shown during the Indian Ocean experiment (IN-DOEX, Ramanathan et al., 2001; L´eon et al., 2005). They also influence the climate altering the radiative properties and lifetime of clouds when particles act as Cloud Condensation Nuclei (Twomey et al., 1984). Atmospheric dynamics and convection can therefore be affected by aerosol (Ackerman et al., 2000). Assessing their influence is made complex by the high spatial and temporal variability of aerosol physical, chemical, and optical properties. This problem arises mainly due to diverse range of aerosol sources and their short resi-dence times in the atmosphere.
Among all sources of atmospheric particles, Western Africa is the world’s largest source of biomass burning aerosols (Andreae and Merlet, 2001) and mineral dust
(Prospero et al., 2002). The regional impacts of mineral dust events have been studied, especially over sea areas, in previous multi-disciplinary campaigns involving ground-based monitoring, research aircraft, satellite observations, e.g. Mediterranean Dust experiment (MEDUSE, Hamonou et al., 1999; Dulac and Chazette, 2003), Saharan Dust Ex-periment (SHADE, Haywood et al., 2003b) and the Aerosol Characterisation Experiment (ACE-Asia, Seinfeld et al., 2004). However, there are limited studies of mineral dust in mixtures with biomass burning aerosol. The Sahelian re-gion is a major global source of biomass-burning aerosol during the dry season (Bond et al., 2004) with maximum emissions occurring from December to March (Swap et al., 2003). Their black carbon content depending on fire inten-sity and vegetation deninten-sity clearly affects the radiation bal-ance. Such submicronic aerosol particles have a strong ef-fect on solar radiation but have negligible efef-fect on terrestrial radiation because aerosol optical depth decreases strongly with increasing wavelength leading to the tendency for sub-micron aerosol layers to be transparent at infrared wave-lengths (Harshvardhan, 1993).
Previous observations of biomass-burning aerosols have been performed mainly in South America (e.g. Reid et al. 1998; Kaufman et al., 1998; Andrea et al., 2004), in South-ern Africa (i.e. Swap et al., 2002; Myhre et al., 2003) and in Western India (e.g. Ramanathan et al., 2001; Pelon et al., 2002). Nevertheless, few observations are available about the radiative impact of burning of agricultural waste in the Sahe-lian region that likely influence the African monsoon cycle, living conditions and human health in that region.
Moreover, in the Sahel dust and biomass burning aerosols co-exist and may interact on a microphysical level, a pro-cess that has not been investigated yet in past field exper-iments. The objective of the Dust and Biomass Burning Experiment (DABEX), as part of African Monsoon Multi-disciplinary Analysis (AMMA) (Redelsperger et al., 2006), was to characterize the optical properties and direct radiative forcing of dust and biomass-burning aerosols in the Sahel. DABEX was conducted during the AMMA dry season Spe-cial Observation Period SOP-0 in January–February 2006 over Western Africa. Haywood et al. (2008) provides an overview of the experimental objectives, platforms, and me-teorology during DABEX and AMMA SOP-0. This study complements the works of Johnson et al. (2008a), Osborne et al. (2008) and Mallet et al. (2008) which report the optical characterization of biomass-burning aerosols, mineral dust particles and radiative effects of biomass-burning particles in Northern Benin, respectively.
This paper presents radiative transfer calculations per-formed over Niamey in the UV-Visible range over the period 26th January–1st February. Accurate calculations of the ra-diative effects of dust and biomass-burning aerosols through the atmospheric column require high quality measurements of their microphysical and optical properties. These proper-ties are derived in this study from a variety of instrumented
platforms, including ground-based, airborne and integrated-column remote sensing. The sensitivity of the radiative ef-fects to optical features of the different layers will be also presented.
2 Tools
2.1 Instrumental set-up
Ground-based observations at Niamey (13◦30′N, 2◦10′E, Niger) have been complemented by ultra-light aircraft (ULA) and Facility for Airborne Atmospheric Measurements (FAAM) aircraft measurements, which provide a character-ization of dust and biomass burning aerosols microphysi-cal and optimicrophysi-cal properties within the low and middle tropo-sphere (between the ground to 5 km above the mean sea level (amsl)).
2.1.1 ULA platform
The ULA used was built by the Air Cr´eation Company (www.aircreation.fr). It is a high performance model Tanarg 912-XS weight-shift control ULA platform. Technical fea-tures are fully described in Chazette et al. (2007). The ad-vantages of such an aircraft are its manoeuvrability in small atmospheric volumes, its ability to cruise at levels from near-surface up to more than 5.5 km, and its low speed of flight, which minimizes the isokinetic problems involved in in situ aerosol measurements. Furthermore, it can use small air-fields for takeoff and landing. The ULA performed 17 flights within the vicinity of Niamey: ULA-1 to 17. The aerosol payload was composed of an eye-safe backscatter lidar emit-ting in the ultraviolet and a scatterometer to measure the aerosol side-scattering in the near-infrared described in the following.
The Lidar A´erosol UltraViolet A´eroport´e (LAUVA) is a homemade prototype instrument developed by the Commis-sariat `a l’Energie Atomique (CEA) and the Centre National de la Recherche Scientifique (CNRS). It was designed to monitor the aerosol dispersion in the low and middle tropo-sphere. It operates with a Nd:Yag laser at the wavelength of 355 nm. It is light, compact, eye-safe and suitable for an airborne platform. Its resolution along the line of sight is 1.5 m. During flights, the combination of horizontal shooting during ascent and descent phases with nadir shooting during transects enabled us to derive vertical profiles of backscatter-to-extinction ratio (BER) and backscattering coefficient. Fur-ther description of this data retrieval procedure can be found in Chazette et al. (2007).
The Personal DataRam (PdRam) is a small portable nephelometer-type instrument documented in Dulac et al. (2001), who operated it under a sounding balloon off the coast of the Sahara. It measures aerosol side-scattering in the angular range of 45–95◦at the wavelength of 880 nm (band-width of 40 nm). The instrument is calibrated in terms of Mie
scattering using a gaseous reference scatterer and in terms of aerosol extinction at 870 nm against a ground-based sunpho-tometer (Chazette et al., 2007).
A Vaisala meteorological probe type PTU200 was used to measure the temperature, the relative humidity, and the at-mospheric pressure.
In addition, a global positioning system manufactured by Trimble was used to measure the location of the ULA (with accuracies of 15 and 10 m for vertical and horizontal posi-tions, respectively), and an artificial horizon (electronic flight information system) manufactured by Dynon Avionics was used to locate the lidar line of sight in the three dimensions of space, with an accuracy close to 0.5◦.
2.1.2 FAAM platform
The Facility for Airborne Atmospheric Measurements (FAAM) BAe-146 meteorological research aircraft is used by the UK atmospheric research community. It was based at Niamey, Niger from 11th January to 3rd February. All flights started and ended at Niamey International Airport. The aircraft performed 13 flights within the vicinity of Ni-amey. It contains a comprehensive suite of instruments mea-suring aerosol, cloud, chemical tracers, solar and terrestrial radiative fluxes and standard meteorological variables that are described in Johnson et al. (2008a) and summarized be-low.
Aerosol size distributions were measured by the Pas-sive Cavity Aerosol Spectrometer Probe 100X (PCASP), mounted externally under the aircraft wing and sizing aerosols with radii in the range 0.05–1.5µm. The PCASP is calibrated using latex spheres of known sizes. The refractive index of latex (1.58) differs slightly from those of biomass-burning or mineral dust aerosols. This causes the PCASP to underestimate aerosol radius by a factor of 0.93 over the opti-cally active part of the size-spectrum (0.1–0.3µm) (Haywood et al., 2003a). For larger (super-micronic) particles, aircraft sampling is always problematic.
A three-wavelength (450, 550 and 700 nm) nephelometer (manufactured by TSI®was used onboard the aircraft. This instrument uses a Rosemount head for its inlet and measures the aerosol scattering coefficient in a 7–170◦ range of scat-tering angle (Bodhaine et al., 1991). To compensate for the limited range of scattering angles, the nephelometer data was calibrated using Anderson and Ogren (1998) sub-micron cor-rections. Also, because sampling efficiency drops off rapidly with particle size above about 1µm radius (Haywood et al., 2003a) a correction was made to account for large particle losses (Osborne et al. 2008). To allow comparison with the lidar that operates at 355 nm, the scattering coefficient of the nephelometer has been extrapolated in wavelength us-ing the Angstr¨om exponent derived from the 450 nm and 550 nm channels. The nephelometer heats air in the instru-ment, which may lead to partial or complete evaporation of any water present around the aerosols. However, since the
ambient relative humidity was very low (mean of 40% and standard deviation of 30%) during most flights it is unlikely that the aerosols contained much water.
A Particle Soot Absorption Photometer (PSAP), also equipped with a Rosemount inlet, measures the aerosol ab-sorption coefficient at 567 nm, inferred from loss of trans-mission of light through a filter. The PSAP absorption co-efficient was corrected for errors in filter exposure area, air flow rate, over-reading of absorption, the influence of tering by aerosols collected on the filter, and multiple scat-tering within the filter following the methods of Bond et al. (1999). An adjustment was also made to convert the ab-sorption coefficient measured at 567 nm to 355 nm, the wave-length of the LAUVA. For this correction the absorption is assumed to vary as the reciprocal of wavelength, as in Reid and Hobbs (1998). Aircraft altitudes were measured by a global positioning system.
2.1.3 Ground measurements
AErosol RObotic NETwork (AERONET) aerosol optical depths (AOD, level 2.0) and aerosol size distributions of the Banizoumbou (13◦31′N, 2◦34′E) ground site located at about 50 km East from Niamey are used in this paper (Rajot et al., 2008). The retrievals were carried out using Version 2 of the inversion algorithm (Dubovik et al., 2006). The chan-nels of the sunphotometer used for this study are centered at 438 nm and 669 nm, with bandwidths of less than 20 nm and the instrument field of view is about 1◦(Holben et al., 1998). The AERONET database gives a maximal absolute uncer-tainty of 0.02 for the optical thickness due to calibration un-certainty for the field instruments. Extrapolation is then used to estimate the AOD at 355 nm for comparison with the li-dar. Values have been averaged at the closest time of the flights. In particular, no measurement was available on the 26th January before 13:30 UTC and thin cloud on 28th Jan-uary prevented accurate retrievals by AERONET so no AOD data was available.
The actinic flux is the radiation quantity that best describes the geometry in photoreactions. It is sensitive to aerosol presence and is a function of the aerosol optical parameters. To monitor the actinic flux at the ground station, a JNO2
optical actinometer (manufactured by Metcon, Glash¨utten, Germany) has been installed. It is dedicated to the mea-surement of the photodissociation rate coefficient J(NO2) of
NO2 molecule, which is the probability for a NO2 single
molecule to be photodissociated by absorbing solar radiation. J(NO2) is a function of the actinic flux, the photodissociation
quantum yield and the absorption cross section of the NO2
molecule. Actinic flux is measured by a radiometer made up of two identical detectors with uniform response over 2π sr. Using the calibration coefficient determined from a compari-son with a chemical actinometer, the measured actinic flux is directly converted into J(NO2) values (in s−1) with a relative
meters above the ground, one pointing up and the second one parallel but pointing down. Such a configuration allows the determination of the upward J(NO2)u and downward
con-tribution J(NO2)d (Randriamiarisoa et al., 2004). This
in-strument was operated at Niamey airport. J(NO2) data are
recordered every minute.
The Atmospheric Radiation Measurements (ARM; see http://www.arm.gov/sites/amf.stm) Mobile Facility (AMF) was installed at Niamey airport for the duration of the DABEX field campaign. Thus, scattering and absorption coefficients were also measured at the surface from a neph-elometer working at 450, 550 and 700 nm and a PSAP oper-ating at 467, 530 and 660 nm (Miller et al., 2007).
2.1.4 Satellite observations
The MODerate-resolution Imaging Spectroradiometer (MODIS) satellite observations (http://modis.gsfc.nasa.gov/) provide the Bidirectional Reflectance Distribution Function (BRDF) of each pixel in MODIS spectral “Land” bands, as well as for three broad bands (0.3–0.7, 0.7–5.0, and 0.3–5.0 µm). They give data describing both directional hemispherical reflectance (black-sky albedo) and bihemi-spherical reflectance (white-sky albedo). These are intrinsic surface properties, independent of atmospheric state. They describe the upward scattering of the solar beam and of uniform diffuse irradiance, respectively. In this study, we used both Terra and Aqua data providing 16-day composites projected to a 0.05 degree (5600 m) latitude/longitude Climate Modeling Grid.
2.2 Radiative transfer model 2.2.1 TUV model
The estimation of the aerosol radiative forcing has been performed using the Tropospheric Ultraviolet and Visible (TUV) radiative transfer model. TUV was developed by Madronich and his colleagues at the US National Center for Atmospheric Research (http://cprm.acd.ucar.edu/Models/ TUV/, Madronich and Flocke, 1998) and uses the DIScrete ORdinates Radiative Transfer (DISORT) solver (Stamnes et al., 1988) modified for pseudo spherical geometry. Version 4.4, four-stream and sixteen-stream discrete ordinate calcu-lations were used in this study to calculate the heating rate from 0 to 12 km and the aerosol radiative forcings at the sur-face and at the top of the atmosphere in the spectral interval 200–750 nm.
The TUV model has been chosen because it allows an ac-curate computation of actinic fluxes leading to a possible comparison of actinometer measurement with the retrieved photodissociation rate coefficient J(NO2) for each dataset.
Models using the Atmospheric Laboratory for Applications and Science 3 (ATLAS-3) extraterrestrial solar spectrum, such as TUV model, are in better agreement with
mea-surements, suggesting the appropriateness of ATLAS-3 for model calculations (Bais et al., 2003). Investigating the spec-trally resolved actinic fluxes calculated by 16 models, Bais et al. (2003) showed that when all model input parameters ex-cept the extraterrestrial solar spectrum are the same, the cal-culated actinic flux spectrum based on ATLAS-3 compares better with the measurements at the ground in the region 300–400 nm than those based on Modtran 3 and Neckel and Labs (1984).
Another reason for choosing the TUV model is that we try to properly evaluate the aerosol complex refractive index (ACRI) in this paper for dust and biomass-burning aerosols at 355 nm. An accurate assessment of the visible radiative impact of atmospheric aerosols can be carried out assuming that ACRI is constant between 0.3 and 0.8µm (Volz, 1973). In the near infrared spectrum, this hypothesis is not realistic any longer. Volz (1973) showed for instance that the real part of mineral dust particles sharply drops from 1.5 to 1.2 be-tween 1 and 2µm. Important spectral dependence of imag-inary parts in shortwave infrared region was also observed for hygroscopic aerosols, such as biomass-burning particles. Our study thus focuses on radiative transfer calculations in UV-Visible domain and a discussion on the representativity of the results will be performed.
2.2.2 Radiative approach
Radiative transfer computations depend on several input pa-rameters: spectral surface albedo, vertical profiles of atmo-spheric pressure, temperature, ozone, spectral aerosol extinc-tion coefficient, single-scattering albedo (ωo) and asymmetry factor (g). Those aerosol dependent parameters can be de-termined from the aerosol complex refractive index (ACRI), aerosol size distribution and lidar or nephelometer measure-ments of aerosol extinction.
The TUV model has been slightly modified to take into account the vertical distribution of all optical parameters: ex-tinction coefficient, single-scattering albedo, and asymmetry factor. To accurately describe the impact of the multilayered structure in the atmosphere, the model vertical grid has been divided into homogeneous layers of 0.1 km thickness from 0 to 5 km altitude, 0.5 km thickness from 5 to 12 km, and 2 km thickness above 12 km. Pressure, temperature and relative humidity vertical profiles used in the TUV were taken from measurements made onboard the FAAM aircraft and ULA during each flight. Ozone concentration profiles were also taken from measurements by the FAAM. Above 5 km, the profiles of atmospheric constituents have been completed us-ing the US Standard Atmosphere annual means of 1976 at 45◦N, which do not much differ from the tropical mean pro-files above 5 km (McClatchey et al., 1972).
Two radiative transfer methods proposed by the radiative transfer modelling have been used: the 4-stream discrete or-dinates method to simulate the irradiances (Stamnes et al., 1988) and a more precise approach to calculate the photolysis
Table 1. Dates and times of flight profiles from the FAAM and ULA aircraft for the five selected case studies, plus AODs calculated at
355 nm from the aircraft profile and the AERONET sunphotometer at Banizoumbou.
Case Day FAAM flight period (UTC) FAAM AOD ULA flight period (UTC) ULA AOD AERONET AOD
1 26 Jan 08:10–08:34 0.82 07:09–09:03 0.54 0.65
2 26 Jan 10:24–10:37 0.75 09:59–10:53 0.66 0.65
3 26 Jan 11:44–11:58 0.73 11:30–12:04 0.56 0.65
4 28 Jan 09:54–10:11 0.54 09:12–11:06 0.46 −
5 1 Feb 11:05–11:21 0.60 07:31–09:11 0.43 0.46
rates, the 16-stream discrete ordinates method, based on pre-ferred directions along which the resolution of transfer ra-diative equation is done, allowing an accurate treatment of multiple scattering effects by aerosols.
Calculations of both direct Fdird and diffuse downwelling Fdiffd fluxes, and diffuse upwelling fluxes Fdiffu in clear-sky conditions enabled the determination of the net radiative fluxes over the UV and visible spectrum for 24 hours peri-ods with 1 h time resolution. Aerosol radiative forcings at the bottom of atmosphere (BOA, 1FBOA), at the top of the
atmosphere (TOA, 12 km, 1FTOA) and in the atmospheric
layer containing the particles (ATM, 1FATM) are then
calcu-lated. Heating rates due to the only presence of aerosols have then been calculated.
3 Coherence of the experimental datasets
Five case studies are considered in this study. They cor-respond to the five coordinated flights between ULA and FAAM aircraft. The three first cases correspond to B163-2 (ULA-6), B163-4 (ULA-7a), B163-9 (ULA-7b) flights of 26 January, and the last ones to B164-2 (ULA-9) and B166-1 (ULA-17) flights of 28 January and 1 February, respectively. The profiles were all acquired quite close to Niamey (less than 100 km distance) and the corresponding flight periods are summarized in Table 1.
3.1 Vertical profiles of extinction coefficient, Angstr¨om ex-ponent and water vapour
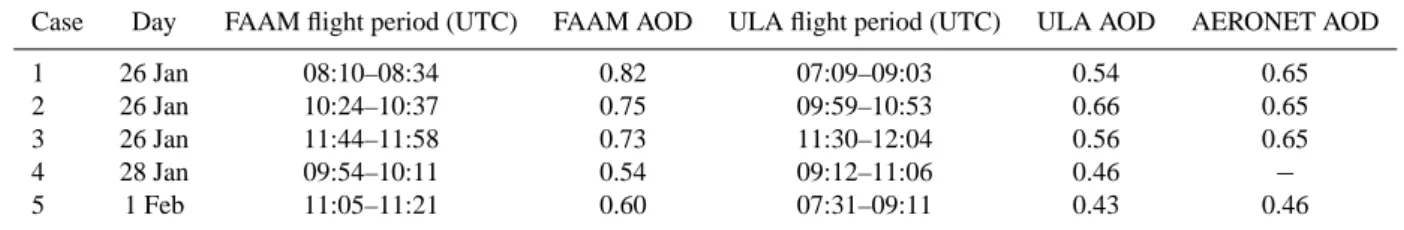
ULA, FAAM aircraft, ARM and AERONET datasets have been compared in the atmospheric column in terms of aerosol extinction coefficient, calculated as the sum of scattering and absorption for FAAM and ARM results, and plotted on Figs. 1 to 5 for each case.
All flights show similar vertical structures in the aerosol profile where aerosol extinction is highest in the lowest 1.5 km (cases 1 to 3) or 1 km (cases 4 and 5) of the atmo-sphere, illustrating the dominance of dust aerosols in the lowest layers. Above the dust, elevated layers of biomass-burning aerosols are present at altitudes up to 4 or 5 km. Above the biomass-burning layer aerosol extinction falls
to negligible values. The mineral dust layers are distin-guished from the biomass-burning aerosol layers by the very low (even negative) Angstr¨om exponent (between 355 and 880 nm) in the first 2 km. The dust layer is also ac-companied by very high values of FAAM single-scattering albedo (0.96 to 0.98) (as consistent with Osborne et al., 2008) and a low values of water vapour mixing ratio (0.002 to 0.004). In contrast, several layers between 1 and 5 km show a higher Angstr¨om exponent (0.5–1.5), a lower single-scattering albedo (0.85–0.9 from FAAM) and a higher wa-ter vapour mixing ratio (0.004–0.007). These characwa-teristics can be related to tropical air masses where biomass burning aerosols are present. The lower, stable and thermodynam-ically well-mixed layer seems to prevent dust and biomass burning aerosols from mixing together. However, mixing of dust and biomass burning aerosol did occur further south from where the fires occurred, which led to an apprecia-ble amount of dust becoming lofted up into the “biomass-burning” aerosol layer (Johnson et al., 2008a). An analy-sis of back-trajectories (not shown in this study) has indi-cated that the high concentrations of mineral dust aerosols were predominantly due to emissions from the Sahara desert and arid parts of the Sahel on the North or East of Niamey (Chazette et al., 2007). Because of the vicinity of Niamey city, it is also likely that biomass-burning aerosols from lo-cal fires and urban and industrial aerosols mixed with the dust in the boundary layer. Biomass-burning particles stem from elevated layers that have been transported thousands of kilometers across the continent. They originate from intense agricultural burning of crop debris or grass during the dry season (e.g. Haywood et al., 2008).
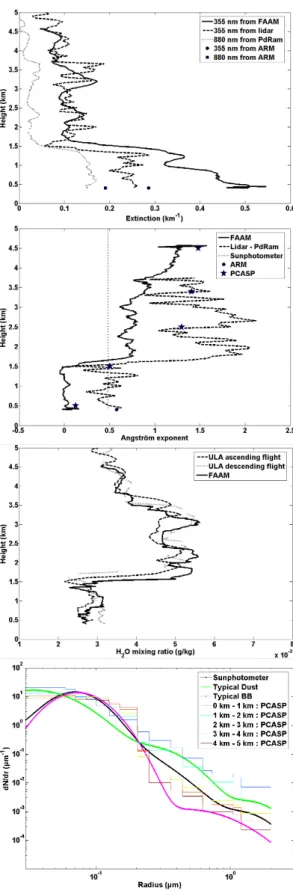
The ULA and FAAM profiles (Figs. 1–5) reproduce the main features of the aerosol profile, such as distinctive layers, quite consistently in the five selected case studies. However, several discrepancies can be observed in the extinction coef-ficient profiles. A good agreement is found in the biomass-burning aerosol layer, but not in the dust aerosols layer where the FAAM measurements are significantly higher. This overestimation in dust layers was also noted in Johnson et al. (2008b) and is attributed to over correction for anticipated loss of large particles in the nephelometer and PSAP. A com-parison with ARM extinction coefficients measured on the ground level shows that the ULA results are closer to surface
Fig. 1. Vertical profiles of aerosol extinction coefficient at 355
and 880 nm (a), Angstr¨om exponent from FAAM between 450 and 550 nm (nephelometer and PSAP), ULA between 355 and 880 nm (LAUVA and PdRam), AERONET between 440 and 870 nm plat-forms and PCASP size distribution with mean complex refractive indices (retrieved in this study) between 355 and 800 nm (b), wa-ter vapour mixing ratio from ULA and FAAM (c) observed in the case 1. Values derived from ARM data at the surface are reported by dots. Aerosol size distributions measured from the PCASP, from the sunphotometer (smooth black curve), for typical dust (smooth green curve) and for typical biomass-burning particles (smooth pink curve) for case 1 are also reported (d).
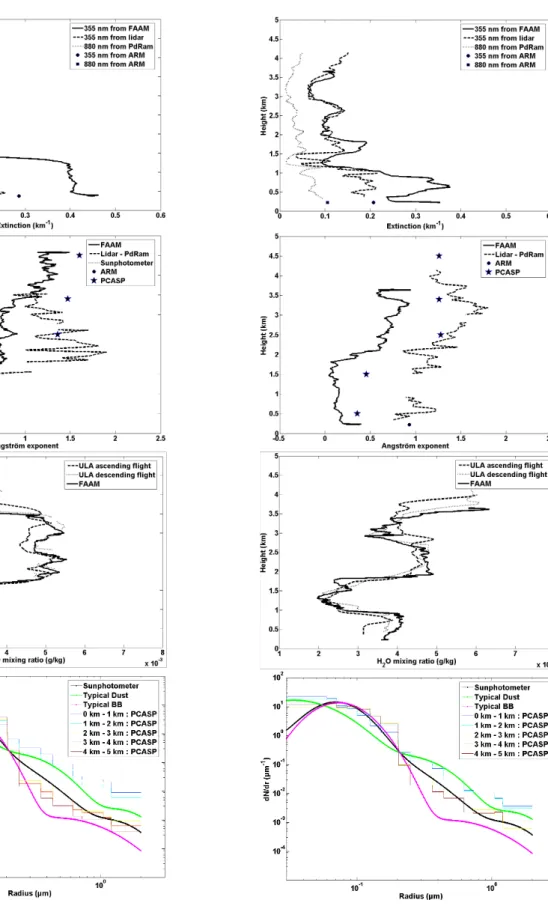
Fig. 5. Same as Fig. 1 for case 5.
measurements (within 15%), a further indications that the aerosol extinction coefficient derived from airborne neph-elometer and PSAP data was largely overestimated. This re-sult is in accordance with independent AOD measurements at 355 nm from Banizoumbou AERONET station (Table 1). The overestimation of FAAM measurements in the dust layer can lead to an optical thickness 33% higher than AERONET AOD (case 5) (Table 1). On the contrary, an underestima-tion of AOD by 18% is observed for ULA data in cases 1 and 3, whereas a very good agreement was found in cases 2 and 5 (within 7%). Extinction coefficient retrieved from li-dar has an absolute uncertainty of 0.02, which can explain the differences with AERONET AODs when integrated over the column. These differences may be partly explained by un-certainties associated with aerosol optical properties in both lidar and aircraft in situ measurements, or might be attributed to inhomogeneity of aerosol fields during the sampling. Nev-ertheless, we should bear in mind that the magnitude of the various biomass-burning aerosol layers are relatively stable and that the differences essentially occur in the sampling of large and aspherical dust particles. Uncertainty in the sam-pling efficiency of particles larger than about 1.5 µm in Rose-mont inlets and errors caused in correcting irregular scatter-ing phase functions by standard Andersen and Ogren method (Andersen and Ogren, 1998) can explain such uncertainties. This correction is based on the aerosol size distribution de-rived from the PCASP, which is limited in the detection of large particles whose contribution, especially over the desert, is clearly significant.
Adding to this uncertainty, there is quite a large dis-agreement between Angstr¨om exponents derived from the FAAM and from ULA, even if the distinction between aerosol layers is clear in both measurements. Generally the graphs of Angstr¨om exponent in Figs. 1 to 5 indicate that the sunphotometer-retrieved Angstr¨om exponent corre-sponds both to the column-integrated Angstr¨om coefficient as measured by the FAAM and to the value the ULA-derived Angstr¨om exponent attains in the mineral dust layer with a larger optical thickness. Nevertheless, this is no longer valid for case 5, where both ULA-derived and FAAM de-rived Angstr¨om exponents are in agreement but differ from the sunphotometer’s one. We have to note that the discrep-ancies can be due to the locations of the flights and to the wind direction. The FAAM aircraft typically covered a hor-izontal distance of 100km during deep profiles, whereas the ULA covered much shorter distances and the flight tracks were directly above Banizoumbou (case 3) or Niamey (cases 1, 2, 4 and 5). Wind measurements obtained on ARM site at the altitude of 6.5 m above the ground show that the pre-vailing winds blow from the northwest direction (∼330◦) on 26 and 28 January (cases 1 to 4) and from northeast direc-tion (∼50◦) on 1 February, which is typical of the Harmattan wind blowing over the Sahel in the dry season. Although the winds generally blew from the North, thus carrying mineral dust particles, a north-westerly wind can also bring a local
contribution of anthropogenic aerosols because Niamey air-port is located South-East from the Niger capital. Pollution with such a local origin superimposes to the dust cloud and can explain Angstr¨om exponent values slightly greater than 0 that have been observed on cases 1 to 4. This turns out to be a local phenomenon in Niamey, which is not representative of situations encountered in Banizoumbou where AERONET station is located.
3.2 Aerosol size distributions from FAAM PCASP and AERONET
The differences in aerosol properties between the dust and biomass-burning aerosol layers are partly related to differ-ences in the number size distributions, as observed by the PCASP instrument on the FAAM aircraft (Fig. 1d, Fig. 2d, Fig. 3d, Fig. 4d and Fig. 5d). The size distributions pre-sented in Fig. 1d, Fig. 2d, Fig. 3d, Fig. 4d and Fig. 5d have been normalized and averaged over layers 1000 m thick, be-cause the data is too noisy without some averaging. Every FAAM profile shows a similar structure in number size dis-tributions and a general decrease in coarse particle concentra-tions (with radii <0.3 µm) with altitude. AERONET volume size distribution retrieved from Dubovik inversion algorithm (Dubovik et al., 2000) have been converted in number size distribution and are also shown on Fig. 1d, Fig. 2d, Fig. 3d, Fig. 4d and Fig. 5d. The AERONET retrieval is representa-tive of the total aerosol column. AERONET measurements performed during 2006 and 2007 in Banizoumbou have also been used to extract typical size distributions for dust (40 cases found), selected by an Angstr¨om exponent lower than 0.2 and a single-scattering albedo larger than 0.92, and for biomass-burning particles (52 cases found) selected by an Angstr¨om exponent larger than 0.8 and a single-scattering albedo lower than 0.85 at 355 nm. The corresponding “typi-cal” size distributions have been modelled by log-normal dis-tributions and plotted on Fig. 1d, Fig. 2d, Fig. 3d, Fig. 4d and Fig. 5d. In biomass-burning layer, no coarse mode was ob-served: aerosols are dominated by small particles, between 0.05 and 0.3 µm in radius (r). AERONET typical biomass-burning log-normal distribution represents the predominant fine mode, containing 99% of the total number of particles. It has a modal radius of ∼0.08 µm with a standard devia-tion of 1.4. The typical biomass-burning aerosol size dis-tribution exhibits a sharp drop in size disdis-tribution between r∼0.15 and r∼0.3 µm, whereas the typical dust size distri-bution has a more continuous distridistri-bution with more domi-nant second and third modes. The typical dust log-normal distribution includes three modes: the first one with a mean radius r∼0.05 µm and a standard deviation of 1.8 represent-ing 94% of the particles, a second located at r∼0.3 µm and a third one for coarse particles at r∼1.6µm, both having a standard deviation of 1.6.
A good agreement is found between these typical size dis-tributions and aircraft measurements, except for case 5 where a disagreement can be noticed in the smaller number con-centrations of both second and coarse mode derived from AERONET retrievals when compared to the aircraft data. For all the case studies, the daily local AERONET size distri-bution is located between the typical size distridistri-butions of dust and biomass-burning aerosols, as one would expect since the atmosphere always contained both dust and biomass burning aerosol layers. These results suggest that it is necessary to clearly distinguish between dust and biomass-burning prop-erties in radiative transfer models to assess the radiative forc-ing of multi-layered structure of aerosols.
4 Determination of aerosol optical properties and sur-face albedo
4.1 Aerosol complex refractive index (ACRI) determina-tion
Measurements from the ULA, FAAM and AERONET have been used to retrieve ACRI using a variety of approaches. Each approach leads to a unique set of values for ACRI. 4.1.1 Approach 1 (A1)
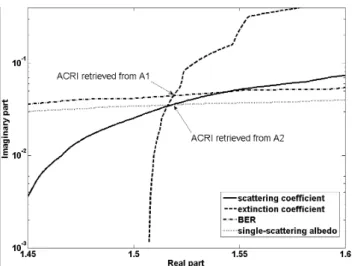
The determination of both real and imaginary parts requires two constraints. In approach A1 we have used the aerosol extinction coefficient and the BER at 355 nm as constraints. The principle of the retrieval method has already been de-scribed in Raut and Chazette (2007) and was applied to airborne measurements of vertical aerosol profiles in Paris (Raut and Chazette, 2008). Here, the methodology is quite similar but has been improved enabling both the real and the imaginary parts of ACRI to be derived in the same step. As described in Sect. 3, the first five kilometres of the atmo-sphere have been divided in five sections to allow the aver-aging of size distributions. At each height level, two look-up tables are built from a Mie model using the size distribution measured by the PCASP at the given altitude. A set of re-alistic ACRI values are used; real part are assumed to vary from 1.42 to 1.65 and imaginary parts are assumed to vary from 10−4 to 0.4. One of the look-up tables contains ues of the extinction coefficient and the other contains val-ues of BER. The solution is a unique ACRI value that pro-vides the same extinction coefficient as that measured by the LAUVA in horizontal shooting mode, and the same BER as the one retrieved by Chazette et al. (2007) as a function of altitude. BER values ranged from 0.025±0.006 sr−1in the dust layer to 0.008±0.003 sr−1in the biomass-burning layer. The ACRI result is given by the ACRI value at the intersec-tion of the extincintersec-tion coefficient and BER curves on Fig. 6. Note that BER is mainly sensitive to the imaginary part of ACRI, whereas the extinction coefficient is more sensitive to the real part of ACRI.
Fig. 6. Illustration of ACRI retrievals from methods A1 and A2:
ACRI couples satisfying both measured extinction coefficient and BER in retrieval method A1, and satisfying both scattering coeffi-cient and single-scattering albedo in retrieval method A2.
4.1.2 Approach 2 (A2)
A similar approach has been taken with the FAAM mea-surements but the scattering coefficient and single scattering albedo are used as constraints for the ACRI retrieval pro-cess. Calculations were performed to create a look-up table of scattering coefficients, real part sensitive, and a look-up table of ωo, principally driven by the imaginary part. When convergence was possible, this method provided a unique so-lution to ACRI imaginary and real parts in a similar manner to the A1 approach. The curve for aerosol scattering coeffi-cient is given by a solid line on Fig. 6 and the curve for ωois given by a dotted line on Fig. 6. Their intersection provides the ACRI determined from FAAM measurements.
4.1.3 Approach 3 (A3)
ACRI is routinely retrieved from inversions of AERONET sunphotometer clear sky Almucantar scans of radiance (Dubovik et al., 2002).
4.1.4 Approaches 4 (A4) and 5 (A5)
ACRI retrieval is not always possible since the aerosol load is too low (above 4 km for 28th January and 1st February) or because the size distribution cannot be efficiently deter-mined, mainly in the dust layer. Pinnick et al. (1976) indeed reported that the scattering may be modelled with some suc-cess using Mie code for spherical particles of particle size parameter (ratio of the particle circumference to the wave-length) less than about 5. For larger particles Mie theory can be used to model the near forward scattering, but at non-forward angles Mie theory mis-estimates the scattering. The radius measured by the PCASP may therefore be erroneous for large particles, since Mie scattering theory is implicitly
used to derive the radius from the intensity of scattered ra-diation measured by the PCASP and this assumes that all particles are spheres. It is well known that mineral dust parti-cles are predominantly non-spherical (Dubovik et al., 2006), which contributes to the particle miss-sizing.
As already mentioned in Sect. 3.1, scattering coefficients measured by the nephelometer can also be affected by the use of Mie theory in correction factors. Koepke et al. (1988) showed that in desert aerosol the nonspherical particles sys-tematically increase the equivalent spherical side scatter with a maximum around a scattering angle of 120◦, while around 160◦ the difference between scattering functions of spheres and nonspheres is small. In our study, the large and well-marked minimum at ∼120◦ in the scattering phase func-tion of spherical particles is not present in simulafunc-tions when spheroids particles are used. Hence, the case of spherical particles corresponds to a minimum for extinction and scat-tering cross-sections. We have to bear in mind that this re-sult is weakly dependent on the average size parameter and does not necessary apply to all possible size distributions. We have also to notice that, in our study, the scattering is overes-timated close to 180◦when assumption of spherical particles is done. The resulting scattering coefficient from airborne nephelometer is thus highly overestimated. In contrast, the extinction coefficient derived from lidar signal is slightly un-derestimated in comparison with the modelled one from size distribution. Chazette et al. (2007) stated that the relative un-certainty of the ULA-derived extinction is about 10% mainly due to signal noise and deviations in horizontality. The asso-ciated uncertainty in BER was 25%.
These reasons explain why algorithms developed for A1 and A2 approaches have never given any result in the dust layer, except for case 4 (Table 2). In the literature, stud-ies taking into account the nonspherical shape of the par-ticles can be found: aerosols might be spheroids, Cheby-shev particles, cylinders (Mishchenko, 1991), or spheres con-taining voids representing particles occupied by cracks and holes (Pinnick, 1976). We tried to model the aerosols as nonspherical shapes rather than spherical particles, but no differences were found between the results from the Mie model with spherical particles and Mishchenko T-matrix code (Mishchenko et al., 1996) using prolate and oblate par-ticles uniformly distributed over all the possible aspect ratios. This finding is contrary to the results of Perrone et al. (2004). However, Mishchenko et al. (1996) suggested that this phe-nomenon can occur when large numbers of randomly orien-tated particles in the sampling chamber are averaged, leading to a smaller error than for individual particle counting. It may be also due to the uncertainties in our measurements, espe-cially of size distribution, and the lack of knowledge on dust morphology. Thus, only Mie code is used in the following. It should be noted that this simplification may not lead to significant errors for a climate forcing calculation since inte-gration over the entire hemisphere is performed (Mishchenko et al., 1997).
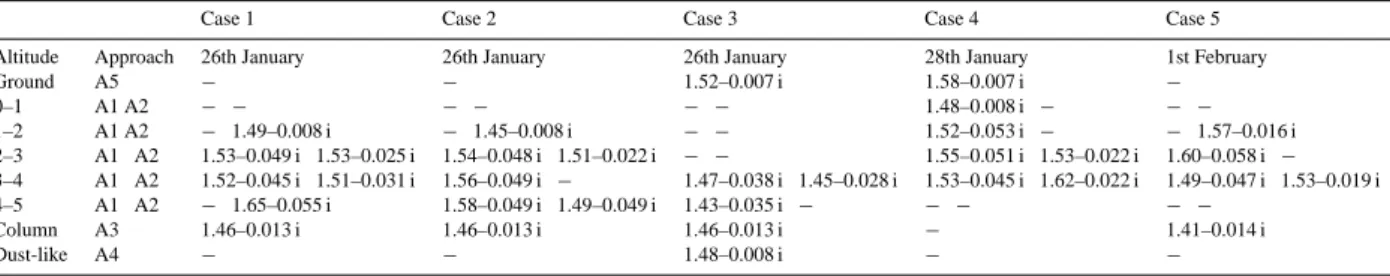
Table 2. ACRI values retrieved at 355 nm in 1km-thick layers from the ground (ARM data) to a height of 5 km for both A1 and A2
approaches. ACRI retrievals from AERONET inversion (A3) over the whole column have also been included, as well as a typical value deduced from a pure dust case.
Case 1 Case 2 Case 3 Case 4 Case 5 Altitude Approach 26th January 26th January 26th January 28th January 1st February Ground A5 − − 1.52–0.007 i 1.58–0.007 i − 0–1 A1 A2 − − − − − − 1.48–0.008 i − − − 1–2 A1 A2 − 1.49–0.008 i − 1.45–0.008 i − − 1.52–0.053 i − − 1.57–0.016 i 2–3 A1 A2 1.53–0.049 i 1.53–0.025 i 1.54–0.048 i 1.51–0.022 i − − 1.55–0.051 i 1.53–0.022 i 1.60–0.058 i − 3–4 A1 A2 1.52–0.045 i 1.51–0.031 i 1.56–0.049 i − 1.47–0.038 i 1.45–0.028 i 1.53–0.045 i 1.62–0.022 i 1.49–0.047 i 1.53–0.019 i 4–5 A1 A2 − 1.65–0.055 i 1.58–0.049 i 1.49–0.049 i 1.43–0.035 i − − − − − Column A3 1.46–0.013 i 1.46–0.013 i 1.46–0.013 i − 1.41–0.014 i Dust-like A4 − − 1.48–0.008 i − −
Because of these difficulties two alternative approaches have been established to determine ACRI values in dust lay-ers. The first alternative is to use a typical dust-like size dis-tribution from AERONET (see Sect. 3.2) along with ULA optical measurements of both BER and aerosol extinction coefficient (Approach 4, A4). The second alternative is to use the local size distribution measured by the PCASP at the lowest altitude level and try to find the consistent ACRI in Mie code with extinction coefficient and ωovalues observed on the surface (ARM site) (Approach 5, A5). This is similar to the A2 approach described in Sect. 4.1.2 except that the retrieval is constrained by ARM measurements of extinction coefficient and ωorather than FAAM measurements. 4.2 Extinction coefficient, single-scattering albedo and
asymmetry parameter
For each of the 206 wavelengths used in this study (equally spaced by ∼2.7 nm from 200 to 750 nm), vertical profiles of extinction coefficient, single-scattering albedo and asym-metry parameter have been assessed. In the A1 approach the extinction coefficient profiles have been determined from lidar-derived extinction coefficient profile at 355 nm and Angstr¨om exponent between 355 nm (LAUVA) and 880 nm (PdRam). For the A2 approach the same methodology has been applied with the Angstr¨om exponent for extinction, which was determined using a combination of PSAP and nephelometer data from FAAM aircraft (Sect. 3.1). Verti-cal profiles of single-scattering albedo and asymmetry factor have been obtained from Mie theory assuming the spectral independence of ACRI (Sect. 2.2.1). When ACRI retrieval did not converge to a solution, the ACRI at the nearest alti-tude has been used instead of it. The modelled Angstr¨om ex-ponent retrieved from the PCASP size distributions has been added to Figs. 1 to 5 (panels b). Although it cannot serve to discuss the validity of the measured extinction and scatter-ing coefficients (because the ACRI determination also needs those optical properties), it can be useful to show that the ACRI retrieval method does not trigger off significant bias in the Angstr¨om exponent. Finally, the A3 approach based on AERONET observations uses typical values for
single-scattering albedo, asymmetry parameter and Angstr¨om ex-ponent for biomass-burning and dust layers, as described in Sect. 4.1.3. These optical parameters are then interpolated over the whole wavelength spectrum. The vertical profile of the spectral extinction coefficient has been provided by the extinction (at 355 nm) from the lidar, but normalized so that it has the same AOD (Sect. 3.1), and Angstr¨om exponent as AERONET in the considered layer.
4.3 Spectral surface albedo
We used MODIS BRDF model parameters to combine the black-sky (BSA) and white-sky (WSA) albedos as a function of optical depth and hence calculate “actual” (albsurf) or
blue-sky albedos. This calculation was based on a look-up table containing values of the fraction of diffuse light provided by MODIS website and established with the help of the 6S code (Second Simulation of the Satellite Signal in the Solar Spec-trum, Vermote et al., 1997). The fraction of diffuse light f changes with solar zenith angle θ , optical depth AOD, and band wavelength λ. Spectral blue-sky albedos used in this study for radiative assessments have then been calculated by the equation:
albsurf(θ, λ,AOD) = WSA (λ) × f (θ, λ, AOD) + (1)
BSA (θ, λ) × (1 − f (θ, λ, AOD))
5 Aerosol optical properties and surface albedo results
5.1 ACRI results and discussion
Table 2 summaries ACRI values retrieved in 1 km thick lay-ers from the ground to a height of 5 km for both ULA and FAAM datasets. In the following subsections, the standard deviations given are due to the variability of the dataset. Notwithstanding sensitivity analyses based on a Monte Carlo approach have been performed to assess the uncertainty in the calculation of ACRI. In the computation of ACRI, there is not any propagation of errors since both the real part and the imaginary parts are retrieved in a unique step. This is the re-sult of a function minimization of two variables (Sect. 4.1.1).
In the case of A1 approach, the uncertainty on ACRI is due to the uncertainties on the extinction coefficient, BER and size distribution. In the case of A2 approach, the uncertainty on ACRI is due to the uncertainties on the scattering coeffi-cient, the single-scattering albedo and the size distribution. Hence, the fact that the different approaches do not constrain the optical parameters in the same manner has been implic-itly taken into account. It is as if the isopleths of Fig. 6 were surrounded by error bands. The total uncertainty is given by the surface delimited by the intersections of those bands. This could not be represented on Fig. 6 as the uncertainties on the size distribution correspond to a translation of the iso-pleths. Monte Carlo approaches have given a total uncer-tainty of 0.03 (0.04) on the real part and 0.006 (0.012) on the imaginary part of ACRI in case of A1 (A2) approach. In this particular case, A1 approach more effectively constrains ACRI values but we have to notice that this does not apply to all cases. The errors on ACRI due to the uncertainties of the measurements are lower than ACRI dataset variability, which is consequently significant.
5.1.1 In biomass-burning layer
The retrieval model reached convergence in most of the cases for the atmospheric layers above 2 km, i.e. in biomass-burning layers. In general, a good agreement is found for the real part of ACRI between A1 and A2. Not surprisingly, this result can be explained by the good correspondence of extinction coefficients determined by the lidar and airborne nephelometer in the biomass-burning layer. From approach A1, the mean real part of ACRI over the whole period has been assessed to 1.53±0.04. The variation of real part is slightly larger for the A2 approach and the mean real part is close to 1.54±0.06. The main discrepancies are observed for case 3, where the retrieved values of ACRI are lower for the A1 and A2 approaches. This discrepancy may be linked to uncertainty in the total number of particles mea-sured by the PCASP. Two artefacts also occur in the retrieval as a result of limitations in the aircraft data. In case 4 there is no nephelometer data above 3.7 km (Fig. 4), leading to a possible overestimated real part for A2 approach between 3 and 4 km where an elevated biomass-burning layer is ob-served by both LAUVA and PdRam measurements. The sec-ond artefact concerns the particles between 4 and 5 km for case 1. The aerosol concentration was low and the PCASP, nephelometer and lidar are not able to accurately characterise the aerosol. In the literature, real parts of ACRI for biomass burning aerosol range from 1.5 to 1.6 at visible wavelengths, as reported by the AERONET measurements in Remer et al. (1998). For instance, Haywood et al. (2003c) found a value of 1.54 by applying the Maxwell-Garnett mixing rule to measurements of aerosol chemical composition. Yama-soe et al. (1998) reported a value of 1.53±0.04 at 438 nm using Sun/Sky data measured by the AERONET radiometers in Brazil.
The imaginary part of ACRI is generally less well known than the real part of ACRI. Values of imaginary part de-rived from A1 (0.047±0.006) are significantly higher than imaginary parts provided by A2 (0.029±0.013). The large variability in A2-derived imaginary parts is due to large variations in single-scattering albedo values measured from FAAM; these varied from 0.79 to 0.91. This variability is mainly attributed to variability in the proportion of biomass burning aerosol and dust and variability in the black carbon content of the biomass burning aerosol component (John-son et al. 2008a). It is also important to bear in mind that some of the variation of single scattering albedo may be due uncertainties in absorption measurements by the PSAP occur during the conversion of light transmission through the filter into absorption coefficient. A1-retrieved imaginary parts are less variable than A2 values since imaginary parts are predominantly governed by BER, which is almost con-stant in biomass-burning layer over Niamey (Chazette et al., 2007). Values of 0.01 – 0.04 were found by several inves-tigators: Li and Mao (1990), Westphel and Toon (1991), Lenoble (1991), Anderson et al. (1996). During the SA-FARI campaign, Haywood et al. (2003c) found 0.025 for fresh burning aerosols and 0.018 in aged biomass-burning plumes at 550 nm, in accordance with the value 0.021 reported by Dubovik et al. (2002) in Africa savan-nah in Zambia. Guyon et al. (2003) calculated lower val-ues (0.013) but aerosols in Amazonian forest were measured during periods were ambient relative humidity was high (up to 80%). During INDOEX L´eon et al. (2002) retrieved an imaginary part of 0.03 for aerosol mainly originating from agricultural biomass burning. More recently, authors found higher imaginary parts in biomass-burning layers. Using a conservative value for the imaginary part of the index of elementary carbon (Haywood et al., 2003c), Schkolnik et al. (2007) found a reasonable fit between chemically-derived ACRI and optically-derived ACRI with the mean value 1.52– i 0.042 in Brazilian biomass-burning plumes. Wandinger et al. (2002) showed an excellent agreement between remote sensing and in-situ measurements in the center of a biomass-burning plume, yielding to rather high ACRI, ranging from 1.56–1.66 in real part and 0.05–0.07 in imaginary part in the visible domain.
If we assume that the biomass aerosols are an internal mix-ture between soot, organic matter and water soluble com-pounds then it is possible to assess the proportion of soot in the aerosol. Volz (1973) gives ACRI of 1.75–i 0.47 and 1.53–i 0.008 for soot and water soluble compounds, respec-tively. Water soluble and organic compounds have similar ACRI (Chazette and Liousse, 2001). Therefore, using the re-lation defined in Horvath et al. (1998), the soot proportion in the biomass aerosol can be assessed as 8%. Ackerman and Toon (1981), Faxvog and Roessler (1978) give a higher value for the imaginary part of ACRI of soot, close to 0.66, which would lead to an estimated soot proportion of about 6%.
5.1.2 In dust layer
Below 2 km, the retrieval model converged to a solution for ACRI for only a few cases. For 26th January, the ACRI re-trieval algorithm has given a result from the A2 approach, and indicates smaller values for ACRI than in the upper lay-ers, particularly for the imaginary part (0.008). However, the averaging of the size distribution between 1 and 2 km, implicitly introduced a mixing between biomass-burning aerosols and dust, located below 1.5 km. Consequently, they are not typical ACRI values for mineral dust particles. As indicated in Sect. 4.1.4, we tried two alternative methods for retrieving dust ACRI using either a typical dust size distribu-tion from AERONET (A4), or ARM surface measurements (A5). Convergence of the retrieval was obtained for cases 3 and 4 on 26th and 28th January using the ARM dataset (A5) and for case 3 when the AERONET typical dust size distribution was used (A4). It should be noted, however, that retrieving size distribution information for coarse particles is difficult with a maximum wavelength of 1020 nm and may result in relatively large errors in the AERONET retrieval. The four ACRI values determined in the dust layer (by any of the approaches described above) have been averaged to-gether providing a mean dust ACRI of 1.52 (± 0.04)–i 0.008 (±0.001) that will be used hereafter. A sensitivity study on the PCASP uncertainties was performed using Monte Carlo simulations based on 200 Gaussian random realizations. Un-certainties as large as 30% in the PCASP measurements lead to uncertainties of 0.003 on the imaginary part and 0.08 on the real part, which is not surprising given that size distribu-tion mainly governs scattering (particularly in forward direc-tion).
The mean value retrieved in our study (1.52–i 0.008) is very close to the value of 1.53–i 0.008 established by Volz (1973) at the same wavelength; the imaginary parts have identical values. Indeed, single-scattering albedo or BER (governing the imaginary part) are less affected by errors linked to the assumption of spherical particles than scatter-ing or extinction coefficients, which are more strongly linked to the real part. Our retrieved real part value (1.52) agrees in general with available dust measurements but the variability in the techniques and in dust composition lead to a disper-sion of about 0.05 in the literature (Patterson et al. 1977; Carlson and Benjamin 1980; Sokolik et al. 1993; Sokolik and Toon 1999). By employing the value 1.53 for the real part in remote sensing, Tanr´e et al. (1999) showed a good consistency of radiative transfer computations with measure-ments. It is also in accordance with several models, which suggest that the real part of the refractive index of dust is 1.53 for the visible spectral region (Shettle and Fenn 1979; WMO 1983; Koepke et al. 1997). The imaginary part of ACRI is more difficult to determine as Sokolik and Toon (1996) show variations over 3 orders of magnitude for different mineral dust components. Our retrieval (0.008) is consistent with the value given for the visible spectrum by several models
(Shet-tle and Fenn, 1979; WCP, 1986). The ACRI of 1.56–i 0.006 reported by Patterson et al. (1977) is broadly similar. We have to note however that studies showed lower imaginary parts, e.g. 0.003 by Levin et al. (1980) or 0.0015 by Hay-wood et al. (2003b).
5.1.3 AERONET retrieval of ACRI over the atmospheric column
ACRI values retrieved from the A3 approach are also listed in Table 2. These values are from AERONET retrievals in Ban-izoumbou and are integrated over the entire atmospheric col-umn. ACRI values representative of “pure” biomass-burning aerosols or “pure” dust have been extracted, together with their corresponding single-scattering albedo and asymmetry factor. AERONET ACRI retrievals are often lower than other results and close to the complex refractive index of water (Raut and Chazette, 2007); indeed AERONET gave values of 1.39–i 0.016 for biomass-burning aerosols and 1.44–i 0.002 for mineral dust. The retrieval for typical biomass-burning particles gave a single-scattering albedo of 0.8 and an asym-metry parameter in the range 0.74–0.75 and the retrieval for typical dust gave a single scattering albedo of 0.95 and an asymmetry parameter ranging from 0.79 to 0.80 at 355 nm. 5.2 Single-scattering albedo and asymmetry parameter 5.2.1 Single scattering albedo (ωo)
At a wavelength of 355 nm, ωorange from 0.78 to 0.82 (0.79 to 0.87) in the biomass-burning layer and from 0.9 to 0.92 (0.94 to 0.96) in the dust plume for A1 (A2) during the whole period. Smaller values obtained in the A1 approach are not surprising since imaginary parts of the ACRI were larger, suggesting there would be higher absorption. The A3 ap-proach gives a value of 0.8 for typical biomass-burning par-ticles, which is the same as for the A1 approach. For typical dust the A3 approach gives ωo∼0.95, which is similar to the value retrieved from the A2 aproach. From the 26th Jan-uary to the 1st FebrJan-uary, AERONET-derived ωo was 0.84– 0.85 at 438 nm and 0.90–0.91 at 871 nm. All the approaches suggest that the single-scattering albedo of dust increases with wavelength (0.97–0.98 at 550 nm for A2), in contrast to the biomass-burning layers where no net wavelength de-pendence can be detected (Bergstrom et al., 2003; Dubovik et al., 2002). This result is in accordance with Meloni et al. (2005) that showed values for dust from 0.81 at 415.6 nm to 0.94 at 868.7 nm, and for biomass-burning aerosols from 0.82 at 415.6 nm to 0.80 at 868.7 nm.
Values of ωo∼0.8 found in this study for the biomass-burning layers indicate a rather high influence of absorption of the particles and are consistent with the FAAM aircraft estimates from DABEX reported in Johnson et al. (2008a) showing ωo∼0.82 at 550 nm, although we are reporting val-ues at 355 nm. These findings are comparable with many
Fig. 7. Surface albedo at 12:00 local time in Niamey as a
func-tion of wavelength. The horizontal error bars represent the width of MODIS spectral bands. The vertical error bars are determined from the standard deviation obtained by averaging over the latitudes 13.47 to 13.48◦N and the longitudes 2.16 to 2.18◦E.
other studies. For example, fresh smoke particles showed ωo∼0.76 during SAFARI-2000 (Haywood et al., 2003c), 0.74–0.84 in Brazil (Reid and Hobbs, 1998). Aged biomass-burning aerosols have been observed with slightly higher val-ues: 0.83–0.92 during SAFARI (Haywood et al., 2003c), 0.80–0.84 in the case of Brazilian fires (Hobbs et al., 1997; Reid and Hobbs, 1998; Reid et al., 1998). Anderson et al. (1996) reported values of 0.79–0.81 for dry particles in African and Brazilian outflows over the South Atlantic. Heigher values of 0.85–0.90 were found for boreal fires (Radke et al., 1988) and for biomass-burning episodes in Southern Africa at 400 nm (Eck et al., 2003). During IN-DOEX, Randriamiarisoa et al. (2004) reported values of ωo between 0.89 and 0.93 at 400 nm.
The mean value retrieved for dust from the A1 approach is small at 355 nm (0.91) but in agreement with other studies. For example, Moulin et al. (2001) determined the dust ab-sorption and estimated ωoin the range 0.82-0.90 in the blue. Kaufman et al. (2001) obtained 0.88 on the coast of Senegal. From the A2 approach ωo was significantly higher (0.95), which is closer in agreement with value from the SHADE campaign (Haywood et al., 2003b). Tanr´e et al. (2001) de-rived ωo from AERONET measurements at the Banizoum-bou site, finding 0.95±0.03 at 441 nm. Sokolik and Toon (1996) presented results on the spectral dependence of ωo for various dust models. They found ωoaround 400 nm are in the range 0.62–0.95 and linked these large differences in ωovalues to size distribution and ACRI.
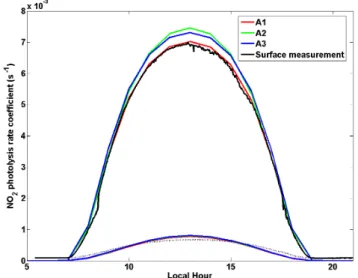
Fig. 8. Downwelling and upwelling NO2photolysis rate coefficient
computed from A1, A2 and A3 approaches using 16-stream discrete ordinates method. Black curves represent the J(NO2) measured by the optical actinometer in Niamey.
5.2.2 Asymmetry parameter (g)
In this study, g ranges from 0.71 to 0.73 (0.68 to 0.73) in the biomass-burning layer and from 0.73 to 0.75 (0.72 to 0.74) in the dust plume following A1 (A2) at 355 nm. The A3 approach gave values in the range 0.74–0.75 for typi-cal biomass-burning particles and values ranging from 0.79 to 0.80 for typical dust. Haywood et al. (2003b) reported g∼0.74–0.76 at 550 nm and g∼0.64 at 450 nm in dust layers indicating a strong spectral dependence of g with g decreas-ing with increasdecreas-ing wavelength.
5.3 Surface albedo
The spectral surface albedo at Niamey is reported on Fig. 7 at 12:00 UTC (Universal Coordinated Time, deviating from lo-cal noon from less than one hour), averaged over the latitudes 13.47 and 13.48◦N and the longitudes 2.16 and 2.18◦E. A sharp increase in spectral surface albedo is observed in the shorter wavelengths, which is in accordance with the visu-ally red-brown surface. We can note relatively small values in the visible spectrum: 0.12 at 550 nm.
6 UV-Visible aerosol radiative forcing
6.1 J(NO2) simulations
Downwelling and upwelling NO2photolysis rate coefficient
have been simulated for each approach (A1, A2 and A3) us-ing 16-stream discrete ordinates approaches and compared to optical actinometer measurements. Indeed, while the 4-stream discrete ordinates method may be appropriate to
simulate the irradiances, usually 4 streams are not sufficient for the calculation of photolysis rates, which requires a larger number of streams. Results have been plotted on Fig. 8 for case 5 because the 1st February was the only day presenting clear-sky conditions during the whole day. No significant dif-ferences can be observed in the modelled J(NO2)ubetween
the different approaches since values are relatively small. The discrepancies between modelled and observed photodis-sociation rates have not further been investigated, but can be partly due to the larger uncertainties on upward fluxes than on downward fluxes. The discussion below rather fo-cuses on the downwelling photodissociation rate. The mea-sured J(NO2)d is slightly noisy but the general shape of the
curve is easily discernible. All simulations follow the same curve, particularly in the morning (08:00–11:00) and evening (16:00–19:00). For smaller solar zenith angles differences clearly occur between the modelled and measured curves. Modelled J(NO2)d are found higher than the observed one,
suggesting that the downward flux has not been sufficiently attenuated through its path in biomass-burning and dust lay-ers in all the simulations. The best simulation of the photoly-sis rate of NO2molecule has been obtained using the A1
ap-proach with ULA-derived optical properties since the mod-elled J(NO2) photolysis rates superimpose on the measured
one within 1%, whereas the A3 approach gives within 5% discrepancy and the A2 approach gives within 12% discrep-ancy. This may be because the greater scattering coefficient in the dust layer was not compensated for by the low value of ACRI imaginary part found in the biomass-burning layer from the A2 approach. This low absorption in the biomass-burning layer does not attenuate the direct downwelling flux enough. Comparing A1 and A3, the main differences come from ωo and g because, in case of A3, spectral extinction profiles have been determined using ULA-derived extinction coefficient at 355 nm and Angstr¨om exponent for typical dust or biomass-burning particles. This suggests a good determi-nation of both ωo and g, and therefore of ACRI from A1. We have to note that, in this particular case, the differences observed in comparison with the 4-streams method are not clearly significant. This is linked to a compensation effect between the higher number of photons backscattered by dust in the upward direction and their absorption into the biomass-burning layer. Hence, for further discussions on irradiances in this paper, the A1 approach and 4-stream discrete ordi-nates method will be taken as the reference. This enables an assessment of the importance of a reliable synergy in provid-ing input parameters for radiative calculations.
6.2 Radiative forcing results and discussion
UV-visible radiative forcing results have been averaged over 24 h for the five cases studies, the three optical property retrieval approaches and the 4-stream discrete ordinates method. Results have been summarized in Table 3. The cor-responding daily evolutions of radiative forcings have been
Table 3. Radiative forcing results averaged over 24 h for the five
case studies, for the three ACRI retrieval approaches and the 4-stream discrete ordinates radiative transfer method.
Case 1 Case 2 Case 3 Case 4 Case 5 A1 1FTOA −2.2 −3.0 −2.6 0.2 0.4 A1 1FBOA −20.1 −22.9 −20.4 −19.5 −23.2 A1 1FATM 17.9 19.9 17.8 19.7 23.6 A1 RFE 33.1 30.2 31.8 36.5 54.9 A2 1FTOA −9.8 −10.1 −9.4 −8.1 −7.8 A2 1FBOA −25.3 −25.3 −23.9 −17.4 −19.7 A2 1FATM 15.5 14.9 14.5 9.3 11.9 A2 RFE 18.9 19.9 19.9 17.2 19.8 A3 1FTOA −2.8 −3.3 −3.4 −1.8 −1.8 A3 1FBOA −18.7 −22.6 −19.3 −17.0 −15.5 A3 1FATM 15.9 19.3 15.9 15.2 13.7 A3 RFE 24.5 29.7 24.4 28.1 29.8
plotted on Fig. 9. The AODs corresponding to these calcu-lations are shown in Table 1 (A1 uses ULA AOD, A2 uses FAAM AOD, A3 uses AERONET AOD).
6.2.1 Major features
The daily averages reported on Table 3 are lower than the instantaneous radiative forcings on Fig. 9, since the integra-tion over the whole day also takes into account the nighttime period. The global retrieved uncertainty on the radiative im-pacts is only of order 3 W/m2, which is comparable to the day-to-day variability in TOA and BOA radiative impacts. Such a small uncertainty is due to a compensation of uncer-tainties in both the size distribution and the complex refrac-tive index. As a matter a fact, when size distribution is un-derestimated (resp. overestimated), the retrieved ACRI, and particularly the real part, is overestimated (resp. underesti-mated) so as to converge towards the measured constraints of scattering/extinction coefficients, single-scattering albedo and BER. The resulting change in the spectral single scat-tering albedo and asymmetry parameter is small. Therefore, the errors on PCASP measurements do not clearly affect the spectral retrieved optical properties and as a consequence the radiative effects. Finally, the uncertainty in radiative effects due to uncertainties in the measurements is of the same order of magnitude in the dust layer than in the biomass burning layers.
The following results are given for the reference method. The mean value over the 5 case studies of the solar energy depletion at the surface by both dust and biomass-burning aerosols is −21.2 (±1.7) W/m2. During daytime, when the solar zenith angle is lower than 70◦, the radiative impact on the surface reaches −60 W/m2(Fig. 9). The surface energy budget must be balanced, and thus latent and sensible fluxes will reduce to compensate for this decrease in the net radia-tive flux. This can affect convecradia-tive processes and cloud
Fig. 9. Daily evolution of radiative forcings at the surface, TOA and
in the atmosphere for the three approaches. A1, A2 and A3 using the 4-stream discrete ordinate method.
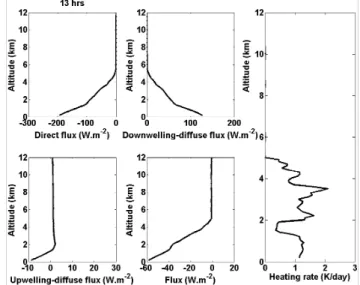
Fig. 10. Vertical profiles of the net radiative fluxes (direct, downwelling-diffuse, upwelling-diffuse and total) obtained on the 26th January (case 2) at 13:00 local time. Aerosol heating rate is also plotted as a function of height with a vertical resolution of 100 m.
formation. At the TOA, the radiative effects are close to zero (mean value of −1.4 W/m2):1FTOA is generally
neg-ative, indicating a potential cooling of climate, but can be-come slightly positive with the A1 approach for cases 4 and 5. However these (absolute) values are lower than in pre-vious studies. Johnson et al. (2008b) found a TOA radia-tive forcing of −9.8 W/m2 from FAAM aircraft measuments averaged over the DABEX experiment. The A2 re-sults give very similar rere-sults to Johnson et al. (2008b) in-cluding the near-infrared wavelengths, which is encouraging since they are based on FAAM data. During the SAFARI-2000 campaign in South Africa the normalized 1FTOA by
unit optical depth at 500 nm was estimated to be between −3 and −5 W/m2 (Myhre et al., 2003), which is closer to our results from the A1 and A3 approaches (AOD∼0.4 at 500 nm in our study), although higher results should be expected in our study given the presence of dust particles that absorb less efficiently than biomass burning particles. The low radiative forcings at TOA over Niamey can be partly attributed to relatively high absorption properties in the biomass-burning layer (Sect. 5.2.1), preventing a part of the upwelling diffuse flux from returning to space. This is con-firmed by the large atmospheric forcing, with a mean value of 19.8±2.3 W/m2, indicating the absorption of solar radi-ations in the atmosphere. 1FATM can reach 60 W/m2
dur-ing the day (Fig. 9). Accorddur-ingly, Pace et al. (2005) found a daily average atmospheric radiative forcing varying be-tween 21.6 and 25.7 W/m2for forest fire over the Mediter-ranean basin in the same wavelength interval (0.3–0.8 µm) and a similar columnar amount of aerosols (AOD∼0.4 at 416 nm). Figure 10 shows that the atmospheric heating rate

![[PDF] Introduction aux bases de donnees informatiques pdf | Cours informatique](data:image/gif;base64,R0lGODlhAQABAIAAAP///wAAACH5BAEAAAAALAAAAAABAAEAAAICRAEAOw==)