HAL Id: hal-03119615
https://hal.archives-ouvertes.fr/hal-03119615
Submitted on 25 Jan 2021
HAL is a multi-disciplinary open access
archive for the deposit and dissemination of
sci-entific research documents, whether they are
pub-lished or not. The documents may come from
teaching and research institutions in France or
abroad, or from public or private research centers.
L’archive ouverte pluridisciplinaire HAL, est
destinée au dépôt et à la diffusion de documents
scientifiques de niveau recherche, publiés ou non,
émanant des établissements d’enseignement et de
recherche français ou étrangers, des laboratoires
publics ou privés.
Emission factors of hydrocarbons, halocarbons, trace
gases and particles from biomass burning in Brazil
Ronald Ferek, Jeffrey Reid, Peter Hobbs, Donald Blake, Catherine Liousse
To cite this version:
Ronald Ferek, Jeffrey Reid, Peter Hobbs, Donald Blake, Catherine Liousse. Emission factors of
hydrocarbons, halocarbons, trace gases and particles from biomass burning in Brazil. Journal of
Geophysical Research: Atmospheres, American Geophysical Union, 1998, 103 (D24), pp.32107-32118.
�10.1029/98JD00692�. �hal-03119615�
JOURNAL OF GEOPHYSICAL RESEARCH, VOL. 103, NO. D24, PAGES 32,107-32,118, DECEMBER 27, 1998
Emission factors of hydrocarbons, halocarbons, trace
gases and particles from biomass burning in Brazil
Ronald J. Ferek, Jeffrey S. Reid, and Peter V. Hobbs
Department of Atmospheric Sciences, University of Washington, Seattle
Donald R. Blake
Department of Chemistry, University of California-Irvine, Irvine
Catherine Liousse
Centre des Faibles Radioactivit6s, Laboratoire Mixte CNRS-CEA, Gif-Sur-Yvette, France
Abstract. Airborne measurements of the emissions of gases and particles from 19 individual forest, cerrado, and pasture fires in Brazil were obtained during the Smoke, Clouds, and
Radiation-Brazil (SCAR-B) study in August-September 1995. Emission factors were determined for a number of major and minor gaseous and particulate species, including carbon dioxide, carbon monoxide, sulfur dioxide, nitrogen oxides, methane, nonmethane hydrocarbons, halocarbons, particulate (black and organic) carbon, and particulate ionic species. The magnitude of the
emission factors for gaseous species were determined primarily by the relative amounts of flaming and smoldering combustion, rather than differences in vegetation type. Hydrocarbons and
halocarbons were well correlated with CO, which is indicative of emissions primarily associated with smoldering combustion. Although there was large variability between fries, higher emission
factors
for SO
2 and
NO x were
associated
with an increased
ratio
of flaming
to smoldering
combustion; this could be due to variations in the amounts of sulfur and nitrogen in the fuels. Emission factors for particles were not so clearly associated with smoldering combustion as those for hydrocarbons. The emission factors measured in this study are similar to those measured previously in Brazil and Africa. However, particle emission factors from fires in Brazil appear to be roughly 20 to 40% lower than those from North American boreal forest fires.
1. Introduction
Emissions from biomass burning cause significant perturbations in certain trace gas and particle concentrations
in the Earth's atmosphere [Intergovernmental Panel on
Climate Change (IPCC), 1995]. Although carbon dioxide is
the most abundant component of biomass burning emissions, a wide variety of other compounds that are important in global
atmospheric chemistry are also emitted. Hydrocarbons,
produced during oxygen-poor smoldering combustion, are
thought to influence tropospheric ozone concentrations over
much of the globe [Fishman et al., 1996; Roelofs et al., 1997]. Halocarbons, such as methyl chloride and methyl bromide, may influence stratospheric ozone concentrations [Cicerone,
1994]. Other important trace gases, such as CO, NO x, and SO 2, are also emitted in globally significant quantities by biomass burning [Andreae, 1991; Fearnside, 1991].
Particles emitted from biomass burning, which are
composed primarily of organics and black carbon, play an important role in the Earth's radiation balance through their direct scattering and absorption properties and their effects on the microphysical structures of clouds [Hobbs and Radke,
1969; Kaufman et al., 1990; Christopher et al., 1996]. Copyright 1998 by the American Geophysical Union.
Paper number 9811900692. 0148-0227/9 8/9 8JD-0069 2509.00
Gas-to-particle conversion of hydrocarbons, NO x, and SO 2 may further alter the radiative and cloud-nucleating properties of smoke aerosols.
Although the emissions from biomass burning of many of the aforementioned species have been estimated in a number of previous studies of laboratory controlled and natural fires, relatively few data have been collected from individual fires in South America, which account for roughly one third of worldwide biomass burning emissions [Andreae, 1991]. In addition, relatively little is known about the influence of different vegetation types on the mixture of chemical species emitted from biomass fires in Brazil.
In August and September 1995 the University of Washington (UW) Cloud and Aerosol Research group, with its Convair C-131A research aircraft, participated in the Smoke, Clouds, and Radiation-Brazil (SCAR-B) field project. The goal of SCAR-B was to obtain measurements of the physical, chemical, and radiative properties of the palls of smoke that cover millions of square kilometers of the Amazon Basin and the cerrado regions of Brazil during the burning season. This paper focuses on the emission factors of gases and particles for flaming and smoldering combustion of cerrado (brush and scrub forest), grass (or pasture), and rain forests in Brazil.
2. Experiment
Gases and particles within 4 min of emission were measured from individual biomass fires aboard the UW research aircraft
32,108 FEREK ET AL.: EMISSION FACFORS FOR BIOMASS BURNING
by a variety of airborne techniques during SCAR-B [tlobbs, 1996]. Several of the relevant techniques are described briefly below.
2.1. Sampling
Instrumentation was carried aboard the UW research aircraft for both continuous and intermittent grab-bag sampling.
Much of the instrumentation for the aerosol measurements,
and some of the gas measurements, required sampling times longer than it typically took the aircraft to penetrate individual smoke plumes. Therefore in order to collect smoke from plume samples, we employed a grab-bag technique, in
which
a 2.5 m 3 electrically
conducting
plastic
(Velostat)
bag
was rapidly filled by ram air. With a 12 s fill time, the bag
sampler could capture a large volume of concentrated smoke
from which filter samples were subsequently drawn. Particle size measurements were also made on the bag samples. The grab-bag system had an aerosol 50% cut point diameter of about 4 grn (PM4). Larger particles are lost in the inlet and on the walls of the grab bag during filling. The cut point was determined from data collected on many previous field projects in which aerosol mass concentrations derived from filters fed from the grab bag were compared with mass concentrations derived from measurements of the aerosol size spectra.
To minimize losses of particles to the walls of the grab bag, sample volumes were generally not allowed to exceed one-third the volume of the bag. In addition, a valve on the continuous gas analyzer manifold could be briefly switched to the bag to obtain measurements on a bag sample. All of the measurements from the grab bag were correlated with measurements from the continuous sampling instruments by averaging the latter over the time period for which a grab-bag
sample was collected.
A slightly different approach was used for obtaining whole
air samples in electropolished stainless steel canisters. To
avoid hydrocarbon contamination from the plastic bag material, whole air samples were obtained from a stainless steel inlet attached to a metal bellows pump. The canisters were pressurized during the time the aircraft penetrated a plume. Although roughly concurrent with the grab-bag samples, the canisters took about 45 s to fill, and often, two penetrations of a plume were required to obtain sufficient sample. Care was taken to quickly maneuver the aircraft back into the same portion of the plume penetrated in the first pass. Since the time between penetrations was approximately 2 min and the two locations within approximately 100 m of each other, the uncertainties involved in sampling slightly different regions of the smoke plume are probably small. Since the air sampled was not identical to that captured in the bag, hydrocarbon and halocarbon concentrations were ratioed
to the above-ambient
concentrations
of CO
2 measured
in the
canisters,
and normalized
to the above-ambient
CO
2
concentrations measured in the bag by the continuous
analyzers. This provided data that were comparable to the particle species measured in the grab bag. Background
samples were obtained just upwind of the fires and subtracted
from the concentrations measured in the smoke samples. From these measurements of all the major carbon-containing
species
in a smoke
sample
(CO, CO
2, CH
4, NMHCs, black
carbon, and organic aerosol), emission factors for all of the measured species could be calculated.
2.2. Gas Measurement Techniques
Gaseous species routinely measured aboard the UW C-131A
aircraft included CO 2, CO, NO x, NO, and SO 2. Continuous measurements were made of these species using the following
methodologies:
NO and NO
x with a modified
Monitor
Labs
model 8840 chemiluminescent analyzer (uncertainly of +2
ppb), CO with a Teco model 48 infrared analyzer (uncertainly of +100 ppb), CO 2 with a Teco model 41H infrared analyzer (uncertainly of +4 ppm at 350 ppm), a Li-Cor model LI-6262 infrared analyzer (uncertainly of +0.3 ppm at 350 ppm), and
SO 2 with a Teco model 43S pulsed-fluorescence
analyzer
(uncertainly
of +4 ppb). Calibration
of the CO and CO
2
instruments was carried out during each flight using a commercial standard mixture (400 ppm CO2/15ppm CO,
Scott-Marrin, Inc.) and zero air stored in passivated aluminum
cylinders. Calibration of the SO 2 and NO x instruments was
carried out periodically in the field with a commercial standard
mixture
of SO
2, and
NO in ultrapure
air (Scott-Martin,
Inc.).
The stability of the mixture and calibration of the instruments
over a range of concentrations were checked before and after the field program using a combination of permeation tube standards and high concentration cylinder standards (5 ppm
SO
2, NO, and
NO 2 in ultrapure
N 2, Scott-Marrin,
Inc.) diluted
to 10-200 ppb with zero air. While the instruments used to
measure
CO
2, NO
x, and
03 had short
enough
response
times
to
permit continuous sampling during a plume penetration, CO and SO 2 concentrations could only be obtained reliably by switching the inlet to the gas monitors over to grab-bag samples. In this study all of the continuous gas instruments had signal-to-noise ratios of the order of 10:1 to 100:1.
The whole air samples collected in the stainless steel
canisters were sent to the University of California, Irvine, and
analyzed by gas chromatography using a flame ionization
detector (FID) [Blake et al., 1996]. For each sample,
concentrations
of CO
2, CO, CH
4, and hydrocarbons
(C<11)
were measured. Typically, about 21 NMHC species were identified which accounted for more than 70% of the total mass of volatile organic carbon (VOC) measured in a sample. An
additional 30-50 small unidentified peaks (probably mostly
NMHC but also containing some oxygenated species and other short-lived organic compounds) were also usually measured. To derive an accurate total organic carbon vapor concentration
for inclusion in the carbon budget, the total carbon in VOC
was determined by integrating the area of all peaks between the C-2 and the C-11 region and dividing this area by the methane response factor. Measurement precisions for alkanes, alkenes, alkynes was 2% or 8 ppt, whichever was
larger.
Concentrations of five halocarbons were determined from the canister samples using gas chromatography with an electron capture detector. These were CH3C1, CHC13, CH3I, CH3Br, and CHBr 3, which were measured at precisions of 1.2,
12, 12, 8, and 12%, respectively.
2.3. Particle Measurement Techniques
Particles were collected on both quartz and Teflon filters.
The Teflon filters were gravimetrically analyzed in a humidity controlled chamber (RH = 35%) to determine the ambient aerosol dry mass concentration. From control and field blank filters, we estimate that the uncertainty in the mass
FEREK ET AL.: EMISSION FACFORS FOR BIOMASS BURNING 32,109
gg. By comparison, the typical filter loading for smoke samples was always greater than 100 gg.
After gravimetric analysis the Teflon filters were extracted
in deionized water and analyzed by standard ion chromatography (IC) techniques. This analysis yielded the
following
ions:
Ca
2+, CI-, K +, Mg
2+, Na
+, NH,•,
NO•, NO•,
PO•,
SO•,
and
C20•(oxalate
). Ca
2+,
Na
+, r +, SO•, and
C20
•
were determined to have an uncertainty of +3% or better and
were always more than five standard deviations above the detectable limits. All other species were measured to have an
uncertainty +10% or better.
Aerosol samples collected on the quartz filters were used to
determine the atmospheric particulate carbon concentration by
thermal analysis [Cachier et al., 1989]. Filters were subjected to HC1 vapors for 24 hours to remove any carbonate. The total carbon (TC) content of the sample was determined though
coulometric titration. The black carbon (BC) content of the aerosol was determined through coulometric titration after the
sample was thermally pretreated at 340øC for 2 hours to remove any organic carbon (OC). The OC content of the aerosol was assumed to be the difference between the TC and
the BC. Because of negative artifacts that develop when using
this technique on biomass burning aerosols, all BC values were adjusted upward by 25%. This correction was necessary because BC can be combusted at lower than expected
temperatures due to catalytic reactions with Na and K [Novakov
and Corrigan, 1995]. A complete discussion an the error analysis of the BC measurements performed in SCAR-B is
given by Reid et al. [this issue (b)].
2.4. Calculations of Emission Factors and
Combustion Efficiencies
Smoke samples from individual plumes were obtained for a
variety of vegetation types in different regions of Brazil. In each case, visual observations and photographs of the fuel type and fire phase (flaming or smoldering) were made. Fire
fuels were divided into three categories: grass (or pasture),
cerrado, and forest.
Emission factors for gases and particles were calculated from the carbon balance method [Ward et al., 1982; Radke et al., 1988]. The underlying premise of this method is that all of the carbon combusted in a fire and released to the atmosphere
is emitted into the smoke plume in five forms of carbon (CO 2, CO, CH 4, nonmethane hydrocarbons (NMHCs), and particulate carbon (PC)). The emission factor of a species X is calculated
from the ratio of the mass concentration of that species to the
total carbon concentration emitted in the plume:
EF(X)
=
[X]
(1)
[C]co
2 '•-[C]co
'•-[C]cg4
+ [C]NMHC
+[C]pc
Thus the emission factor is expressed in units of grams of X emitted per gram of carbon burned. To convert this emission factor to units of grams of X emitted per gram of fuel burned,
the EF is multiplied by the mass fraction of carbon in the fuel, if it is known. Typically, the carbon content of woody fuels
varies from 45 to 50% [Susott et al., 1997]. Because we did
not have data on the actual carbon content of the various fuels
that produced the smoke we studied, in this paper, emission
factors are expressed either in units of grams of X emitted per kilogram of carbon burned (g/kgC) or in units of grams of
carbon in X emitted per kilogram of carbon burned
(g(C)/kg(C)).
Ward and Hardy [1991] define the combustion efficiency (CE) as the ratio of carbon (C) emitted as CO 2 to the total
carbon emitted:
CE
=
[C]cø=
(2)
It]co=
+It]co
+[C].c
+It]pc
where the subscript HC indicates the total unburned
hydrocarbons (methane and NMHC). Thus CE is the fraction of fuel carbon emitted which is completely oxidized to CO 2. Combustion efficiency is a useful way to quantify the relative amounts of flaming and smoldering combustion. When CE _> 90%, a fire is generally in the flaming phase, and when CE _< 90%, it is in the smoldering phase [Ward and Hardy, 1991]. The smoke emitted from most of the fires we studied derived
from both flaming and smoldering combustion, which we refer to as "mixed phase" smoke.
Although the CE is a useful quantity for fire models, in experimental studies it is often difficult to measure all the individual carbon species in the emissions. As will be shown below, the emission of CO is closely linked to the emission of
HC and PC. Therefore in this study we have chosen to use the modified combustion efficiency (MCE) as the principal
quantity to describe the relative amounts of flaming and smoldering combustion [Ward and Hao, 1992]. The modified combustion efficiency is defined as
MCE
-- [C]cø=
(3)
[C]co=
+[C]co
Since NMHC and particulate carbon are emitted in relatively small quantifies relative to CO 2 and CO, the difference between CE and MCE is typically only a few percent. For the SCAR-B data set, combustion efficiency and modified combustion
efficiency are related by
CE=
MCE-0.18
(r
2 = 0.99)
(4)
0.823. Results
Sampling of smoke from individual fires for the purpose of determining emission factors was generally done at an altitude
of about 500 m above the fires. Since visibility was usually poor (<4 km) in the boundary layer, we were able to detect and
obtain measurements only on the larger fires that had a visible
plume extending above the low-level haze layer. The measurements obtained yielded emission factors on 24 samples from 19 individual forest, cerrado, and grass fires. For some of the forest fires, we were able to sample both the flaming and the smoldering phases of the same fire.
Six samples for emission factor determinations were
obtained from four cerrado fires (one outside Brasflia and three near Cuiabfi). Because of the nature of the fuels (small and
dry), modified combustion efficiencies were above 90%, with an average of 0.94. Aerosol mass concentrations (PM4) in the plumes at the level of our measurements varied from 60 to 450
32,110 FEREK ET AL.: EMISSION FACFORS FOR BIOMASS BURNING
gg m '3 above ambient
(background
concentrations
ranged
from 20 to 50 gg m'3).
Six samples for emission factor determinations were
obtained from five grass (pasture) fires (two near Brasflia, one
near Porto Velho, and two near Marabe). Like the cerrado,
grass fires consume small and dry fuel and thus have high combustion efficiencies (average MCE = 0.94). Excess particle mass concentrations (PM4)in these smoke plumes
ranged
from 130 to 500 gg m '3 (background
concentrations
ranged from 30 to 80 gg m'3).
Twelve samples (six flaming and six smoldering) for emission factor determinations were obtained in ten forest
fires (three near Porto Velho and seven near Marab•).
Modified combustion efficiencies for these samples varied from 0.84 to 0.98, with an average of 0.89. The forest fires was divided into forest flaming (MCE>0.90) and forest smoldering (MCE<0.90). The average MCE for flaming and smoldering samples was 0.94 and 0.87, respectively. Fuel for
the forest fires varied from slash to standing forest. Smoke
aerosol
concentrations
(PM4)
ranged
from
200 to 3400
gg m
'3
(background
concentrations
ranged
from 30 to 80 gg m-3). In
all cases when the MCE was less than 90%, the smoke was
from mixed phase combustion.
A summary of the derived emission factors is given in Table
1 for cerrado, grass, and forest-flaming and forest-smoldering
fuels. For flaming
combustion,
CO
2 accounted
for 90% of the
carbon released to the atmosphere, followed by 5% in the form of CO. The remaining 5% was roughly equally partitioned
between hydrocarbon and particulate carbon species. There is a statistically significant increase in the emission factors of methane from the flaming combustion of forest fires compared to cerrado and grass fires. As the forest fires evolved from flaming to smoldering combustion, there was a very large shift in the carbon budget into incomplete products of
combustion (such as CO, NMHC, and particulate carbon). 3.1. Gas Emission Factors
In general, the emission of hydrocarbons is associated with smoldering combustion (i.e., oxygen-starved, inefficient 6onsumption of the fuel). Typically, the concentration of
total NMHC was better correlated with CO (Figure lb) than
with CO 2 (Figure la) regardless of the type of vegetation. Similar behavior was true for most individual hydrocarbon
species. In addition, individual hydrocarbon species were
typically very well correlated with each other (Figure 2).
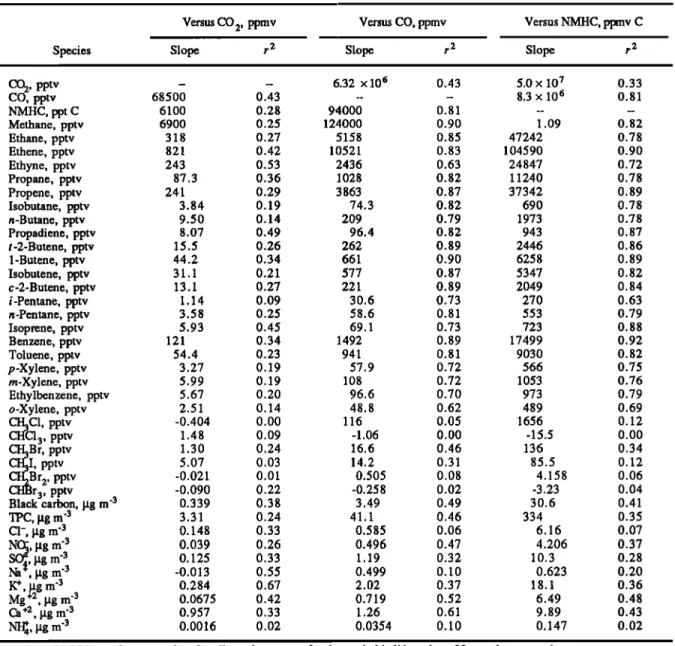
Table 2 shows a list of regression relations for the
above-background concentrations of various individual hydrocarbon species versus the above-background
concentration
of CO
2, CO, and NMHC. The individual
HC
species were emitted in relatively constant ratios regardless of vegetation type. Thus if the emissions of CO are measured
from a biomass fire in Brazil, the emission of hydrocarbons,
methyl bromide, and particulate species can be deduced rather
accurately.
Figure 3 shows the variation of the emission factor of total
NMHC with combustion efficiency. Almost a tenfold
variation of emissions occurred across the range of
combustion
efficiencies
measured
d•ring SCAR-B. This
behavior has a significant impact on our ability to predict
emissions of trace hydrocarbon species from estimates of biomass burned. Although techniques for estimating the
global amounts of biomass burned have improved in recent years [Levine et al., 1995], better global and regional estimates of trace species emitted will require a quantitative understanding of combustion efficiency and fire behavior as it
varies across biomass types and regions.
The halocarbons exhibited a somewhat more complicated
emission pattern than the NMHC. Of the five species measured, only CH3Br was fairly well correlated with
combustion efficiency (Figure 4) and appeared to have an unambiguous biomass burning source. In addition, it exhibited a behavior similar to the other hydrocarbons (i.e., a clear association with smoldering combustion). This is
contrary to the results reported by Mano and Andreae [1994],
who associated the emission of methyl bromide with the flaming phase of combustion for African savannah grasses burned in a laboratory. In a subsequent study of savannah fires in Africa, Andreae et al. [1996] found methyl halide emissions well correlated with CO, indicating an unambiguous association with smoldering combustion.
For the SCAR-B results, CH3C1, CHC13, and CH3I also appeared to have a biomass burning source but were less well
correlated with combustion efficiency. These species all had a
large group of data points that were well correlated with CO. However, there were a few extraneous data points that
significantly
reduced
the regression
coefficient
(r 2) to under
0.1. It is unclear whether these outliers were a result of measurement error or are due to variations in the chloride and
iodide content of the fuel. CH2Br 2 and CHBr 3 appeared not to
have a significant biomass source.
Table 1. Average Emission Factors, With Mean Standard Error in Parentheses, in g C/kg C Burned for
Various Types of Individual Fires in Brazil
Total
Fuel Type Particulate Black
(No. of samples) IED 2 OD NMHC Ot 4 PM 4 Carbon Carbon
Grass 927 56 6 3.1 16 11.5 1.3 (n=6) (56) (15) (1.3) (2.4) (7.4) (4.4) (0.9) Cerrado 928 57 7 3.7 9.6 6.6 1.0 (n =6) (30) (28) (2.4) (2.7) (4) (2.8) (0.4) Forest-flaming 913 60 7 7.9 16 10.2 1.1 (n=6) (34) (28) (3.3) (3.9) (7.5) (5.7) (0.4) Forest-smoldering 831 120 17 12.5 26.6 19.4 1.5 (n=6) (22) (13) (8.1) (6.1) (11) (7.8) (0.9)
FEREK ET AL.' FJVIIS SION FACTORS FOR BIOMASS BURNING 32,111 1.4 1.2 '• 0.8 o 'l- Z 0.6 o 0.4 0.2
('a)'
•" [NMHC]=0.13
. 0.0061
[CO2]
(r•=0.28)
... • ... .e. ... : ... , ... i ... ;'"! ... i ... • ... '; ... • V :' ; •' 'i [] Cerrado ... ?[]-v- ... ; ... 'r ... ';- ß Grass [] i e ß i ß Rain Forest 20 40 60 80 100 20 Excess CO e (ppmv) 1.4 'b' ' ! • •( ) .-4-- [NMHC]=0.07
. 0.094
[CO] (r•:0.81)
1.2 ... ©--- E 1 o 0.8 ... • ... . ... • ... • ... • ... [ ...z o.• ...
i ...
::'";
...
[ ...
] ...
[ ...
• 0 4 ... •-i ... -• ... i ... i ... i ... 0.2 [- ... ': ... i ... ': ... •-' ß Grass •][ [] ee ::
::
::
:: ß Rain
Forestit
0 2 4 6 $ 10 12 Excess CO (ppmv)Figure 1. (a) Total excess (i.e., above background)
nonmethane hydrocarbon (NMHC) concentration versus
excess
CO
2 in smoke
from
21 individual
fires
in Brazil. (b) As
for Figure l a but NMHC versus excess CO.
SO
2 and NO
x exhibited
behaviors
opposite
to that of the
hydrocarbons, in that their emission factors increased with
combustion efficiency (Figure 5). Their production was
associated weakly with the flaming phase of combustion,
perhaps due to more complete burning of the fuel and a higher
burning temperature.
3.2. Particle Emission Factors
Particle emission factors were not so clearly associated with smoldering combustion as the hydrocarbons. Figure 6 shows
the particle mass emission factor as a function of combustion
efficiency; although there is a weak correlation, it seems that the production of particulate matter in smoke is a complex process not readily predicted by knowledge of the phase of the fire. Black carbon (Figure 7) was essentially independent of the combustion efficiency and varied in what appears to be a random manner from fire to fire. Overall, BC comprised about 5-9% of the emitted particle mass.
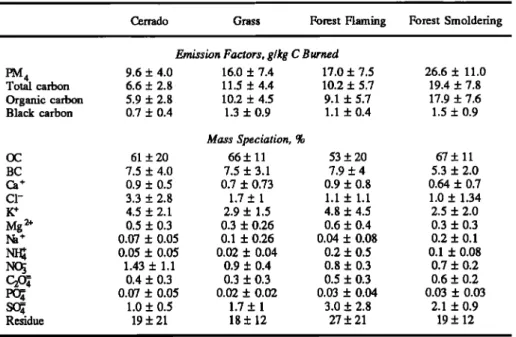
A summary of the particle emission factors and elemental compositions is given in Table 3. Cerrado fires had the lowest
particle emission factors of any fuel type or combustion efficiency (10 g/kg C burned). Grass and flaming forest fires had similar particle emission factors (16 g/kg C burned). Smoldering forest fires had the highest particle emission factor (27 g/kg C burned).
Particle emission factors for forest fires varied widely, as is
evident in the large standard deviations associated with the
data (Table 3). A regression of particle emission factors for forest fires against the MCE shows that unlike hydrocarbons, particle production is not strictly associated with smoldering
combustion (Figure 6). While the particle emission factor
shows a statistically significant (at the 95% confidence level) increase with decreasing MCE, the correlation is low (r2= 0.18) and is strongly dependent on one data point (at MCE =
0.98).
As discussed by Reid and Hobbs [this issue], particle properties are influenced by two principle processes:
condensation and coagulation of high temperature products in the flame zone during flaming combustion and condensation
of low-volatility organics during low temperature, smoldering combustion. Thus the particle formation mechanisms for purely flaming and purely smoldering combustion are quite
different. This difference is illustrated in Figure 8, where the
emission ratio of particles to CO is plotted as a function of the MCE for smoke from forest fires. Here we f'md that the emission ratio increases with increasing MCE. This trend is
identical to that found by Ward et al. [1991] for North
American forest fires, where it was shown that during flaming combustion particles are formed by a mechanism distinctly
different from that which produces CO. In view of the small
range of values of the MCE observed in this study, it is not surprising that the correlation between the particle emission
factor and the M CE is poor.
Even though the correlation between the particle emission
factor and the MCE is poor, the correlation between the
particulate mass concentration and the CO is fairly good (Figure 9). In this case, we have plotted the particle
concentration versus CO for all our data. Two possible regression lines can be drawn depending on whether or not the
outlying data point (at a CO concentration of 17 ppm) is included. For all the data, the regression yields a slope of 156
gg ppm
-1. However,
if the outlying
data
point is discarded,
the regression slope drops to 80 gg ppm -1.
It is likely that the 80 g g ppm -1 slope is a more representative emission ratio for typical fires in Brazil. This
is similar
to the value
of 82 gg ppm
'l found
by Anderson
et al.
[1996]. The fire for which the outlying data point was obtained was atypical in comparison to the other fires sampled
during SCAR-B. Not only was this the largest fire we encountered (with smoke concentrations greater by a factor of 2 than the next largest fire), but conditions at the surface
12000 • [Toluene]= 10000 --- ,_,= 6000
__=
4000
2000 ...rrado
r•
::
::
::
::
0 []
i
!
i
i/ ß •rass
i ! ! i• ß Rain Forest
-2000 .... i .... i .... i .... i .... • ....
0 10000 20000 30000 40000 50000 60000
Propene (pptv)
Figure 2. As for Figure 1 but for excess toluene versus
32,112 FEREK ET AL.: EMISSION FACTORS FOR BIOMASS BURNING
Table 2. Regression Slopes and Correlation Coefficients for the Concentrations of Individual Hydrocarbons,
Halocarbons,
Trace
Gases
and
Particulate
Species
Versus
the Concentrations
of CO
2, CO, and
Total
NMHCs
Versus CO 2, ppmv Versus CO, ppmv Versus NMHC, ppmv C
Species
Slope
r 2
Slope
r 2
Slope
r 2
CO
2, pptv
-
--
6.32
x 106
0.43
5.0
x 107
0.33
CO, pptv 68500 0.43 .... 8.3 x 10⁶ 0.81 NMHC, ppt C 6100 0.28 94000 0.81 .... Methane, pptv 6900 0.25 124000 0.90 1.09 0.82 Ethane, pptv 318 0.27 5158 0.85 47242 0.78 Ethene, pptv 821 0.42 10521 0.83 104590 0.90 Ethyne, pptv 243 0.53 2436 0.63 24847 0.72 Propane, pptv 87.3 0.36 1028 0.82 11240 0.78 Propene, pptv 241 0.29 3863 0.87 37342 0.89 Isobutane, pptv 3.84 0.19 74.3 0.82 690 0.78 n-Butane, pptv 9.50 0.14 209 0.79 1973 0.78 Propadiene, pptv 8.07 0.49 96.4 0.82 943 0.87 t-2-Butene, pptv 15.5 0.26 262 0.89 2446 0.86 1-Butene, pptv 44.2 0.34 661 0.90 6258 0.89 Isobutene, pptv 31.1 0.21 577 0.87 5347 0.82 c-2-Butene, pptv 13.1 0.27 221 0.89 2049 0.84 i-Pentane, pptv 1.14 0.09 30.6 0.73 270 0.63 n-Pentane, pptv 3.58 0.25 58.6 0.81 553 0.79 Isoprene, pptv 5.93 0.45 69.1 0.73 723 0.88 Benzene, pptv 121 0.34 1492 0.89 17499 0.92 Toluene, pptv 54.4 0.23 941 0.81 9030 0.82 p-Xylene, pptv 3.27 0.19 57.9 0.72 566 0.75 m-Xylene, pptv 5.99 0.19 108 0.72 1053 0.76 Ethylbenzene, pptv 5.67 0.20 96.6 0.70 973 0.79 o-Xylene, pptv 2.51 0.14 48.8 0.62 489 0.69 CH3C1, pptv -0.404 0.00 116 0.05 1656 0.12 CHC13, pptv 1.48 0.09 -1.06 0.00 -15.5 0.00 CH3B r, pptv 1.30 0.24 16.6 0.46 136 0.34I, pptv
5.07
0.03
14.2
0.31
85.5
0.12
r 2,
pptv
-0.021
0.01
0.505
0.08
4.158
0.06
3, pptv -0.090 0.22 -0.258 0.02 -3.23 0.04 Black carbon, gg m '3 0.339 0.38 3.49 0.49 30.6 0.41 TPC, I, tg m '3 3.31 0.24 41.1 0.46 334 0.35 C1-, lag m '3 0.148 0.33 0.585 0.06 6.16 0.07NO•3,
I,
tg m
'3
0.039
0.26
0.496
0.47
4.206
0.37
SO•, [xg m '3 0.125 0.33 1.19 0.32 10.3 0.28Na
•t-•, lag
m
-3'3
-0.013
0.55
0.499
0.10
0.623
0.20
I•, g_g m 0.284 0.67 2.02 0.37 18.1 0.36Mg_
+2,
lag
m
'3
0.0675
0.42
0.719
0.52
6.49
0.48
Ca +z, I, tg m '3 0.957 0.33 1.26 0.61 9.89 0.43NI•4,
lag
m
'3
0.0016
0.02
0.0354
0.10
0.147
0.02
A total of 24 samples were taken for all species, except for the methyl balides where 22 samples were taken.
resembled a full fire storm with very vigorous flaming and
strong surface winds. Under such circumstances, particles would have been produced entirely by the high temperature
condensation process, and any CO was probably produced by oxygen deprivation in the interior of the fire rather than by
low-temperature smoldering processes.
3.3. Particle Composition
Carbon species accounted for 60 to 70% of the mass of all particle emissions. Despite wide variations in the emission factors of OC and BC by fuel type and combustion efficiency,
their mass fraction in the aerosol was remarkably stable. For
all flaming fires (cerrado, grass, and forest), the black carbon content of the emitted aerosols was roughly constant at 7.8%. Similarly, their organic carbon content was roughly constant at 59%. This yields an organic to black carbon ratio of 8:1.
Aerosols from smoldering fires had higher organic carbon
(and lower black carbon) contents, resulting in an
35
; • iEF(NMHC)=124 - 125 (MCE) (? =0.58)i
3 0 ... -:, ... i ... , : •c- 25 oO 20
uj•o. 15
•
10
5 o o.84 ß Grass ... i ... e;---o ... ß Rain Forest :: :: :: 0.86 0.88 0.9 0.92 0.94 0.96 0.98Modified Combustion Efficiency
Figure 3. Emission factors of NMHC versus the modified combustion efficiency (MCE).
FEREK ET AL.: EMISSION FACTORS FOR BIOMASS BURNING 32,113 0.025 0.02 o u_ c- 0.015 .o u) rO 0.01 ._ • g0.005 o
: • EF(CH3Br)=0.135 - 0.14 (MCE) (r2=O 49
ß i , , ' ß
ß Grass ß
ß Rain Forest '. ,
-0.005 ,,, •,,, •,,, •,,, •,,, i,,, • , , ,
0.84 0.86 0.88 0.9 0.92 0.94 0.96 0.98
Modified Combustion Efficiency
Figure 4. As for Figure 3 but for methyl bromide.
organic-to-black carbon ratio for smoldering combustion of 12to 1. As discussed above, particle production in smoldering combustion occurs at lower temperatures than flaming combustion, and it is dominated by low-temperature condensation processes. Thus the mass fraction of organic carbon should go up with decreasing MCE.
The ion chromatography analysis was able to speciate only another 6 to 8% of the total aerosol mass. This mass was mostly composed of potassium (3-5%), chloride (1-3%), and sulfate (1-3%). Thus we were unable to speciate about 20% of
the aerosol mass; this remainder is classified as "residue" in
Table 3. It is likely that this residue mass was composed primarily of hydrogen, oxygen, and nitrogen, which are
associated with organic carbon. Thus the ratio of the mass of
organic species to organic carbon is likely in the range of 1.2 to 1.5.
4. Discussion
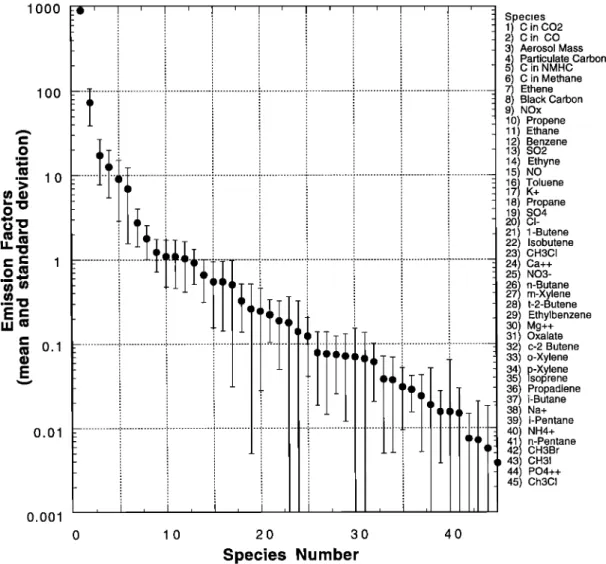
All of the emission factors we measured are shown in Figure 10. They are discussed below under the sub-headings "gases"
and "particles".
4.1. Gases
Hydrocarbon emissions were found to have a clear
association with smoldering combustion, as evidenced by
[] CerradøNOx
I
,-
ß Cerrado
SO
2 / i
[]
O •[5;]
O : '• • 2 v Grass NO ... i ... -, ... ; ... !-• ...u_
g •
• Grass
SO2
O • -Q
O Rain
Forest
NO
/ ::
::
::
:: o
'• _orO
e
t
,""i'
...
...
' ...
ß - rO a• ß Rain Forest SO 2
0 • c,
-o z• 1 ....
. ...
::.
...
:
0• o,• 0 X • , , 'e ' ,...
i
...
, ...
,,
...
,,
...
!
...
v ...
!
...
',
,,,' 4- .,,so;,_--,.,
+ .:o
0 , , , i , , , i , , , i , , , , , , , , .... , , , 0.84 0.86 0.88 0.9 0.92 0.94 0.96 0.98Modified Combustion Efficiency
Figure 5, As for Figure
3 but for NO
x (open
symbols)
and
SO 2 (solid symbols). 50 (1) 40 u_ cn O ._ • 20 o • lO o 0.84
E;(PM.:
All
Data)=135-
127
(I•IC'E)'
(r'=0.24)
• EF(PM :Forest Fires)=119 - 107 (MCE) 4 (r•=0,19)
', ß ... .• ... • ... ., ... • ... , ... ,. ... , , , .... ß ... • ... : ... -v- ... ',,. ...
_ ,,'""
+.:
...
!,.
...
,i
...
• CG:arr;J
o ...
I•
...
•ii/
...
:•
...
:
ß ,.ai ores,
, , , , , , , , • I , , , I , , , I , , , I i , i
0.86 0.88 0.9 0.92 0.94 0.96 0.98
Modified Combustion Efficiency
Figure 6. As for Figure 3 but for particulate matter less than 4 I.tm in diameter (PM4). Two regression lines are drawn: for all of the data (solid line) and for forest fires only (double
line).
their high degree of correlation with CO and combustion efficiency. This result is consistent with a number of previous studies of emissions from biomass burning [Greenberg et al., 1984; Hurst et al., 1994; Bonsang et al., 1991; Ward et al.,
1992, 1996; Blake et al., 1996]. The emission factors for hydrocarbons are closely predicted by the combustion
efficiency. For the fires studied during SCAR-B, there were no clear differences in the amounts or relative proportions of
hydrocarbons emitted which could be attributed to the different fuel types studied (grass, cerrado, and forest). What did differ between fuel types was the combustion efficiency, with grass
and cerrado having relatively high combustion efficiencies (mostly flaming combustion) and forest fires having a relatively larger amount of smoldering combustion. In
addition, the distinctions between fuel types were somewhat
obscured in that cerrado and grass fires typically had some amount of woody fuels within them, either from young trees or
from the remnants of incomplete combustion of the woody fuels (stumps and trunks) when the forest was originally cleared for pasture [Barbosa and Fearnside, 1996]. In addition, forest fires, especially during their flaming phase, probably consumed a large amount of underbrush and grass as well as leaves and branches, further blurring the distinction
•, 2.5 o• 2
•
0.5
o 0.84 : • ,EF(BC)=5.7 - 4.8(MCE) (? =0.07) ... i. ... i ... v ... : ... i ... i ... !...e ... ... ': ... ! ... ,' ... i ... •-:: ... : ... :---•'"'"..---[] Cerrado
t'e'
...
i ...
!
...
:
i[]ß
ß Grass /
!
i
-::
...
t ...
i•
...
ß Rain
Forest
/
0.86 0.88 0.9 0.92 0.94 0.96 0.98
Modified Combustion Efficiency
32,114 FEREK ET AL.: EMISSION FACTORS FOR BIOMASS BURNING
Table 3. Particle Emission Factors and Compositions for Various Types of Individual Fires in Brazil
Cerrado Grass Forest Flaming Forest Smoldering Emission Factors, g/kg C Burned
PM 4 9.6 ñ 4.0 16.0 ñ 7.4 17.0 ñ 7.5 26.6 ñ 11.0 Total carbon 6.6 ñ 2.8 11.5 ñ 4.4 10.2 ñ 5.7 19.4 ñ 7.8 Organic carbon 5.9 ñ 2.8 10.2 ñ 4.5 9.1 ñ 5.7 17.9 ñ 7.6 Black carbon 0.7 ñ 0.4 1.3 ñ 0.9 1.1 ñ 0.4 1.5 ñ 0.9 Mass Speciation, % OC 61 ñ20 66ñ 11 53 +20 67 ñ 11 BC 7.5 + 4.0 7.5 ñ 3.1 7.9 ñ 4 5.3 ñ 2.0 Ca + 0.9 + 0.5 0.7 ñ 0.73 0.9 ñ 0.8 0.64 ñ 0.7 C1- 3.3 ñ 2.8 1.7 ñ 1 1.1 + 1.1 1.0 ñ 1.34 K + 4.5 ñ 2.1 2.9 ñ 1.5 4.8 ñ 4.5 2.5 ñ 2.0 Mg 2+ 0.5 + 0.3 0.3 ñ 0.26 0.6 ñ 0.4 0.3 ñ 0.3 Na + 0.07 ñ 0.05 0.1 + 0.26 0.04 ñ 0.08 0.2 + 0.1 NI• 0.05 ñ 0.05 0.02 ñ 0.04 0.2 ñ 0.5 0.1 ñ 0.08 NO• 1.43 ñ 1.1 0.9 ñ 0.4 0.8 ñ 0.3 0.7 ñ 0.2 C2• 0.4 ñ 0.3 0.3 ñ 0.3 0.5 ñ 0.3 0.6 + 0.2 • 0.07 ñ 0.05 0.02 ñ 0.02 0.03 ñ 0.04 0.03 ñ 0.03 • 1.0 ñ 0.5 1.7 ñ 1 3.0 + 2.8 2.1 ñ 0.9 Residue 19 ñ 21 18 + 12 27 ñ 21 19 ñ 12
among the three categories of fuels. These fuels, as well as the
likely presence of biomass litter in many of the fields, contributed to a significant amount of smoldering combustion observed even from what appeared to be mostly grass fuels. Thus for tropical biomass fires the relative amounts of flaming
and smoldering combustion is the key variable for
determining the emission rates of these species, at least as far as hydrocarbon emissions are concerned. Therefore a rather accurate estimate of the hydrocarbons emitted from such fires
can
be obtained
from
measurements
of CO and
CO
2 alone.
The emission factors for the methyl halides were less well
correlated with combustion efficiency than hydrocarbons but
clearly showed an association with smoldering combustion. Andreae et al. [1996] attributed variations in emission factors
of halogenated species to variations in the halogen content of the fuels, with tropical savanna fuels showing considerably
higher halogen contents than most forest fuels.
The ratio of the concentrations of hydrocarbons and halocarbons to CO reported here are very similar to those reported previously for Brazilian fires. A comparison of our
results with those of the Brazilian Fire Assessment (BFA)
200 150 400 ' ' ' I ' ' ' I ' ' ' I ' ' ' I ... ß ' ' ER(PM4)=-1002 - 1271 (MCE) (?=0.31) 350 ... 3OO -
50 ,,, i,,, ?,,, ie,,, i,,, i,,,
0.84 0.86 0.88 0.9 0.92 0.94 0.96 0.98
Modified Combustion Efficiency
Figure 8. PM4-to-CO emission ratio versus modified combustion efficiency for forest fires.
program [Blake et al., 1997] and the Transport and Atmospheric Chemistry near the Equator (TRACE A) studies
[Blake et al., 1996] is given in Table 4. As in the case of the
SCAR-B results presented here, the ratios from the BFA study are for very young smoke, whereas the TRACE-A ratios are for aged smoke in regional hazes. Our results for CH 4 lie between the BFA and the TRACE-A values. Similarly, our ratios for
low reactivity hydrocarbons, such as ethane and benzene, are in good agreement with these two studies. However, there is
some difference in the ratios for more reactive species such as
propene and toluene. For these species the emission ratios for
young smoke (i.e., our study and BFA) are significantly higher
than those measured in aged smoke in TRACE A. As discussed
by Reid et al. [this issue (a)], these reactive species have short photochemical lifetimes.
The CH3C1/CO ratios measured in SCAR-B lie between the values measured in BFA and TRACE A. The SCAR-B CH3I/CO
3500 -- -- c = -77 + (156+16) m [CO] (r 2 = O. 8 O) 3000 ... c = -123 + (80+_12) [CO] (r•=0.64) 2500 2000 1500 1000 500 0
i i •i , i i i
0 5 10 15 20 Excess CO (ppmv)Figure 9. Total excess (i.e., above background) concentration of particulate matter less than 4 gm in diameter (PM4) versus excess CO in smoke for 21 in individual fires in Brazil. Two regression lines are shown: for all of the data points (dashed line) and when one data point (at 17 ppmv and
FEREK ET AL.' EMISSION FACFORS FOR BIOMASS BURNING 32,115 lOOO lOO lO o.1 O.Ol o.ool -•i i i i i i i i i _ _ Species 1) C in CO2 2) C in CO 3) Aerosol Mass
541
C in NMHCParticulate
Carbon
6) C in Methane 7) Ethene 8) Black Carbon 9) NOx 10) Propene 11) Ethane1321
Benzene
SO2 14) Ethyne 15) NO167/
Toluene
K+ 18) Propane191
SO4
20 CI- 21) 1-Butene 22) Isobutene 23) CH3CI 24) Ca++ 25) N03- 26271
n-Butane
m-Xylene 28) t-2-Butene 29) Ethylbenzene 30) Mg++ 31) Oxalate 32) c-2 Butene 33) o-Xylene33541
p-Xylene
•soprene 36) Propadiene 37) i-Butane 38) Na+ 39) i-Pentane 40) NH4+41/
n-Pentane
42 CH3Br 43) CH31 44) PO4++ 45) Ch3CI 0 10 20 30 40Species Number
Figure 10. Mean and standard deviations of emission factors plotted in order of decreasing magnitude for 45
gaseous
and particulate
species
from individual
fires in Brazil. For CO
2, CO, BC, particulate
carbon,
C in
NMHC, and C in methane,
the units
are g C/kg C burned;
for NO
x the units
are g N/kg C burned;
and for all
other species, the units are g/kg C burned.
ratios are similar to those found in BFA but much higher than
measured in regional hazes in TRACE A. McKenzie et al.
[1997] has shown that the halogen content of biomass is
highly variable. Thus since the data from SCAR-B, BFA, and
TRACE A were collected in different regions in Brazil, differences in the halocarbon to CO ratio are to be expected.
The emission
factors
of NO
x and SO
2 exhibited
behaviors
opposite to that of hydrocarbons, in that their emission
factors increased with combustion efficiency, although their correlations with MCE were poor (r2= 0.15 and 0.13,
respectively). The productions
of NO
x and SO
2 were
associated more with flaming combustion, perhaps due to more complete burning of the fuel and a higher burning temperature, but their dependence on combustion efficiency was not so strong as for hydrocarbons. The variability of the emission factors between fires may be attributable to different nitrogen and sulfur contents of the fuels [Lobert et al., 1991; Turn et al., 1997]. Similarly, Lacaux et al. [ 1996] found a clear relationship between the fuel nitrogen content and the NOx/CO 2 ratio in emissions from African savannah fires, which burned relatively efficiently (average CE of approximately 0.95). For the SCAR-B data, which spanned a
wider range of combustion efficiencies but for which we do not have information on the fuel nitrogen and sulfur contents, the variability of the results are likely due to variations in fuel composition and, to a lesser degree perhaps, to differences in
the relative amounts of flaming and smoldering combustion.
4.2. Particles
The particle emission factors and compositions reported
here compare fairly well to measurements from previous
studies. Previously, the most comprehensive study of particle
emissions from fires in Brazil was the BASE-B experiment
[Ward et al., 1992]. Assuming the wood fuel was 50% carbon by mass, the average emission factors for cerrado and smoldering forest from Ward et al. is 9 g/kg C burned. This is
nearly identical to the value determined in this study. The
chemical composition of the particles measured by Ward et al. is also similar to that found in this study. They reported
potassium, calcium, and chloride mass fraction which are
within the standard deviations of our values. Furthermore, the
mass fractions of sulfur in the aerosol, reported by Ward et al., and in the present study are similar.
32,116 FEREK ET AL.: EMISSION FACFORS FOR BIOMASS BURNING
Table 4. Regression Slopes for Concentrations of Various Chemical Species Versus CO Concentrations for Young Smoke Measured in SCAR-B and BFA and in Regional Hazes in Brazil in TRACE A
This Paper BFA TRACE A
(SCAR-B), [Blake et al., 1997], [Blake et al., 1996],
pptv ppb'l r 2 pptv ppb' 1 r 2 pptv ppb' • r 2 CH 4 98 + 10 0.72 107 + 4 0.91 94 + 13 0.70 C in NMHCs 95 + 10 0.80 na na na na (C<l 1) Ethane 5.2 + 0.7 0.85 8.5 + 0.3 0.84 8.3 + 0.3 0.97 Ethene 11 + 1 0.83 17.1 + 0.4 0.95 6.1 + 0.4 0.87 Ethyne 2.4 + 0.4 0.63 4.6 + 0.2 0.90 3.3 + 0.1 0.97 Propane 1.0 + 0.1 0.82 1.6 + 0.1 0.7 9 1.6 + 0.1 0.95 Propene 3.9 + 0.3 0.87 4.9 + 0.1 0.98 0.4 + 0.1 0.62 Propadiene 0.1 + 0.09 0.82 na na na na /-Butane 0.07 + 0.01 0.82 0.47 + 0.02 0.87 0.055 + 0.02 0.55 n-Butane 0.21 + 0.02 0.79 0.21 + 0.02 0.70 0.21 ñ 0.01 0.21 1-Butene 0.66 ñ 0.06 0.90 0.75 + 0.02 0.75 na na t-2-Butene 0.26 ñ 0.02 0.89 0.26 -t- 0.01 0.88 na na c-2-Butene 0.22 + 0.02 0.89 0.20 -3- 0.01 0.87 na na i-Pentane 0.03 + 0.004 0.73 0.020 ñ 0.002 0.57 na na n-Pentane 0.06 + 0.006 0.81 0.043 ñ 0.002 0.84 0.05 + 0.01 0.80 Benzene 1.5 + 0.2 0.89 1.7 ñ 0.03 0.97 1.29 + 0.05 0.97 Toluene 0.9 + 0.1 0.81 0.72 ñ 0.02 0.72 0.57 ñ 0.03 0.93 Ethylbenzene 0.10 ñ 0.01 0.70 na na na na o-Xylene 0.05 ñ 0.005 0.62 na na 0.03 ñ 0.002 0.87 m-Xylene 0.11 + 0.01 0.72 na na 0.04 + 0.004 0.83 p-Xylene 0.06 ñ 0.005 0.72 na na 0.02 ñ 0.003 0.93 Isoprene 0.07 + 0.01 0.73 na na na na CH3C1 0.52 + 0.17 0.56 0.31 ñ 0.03 0.90 0.85 + 0.06 0.88 CHC13 0.001 ñ le-4 0.63 na na na CI-I3I 0.005 + 0.002 0.30 0.004 ñ 0.0003 0.001 + 0.0002 0.57 CH3Br 0.01 ñ 0.003 0.42 0.007 + 0.0009 0.49 0.011 + 0.001 0.88
CIIBr 3 -0.9e-5 ñ le-4 0.07 na na na
Units are in change of species concentration (in pptv) per change in CO (in ppbv); r 2 is the regression coefficient;
na, not available.
The particle emission factors from grass fires in Brazil reported here are similar to those measured in grass fires in Africa. Using the "best guess" emission factor from Andreae et al. [1997] for particles from African savannah fires, and assuming a carbon content of the fuel of 50%, we calculate an average PM2. 5 emission factor for African grass fires of 11 g/kg C burned. Thus after adjusting for differences in the size of the particles sampled (PM 4 from our measurements, based on the particle size distribution for the SCAR-B fires reported by Reid and Hobbs [this issue], and PM2. 5 for Andreae et al.), the emission factors for particles from grass fires in the two regions agree to within 25%.
During the BASE-B study, Ward et al. [1992] measured emission factors and the chemical composition of particles emitted from forest fires. The chemical compositions of the
aerosols from these fires are similar to those given in this paper. Also, as for the SCAR-B measurements, the correlation
between the particle emission factor and the MCE was poor in the BASE-B study. However, the emission factor for particles produced by smoldering combustion reported by Ward et al. is only 17 g/kg C burned, compared to our value of 27 g/kg C
burned. This large difference cannot be accounted for by
differences in the measured particle cut points. The difference could be a result of the process and the temperature at which
high molecular weight organic vapors released from
smoldering combustion condense onto particles. Ward et al. [1992] performed their particle and gas sampling on 10 m towers placed in the center of buming plots. However, Reid et
al. [this issue (a)] present evidence that in smoke from forest
fires, condensation of organic vapors onto particles occurs in
the first minutes to hours after emission. In this case, the
condensation rate in the smoke must be very high during the first few hundred meters of travel and as the smoke is cooled by entrainment and radiation. Thus it is unlikely that the vapor-particle phase partition was at equilibrium in Ward et
al.'s [1992] measurements. This would result in an
underestimate of the particle emission factor for mixed-phase forest fires. Their reported emission factor for smoldering combustion is significantly lower than our value of 27 g/kg C
burned.
Particle emission factors measured for forest fires in Brazil
are considerably less than those found in North America. Radke et al. [1991] found that boreal fires in the Pacific
Northwest have average PM3. 5 emission factors of the order of 30 and 40 g/kg C burned, for flaming and smoldering combustion, respectively. Similarly, Hobbs et al. [1997] measured PM3. 5 emission factors of the order of 50 g/kg C burned for very intense flaming combustion from prescribed
fires. The reason for these differences are likely due to fuel and
fire size. In the North American studies the fires were typically large, fuels were dry, and the fires were ignited
rapidly by helitorch, resulting in smoke particle mass
concentrations
typically
in excess
of 600 gg m -3. In contrast,
most of the fires studied in Brazil were small, burned slowly,
and produced smoke concentrations near the fire, which were