HAL Id: tel-01130964
https://tel.archives-ouvertes.fr/tel-01130964
Submitted on 4 Jul 2017HAL is a multi-disciplinary open access archive for the deposit and dissemination of sci-entific research documents, whether they are pub-lished or not. The documents may come from teaching and research institutions in France or abroad, or from public or private research centers.
L’archive ouverte pluridisciplinaire HAL, est destinée au dépôt et à la diffusion de documents scientifiques de niveau recherche, publiés ou non, émanant des établissements d’enseignement et de recherche français ou étrangers, des laboratoires publics ou privés.
Performance des dispositifs de filtration sur les micro
polluants associés aux ruissellements diffus
Bonjin Koo
To cite this version:
Bonjin Koo. Performance des dispositifs de filtration sur les micro polluants associés aux ruissellements diffus. Other. Université Nice Sophia Antipolis, 2014. English. �NNT : 2014NICE4092�. �tel-01130964�
Ph. D. Dissertation
A Study on the Filtration Efficiency of
Micro particle Pollutants from Non-Point
Source
- Focused on Road Runoff and CSOs -
University of Nice Sophia Antipolis
Bonjin Koo
i
ABSTRACT
The impermeable area and the peak discharge volume have been consistently increasing due to widening of city development and renewal. Thus, distortion of water cycle has been serious problem compared to the past. When it comes to NPS pollution, lack of information on the load and characteristics of pollutants led to the insufficient reduction measures.
The purpose of this study is to investigate the effectiveness of filters to control micro particles from non-point sources, especially from road runoff and Combined Sewer Overflows (CSOs). The study first examined the particle size and characteristics of NPS pollutants, and then analyzed the head loss, treatment efficiency and changes in particle size distribution before and after the treatment using device type facilities. The four most commonly used filters - Expanded Polypropylene (EPP), Expanded polystyrene (EPS), and Perlite as floatability filtering materials, and Zeolite as non-floatability - were compared. The upward-type filtering equipment was manufactured for the lab experiment, and CFD modeling was conducted to identify optimized design parameters.
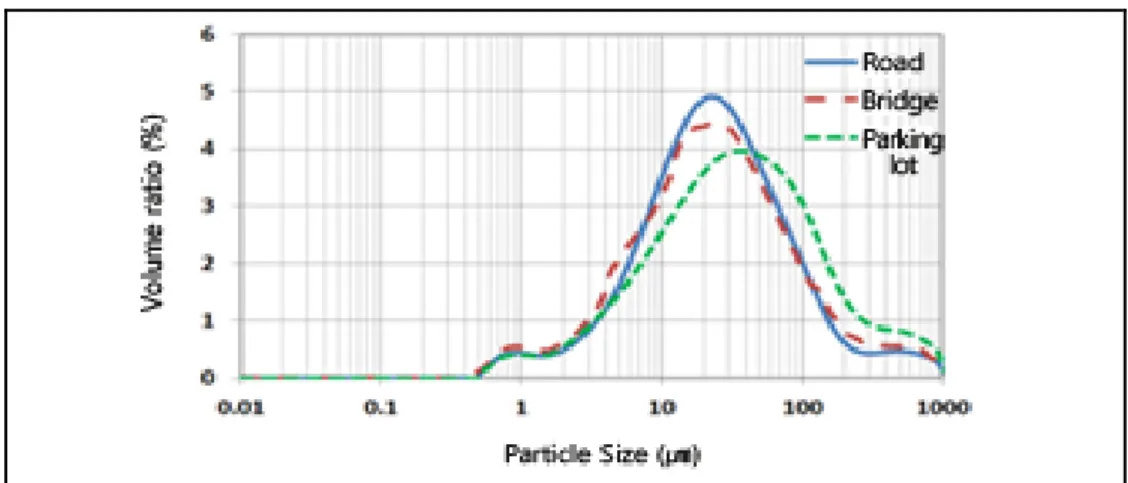
The results showed that the ratio of micro particles(<100 ㎛), to which the filtering process can be applied, was highest in samples from the road runoff, followed by one from the bridge, and from the parking lot. The results using road runoff displayed that EPP was most efficient with ratio of 89% to treat SS and COD. The removal rate of EPP for Zn and Cu was also high over 80%, which is 7 ~ 40% higher than those of other filters tested. The continuous filtering period calculated was again longest for EPP to reach 163 days. The calculated filtering period for CSOs was apparently shorter than that for road runoff, due to the hydraulic loading and SS quantity. The filters compared were not efficient to remove TN and TP in CSOs. The results from the numerical analysis for the particles over 100 ㎛, to which the gravity sedimentation can be applied, showed that sedimentation efficiency can be improved by controlling the inflow velocity through the utilization of the bent pipe or baffle wall. The operation and management can be also easier by placing appropriate facilities such as manhole at the sedimentation point.
ii
This study suggested the best filtration material to treat NPS pollutants tested by road runoff and CSOs samples. The experimental results shown in this study and following discussions may act as base information for proper design and operating parameters of the filtering facilities to control NPS pollutants.
iii
Table of Contents
Abstract ··· i
Table of Contents ··· iii
List of Tables ··· vi
List of Figures ··· viii
CHAPTER 1 INTRODUCTION 1.1 Background ··· 1
1.2 Objectives ··· 4
1.3 Content and scope of the study ··· 4
CHAPTER 2 LITERATURE REVIEW 2.1 Characteristics of NPS pollution ··· 7
2.1.1 Pollution load by land-use ··· 7
2.1.2 Characteristics of NPS in urban area ··· 12
2.1.3 Characteristics of road runoff ··· 15
2.2 Filtration efficiency from road runoff ··· 18
2.2.1 Characteristics of particle size distribution ··· 18
2.2.2 Efficiency of filtration devices ··· 21
2.3 Case study of treatment facilities from road runoff ··· 23
2.4 Characteristics of CSOs ··· 27
2.5 Filtration efficiency from CSOs ··· 29
2.6 Case study of treatment facility from CSOs ··· 32
CHAPTER 3 MATERIALS AND METHODS 3.1 Experimental sites ··· 35
3.2 Samplings and analysis ··· 37
3.2.1 Samplings ··· 37
3.2.2 Analysis ··· 37
iv
3.3.1 Selection of filter media ··· 40
3.3.2 Analysis of the physical properties of media ··· 40
3.3.3 Adsorption characteristics of filter media ··· 42
3.4 Experimental methods for filtration efficiency ··· 43
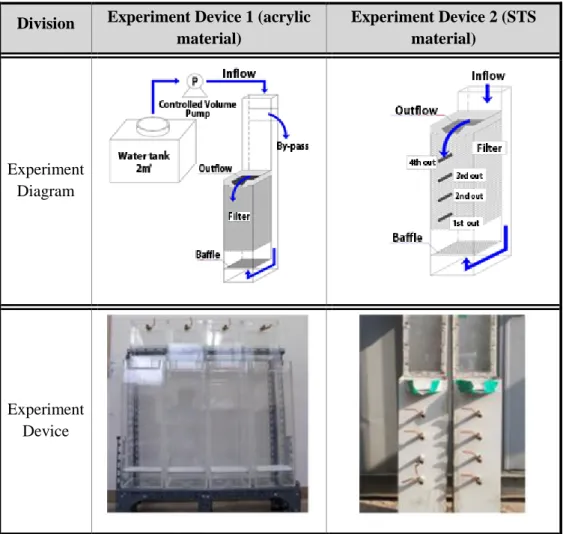
3.4.1 Experimental device ··· 43
3.4.2 Manufacturing samples of road runoff and CSOs ··· 44
3.4.3 Experimental methods ··· 46
CHAPTER 4 EVALUATION OF SEDIMENTATION AND FILTRATION EFFICIENCY FROM ROAD RUNOFF 4.1 Characteristics of road runoff in the study site ··· 47
4.1.1 SS ··· 47
4.1.2 Water quality analysis ··· 51
4.1.3 Particle size distribution ··· 52
4.2 Sedimentation as pre-treatment ··· 56
4.2.1 Pre-treatment process ··· 56
4.2.2 Design criteria ··· 57
4.3 Numerical analysis for sedimentation ··· 59
4.3.1 Model··· 60
4.3.2 Concept and the input parameters··· 64
4.3.3 Result by various inlet types ··· 66
4.3.4 Result by baffle types ··· 77
4.3.5 Suggestion for optimal sedimentation conditions ··· 84
4.4 Evaluation of filtration efficiency ··· 88
4.4.1 Changes of head loss by media··· 88
4.4.2 Changes of concentrations by layers in filter media ··· 94
4.4.3 Treatment efficiency by media ··· 99
4.4.4 SS removal rate of media by various particle sizes ··· 109
4.4.5 SEM analysis ··· 114
CHAPTER 5 EVALUATION OF FILTRATION EFFICIENCY FROM CSOs 5.1 Characteristics of CSOs in the study area ··· 117
v
5.1.2 Flow and water quality analysis during dry season ··· 119
5.1.3 Flow and water quality analysis during rainy season ··· 120
5.2 Evaluation of filtration efficiency ··· 123
5.2.1 Changes in head loss by media ··· 123
5.2.2 SS removal rate of media ··· 126
5.2.3 BOD/COD removal rate of media ··· 129
5.2.4 TN/TP removal rate of media ··· 132
vi
List of Tables
Table 2.1 NPS pollution and pollutants by land-uses (MOE, 2006) ··· 10
Table 2.2 Unit value of NPS pollution by land-uses (Lee, hyeondong, etc., 2002) ··· 11
Table 2.3 Water pollution load by pollution sources of river watershed ··· 12
Table 2.4 NPS pollution in urban area ··· 14
Table 2.5 NPS pollution occurrence types and materials on the road ··· 16
Table 2.6 Comparison with the pollutants concentration on the road and elsewhere ···· 17
Table 2.7 Analysis of storm water treatment using filtration ··· 25
Table 2.8 Pollutants removal rate by storm water treatment devices (USEPA, 2005) ··· 26
Table 3.1 Summary of investigation points for capture of NPS pollution ··· 35
Table 3.2 Portable flow meter specifications ··· 37
Table 3.3 Specifications of particle size analysis ··· 38
Table 3.4 Heavy metals analyzers (ICP-MS) specification ··· 39
Table 3.5 SEM (Scanning Electron Microscope) Specifications ··· 39
Table 3.6 Physical properties of filter media ··· 41
Table 3.7 Adsorption characteristics of filter media ··· 42
Table 4.1 Overview of captured samples by each site ··· 47
Table 4.2 SS monitoring result by road runoff source ··· 50
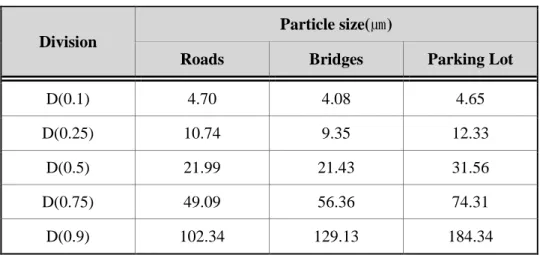
Table 4.3 Particle size distribution result about road runoff ··· 53
Table 4.4 Volume ratio by each particle size range ··· 54
Table 4.5 Load ratio by each particle size range ··· 55
Table 4.6 Formula of each design parameters in grit chamber ··· 58
Table 4.7 Model used for CFD analysis ··· 64
Table 4.8 Input parameter for CFD analysis ··· 65
Table 4.9 Conditions for optimal image simulation of device ··· 66
vii
Table 4.11 Distribution of particle sedimentation by baffle conditions ··· 86
Table 4.12 Time to reach the limit head loss of each filter Medias in maximum filtration velocity ··· 89
Table 4.13 Calculated overflow time by regression equation of the head loss by media ··· 91
Table 4.14 Evaluation of SS removal efficiency by filter media’s height ··· 95
Table 4.15 Primary linear regression of the SS concentration variations by filter media’s height ··· 98
Table 4.16 SS removal efficiency by each filter media ··· 99
Table 4.17 COD removal efficiency by each filter media ··· 103
Table 4.18 Zn, Cu removal efficiency by each filter media ··· 107
Table 4.19 Particle size distribution of influent and treated water for each filter media ··· 110
Table 4.20 SS average treatment efficiency classified by particles size distribution for each filter media ··· 113
Table 5.1 Summary of CSOs investigation points ··· 118
Table 5.2 Analysis rainfall of CSOs monitoring for each places ··· 120
Table 5.3 Water quality analysis during rainfall in storm overflow diverging tanks ···· 121
Table 5.4 SS removal efficiency by each filter media ··· 127
Table 5.5 COD and BOD removal efficiency by each filter media ··· 130
viii
List of Figures
Figure 2.1 Particle size distribution and accumulated mass fraction of highway
runoff (LA Area) ··· 19
Figure 2.2 Particle-size distribution of a sample of bottom sediment collected from three oil-grit separators located along the Southeast Expressway, Boston, ··· 20
Figure 2.3 Conceptual schematic of movement characterization classified by size of particles ··· 20
Figure 2.4 Size distribution of road runoff during rainfall ··· 21
Figure 2.5 Treatment efficiency by filter media (Filterlayer of 15cm) ··· 22
Figure 2.6 Relationship between filtration velocity and removal rate(Son et al., 2010) · 31 Figure 3.1 Investigation points for capture of NPS pollution ··· 36
Figure 3.2 Experimental device and schematic diagram for the evaluation of filtration efficiency ··· 44
Figure 3.3 Manufacturing process of test samples from NPS pollution ··· 45
Figure 4.1 SS monitoring result by road runoff (A site) ··· 48
Figure 4.2 SS monitoring result by road runoff (B site) ··· 49
Figure 4.3 Water quality analysis result at the time of maximum SS occurrence ··· 51
Figure 4.4 Particle size distribution result at the timeof maximum SS occurrence ··· 52
Figure 4.5 Particle size range-volume ratio at the timeof maximum SS occurrence ···· 53
Figure 4.6 Weight ratio of particle at the time of maximum SS occurrence ··· 55
Figure 4.7 Treatment facilities and process diagram ··· 57
Figure 4.8 Strom water treatment facilities ··· 59
Figure 4.9 Diagrams for optimal image simulation of device ··· 67
Figure 4.10 CFD simulation results by the inlet conditions (Cross-section velocity distribution) ··· 68
Figure 4.11 CFD simulation results by the inlet conditions (Longitudinal velocity distribution) ··· 70
ix
Figure 4.12 CFD simulation results by the inlet conditions
(Longitudinal velocity vector distribution) ··· 71 Figure 4.13 CFD simulation results by the inlet conditions
(0.6m height of the longitudinal velocity distribution) ··· 73 Figure 4.14 CFD simulation results by the inlet conditions
(0.6m height distribution of the longitudinal velocity vector) ··· 74 Figure 4.15 Streamline distribution simulation result for each inlet condition ··· 76 Figure 4.16 Diagram for installment of baffle ··· 78 Figure 4.17 CFD simulation results by baffle condition
(Longitudinal velocity distribution) ··· 79 Figure 4.18 CFD simulation results by baffle conditions
(Longitudinal velocity vector distribution) ··· 80 Figure 4.19 CFD simulation results by baffle condition
(Longitudinal velocity distribution at height of 0.6m) ··· 81 Figure 4.20 CFD simulation results by baffle condition
(Longitudinal velocity vector distribution at height of 0.6m) ··· 82 Figure 4.21 Simulation result of streamline by baffle conditions ··· 83 Figure 4.22 Motion simulation result of particle sedimentation by baffle conditions···· 85 Figure 4.23 Separating area for motion simulation of sedimentation behavior in facility 86 Figure 4.24 Distribution of particle(100 ∼150 ㎛) sedimentation by baffle conditions 87 Figure 4.25 Distribution of particle(150 ∼400 ㎛) sedimentation by baffle conditions 87 Figure 4.26 Change of head loss in road runoff duringfiltration time by each
filter media ··· 89 Figure 4.27 Exponential functions according to changing head loss in road runoff by
media ··· 90 Figure 4.28 Recurrence days’ calculation results of reaching time to limit head loss
by each filter media ··· 93 Figure 4.29 SS concentration variations by filter media’s height ··· 94
x
Figure 4.30 Primary linear regression of the SS concentration variations by filter
media’s height ··· 97
Figure 4.31 SS removal efficiency by each filter media ··· 100
Figure 4.32 COD removal efficiency by each filter media ··· 102
Figure 4.33 Zn removal efficiency by each filter media ··· 105
Figure 4.34 Cu removal efficiency by each filter media··· 106
Figure 4.35 Particle size distribution of treated water by filtration time for each filter media ··· 110
Figure 4.36 SS treatment efficiency classified by particles size distribution for each filter media ··· 112
Figure 4.37 SS average treatment efficiency of particles withsize (less than 100 ㎛ for each filter media) ··· 114
Figure 4.38 SEM analysis after ‧ before treatment for each filter media ··· 115
Figure 5.1 Flow and water quality during dry season for each storm water diverging tanks··· 119
Figure 5.2 Flow and water quality during rainfall in storm overflow diverging tank (C Point) ··· 120
Figure 5.3 Flow and water quality during rainfall in storm overflow diverging tank (D Point) ··· 120
Figure 5.4 Cumulative pollution load curve by C and D points (BOD, SS, T-P) ··· 122
Figure 5.5 Change of head loss CSOs duringfiltration time by each filter media ··· 124
Figure 5.6 Result of calculating recurrence days by CSOs for each filter medias ··· 125
Figure 5.7 SS removal efficiency by each filter media ··· 126
Figure 5.8 COD and BOD removal efficiency by each filter media ··· 129
1
CHAPTER 1 INTRODUCTION
1.1 Background
The impermeable area and the peak discharge volume have been consistently increasing due to widening of city development and renewal. Thus, distortion of water cycle has been serious problem compared to the past. In Korea, because of urbanization and industrialization followed by rapid economic development, water pollution of public waters became a serious issue. Although the problem by PS pollutants is decreasing by the installation of environment facilities, reduction measure of non-point source (NPS) pollution is insufficient because characteristics and generation rate are difficult to determine.
Point source (PS) pollution does not have large fluctuation in discharges because they mainly consist of home sewage and industrial sewage and are generated consistently at a certain area. On the other hand, NPS pollution are defined as pollution sources that randomly emit water pollutants at unspecified areas such as city, roads, farmland, mountains, constructions sites, etc. according to “Water Quality and Ecosystem Conservation Act” in Article 2, paragraph 2.
NPS pollution generated to watershed at particular time, such as during rainfall event, are generally caused by land-use, and time and source location of occurrence are not clearly identified. Therefore, they are largely affected by environmental and hydrological factors which make efficient management of NPS pollution difficult.
In the United States, it is reported that about 50% of the water pollution of river is caused by NPS pollution.
2
In case of closed watershed in Korea, about 80% of the water pollution is due to the effect of NPS pollution. (Kim et al., 2004) According to the basis of pollutant loads from Paldang Dam watershed, in case of BOD loads, PS pollutant is 39% and NPS pollutant loads is 61%. For T-N, PS pollutant loads is 19% and NPS pollutants is 81%. For T-P, PS pollutant loads is 30%, and NPS pollutant loads are 70%. Clearly, all pollutants such as BOD, T-N, T-P, etc. are largely affected by pollutants loads of NPS sources. (Lee et al., 2002)
Soil among NPS pollutants is a pollutant that accounts for a large portion of the storm water runoff. It gives catastrophic impact on photosynthesis, respiration, growth, reproduction of aquatic organisms. Nutrients, metals, hydrocarbons, and other contaminants are adsorbed in soil and do move along with soil. Nutrients such as nitrogen and phosphorus can be used as a fertilizer and nutrients are leaked from houses, lawn of golf course, farmland, urban roads, and sewers. Lead, zinc, cadmium, copper, nickel, and other heavy metals are commonly detected substance in urban storm water runoff. 50% of the heavy metals that are flowing into rivers are discharged from soil as a medium.
First of all, as a way to manage such NPS sources, the artificial effect of development of nature should be minimized, and LIDA (Low Impact Development Approaches) should consider rainfall itself as the water source and manage the rainfall on development area. The goal of management should be maintenance of natural resources, soil condition, forest, terrain characteristics, native plants on wetland, etc. to their natural and original states even after development. In other words, rainfall and storm water runoff are managed in developing area by applying small-scale facilities that can reproduce the natural processes such as infiltration, evapotranspiration, and storage in the area.
Second way to manage NPS pollutants is a device type facility as an active way. Among the device type facilities, filtration-type facility is to handle NPS pollution using filter media
3
such as soil and sand. In case of adoption filter type device, the evaluation of size of pollutant particles is required because filtration efficiency depends on the size of pollutant particles.
To remove NPS pollution through device type facility, it is necessary to full comprehension of occurrence characteristics of NPS pollutants and also evaluation of elimination characteristics of device-type facilities
.
4
1.2 Objectives
In this study, we evaluated filtration efficiency of micro particle from NPS pollutants with a focus on road runoff and Combined Sewer Overflows (CSOs), which are two major representatives of pollutants that largely affect water quality of rivers among NPS pollutants.
To examine the applicability of sedimentation and filtration process as a treatment technology of NPS pollutants, we comprehended the characteristics of generation and sedimentation of pollutants. We intended to propose a method to increase the applicability of sedimentation and filtration treatment process by evaluation of the filter media as a main variable in application of those characteristics to filtration treatment process.
1.3 Content and scope of the study
For the study of the occurrence characteristics of NPS pollutants, occurrence characteristics of existing study were researched. Based on the research, we searched for the characteristics of pollutants by applying NPS pollutant to the filtration treatment process.
For understanding of characteristics of pollutants, road runoff that comes from roads, bridges, and parking lots and CSOs selected from combined sewer and storm overflow chambers were chosen as NPS pollutants.
In previous studies, the main characteristics of NPS pollutants were divided into particulate and soluble parts. Also, sedimentation and filtration treatment process were presented as applied technology for elimination of micro particles. Therefore, in this study, we analyzed the size of pollutant particles at the points of occurrence and suggested the application of filtration process as a treatment technology based on the study.
5
Since filter media as a key factor of filtration treatment process, floatable filter media and non-floatable filter media that commonly applied were selected to examine the efficiency before and after the filtration process. For non-floatable filter media, Zeolite, which possesses nature of adhesion, and for floatable filter media, Expanded Polypropylene (EPP), Expanded Polystyrene (EPS), and Perlite, considering scope of development and intensity of filter media, were chosen to be examined applicability as filter media.
To evaluate filtration process enduring time as a method to examine the treatment efficiency, the generation time of overflows at designing standard was evaluated. For each filter media, the treatment efficiency of particulate and soluble pollutants was evaluated. In addition, inside the filtration equipment, treatment efficiency was evaluated for each filter-layer for the safety of treatment.
Also, through the modeling of Computational Fluid Dynamics (CFD), for proper treatment as well as sedimentation efficiency of particulate pollutants (>100㎛) that gravitational sedimentation is possible, we intended to develop an efficient storm water device by means of suggesting the design criteria of optimal shape for treatment facility.
The details of study are followings. :
With literature research of efficiency of filtration treatment process for NPS pollutants and CSOs, we analyzed the generation and discharge characteristics of each pollution sources and such operation of establishment of existing treatment facilities.
In order to progress in research for generation characteristics and filtration treatment of NPS sources, the target research area was first selected. Next, Sample was collected and
6
analyzed. Then, filter media selection and characteristics analysis were carried out for comparative experiment.
As an analysis of filtration treatment efficiency of road runoff, size distribution curve and generation characteristics of each pollutant were examined. For analysis of sedimentation characteristics, quantity analysis was implemented to suggest result of CFD modeling.
Moreover, to evaluate the efficiency of filtration treatment process from road runoff, head loss, concentration, and process efficiency were checked for each filter media. Through SEM analysis, mechanism of filtration process efficiency was implemented.
For the efficiency analysis of CSOs, flow and water quality at rainfall and dry weather were measured in experimental site. Also, loss of head and treatment efficiency of SS, BOD, COD, T-N, T-P for each filter media were confirmed.
7
CHAPTER 2 LITERATURE REVIEW
2.1 Characteristics of NPS pollution
Because NPS pollutants flows into rivers through surface during rainfall, condition of nature, such as intensity and amount of rainfall, soil quality and artificial conditions like land-use, types and amount of cumulated pollutants during dry season, population density, development have large impacts. In this section, generation characteristics of NPS pollutants by land-use, generation and discharge characteristics of urban nonpoint pollutions and road runoff are described.
2.1.1 Pollution load by land-use
When we examined the discharges characteristics of NPS classified by land-use, we could sort them as urban land-use and rural land-use metropolitan land-use refers to houses, industrial complexes, and road constructions which increase impermeable surface area. Non-metropolitan land-use refers to type of land-use such as farmland construction, sports facility installation that maintain permeable layer but generate extra environmental loads due to development.
NPS pollutants, depending on land-use condition, differ in generation and emissions characteristics. Therefore, for the efficient reduction of NPS pollution, understanding of NPS pollution properties in relation to land-use. (Ministry of Environment, 2010) Forest area is generally settled, but nutrients and sedimentation are released from the basin by heavy rain in short term and by forest destruction in the long term.
8
In farmland, most of pollutants that are generated are discharged with rainfall, and the concentration of pollutants is fairly low, but pollutant loads are shown fairly large because of large occurrence surface area.
The main sources of generation are surface soil from cultivation, elimination of vegetation, negligence of soil during non-cultivation, fertilizers, animal wastes for soil improvement, and supply of irrigation.
In urban area, the pollutants that are generated by residential, commercial, industrial and other activities vary in types and are highly concentrated. In other words, the pollutants in urban area have greater loads per unit area compared to other land-use, and they contain not only general pollutants but also various toxic substances, so they can make serious impact on water quality. (Ministry of Environment, 2006)
NPS pollutants might vary due to particular property of the area. However, as chart 2.1 describes, in case of cities, industrial and development project areas, many particulate pollutants and heavy metals that are deposited on surface discharge all together at the beginning of rainfall. In farmlands, nutrients such as soil, nitrogen are commonly released. (Ministry of Environment, 2006)
Lee (2001) compared the nature of NPS outflow that affects critically on water pollution of Paldang Dam water supply. The study showed leakage characteristics in case of NPS pollution that outflow amount and concentration of pollutants varies a lot in accordance with characteristics of the land-use and rainfall type.
9
For each representative watershed, because pollutants show up similar time as peak flow rather than peak concentration, pollutant loads is more affected by flow rate than concentration of pollutant.
Discharge Characteristics of BOD, COD, SS, and T-P showed a large range of fluctuation depending on runoff during rainfall, but in case of T-N, the fluctuation of concentration by rainfall was the lowest, so that it is affected the least by runoff.
In the case of the BOD loads by land-use, forest/resort area was 1.53kg/ha/year when the rainfall was 140.4mm, farm/field was 1.93kg/ha/year when the rainfall was 84.9mm, and urban area was 22.84kg/ha/year when the rainfall was 72.94mm. Thus, although the rainfall in urban areas was smallest, the BOD loads by NPS pollution were very high, relative to forest/resort area.
10
Table 2.1 NPS pollution and pollutants by land-uses (MOE, 2006)
Land-use Detail sources Main pollutants
Urban Area
▸ Road and Bridge Construction ▸ Transform land-use type ▸ Storm water and CSOs ▸ Surface runoff
▸ Road surface runoff, etc.
Soil, Impurities, Bacteria, Nutrients, Heavy metals Agriculture area
Agriculture ▸ Rice paddies, fields, orchards, fish farm, such as slope failure
Sediment, Nutrients, Pesticides
Farm ▸ Grassland, farm, storage and use of
livestock Sediment, Bacteria Nutrients
Industrial Area
▸ Combined sewer leaks in sewer and solid ▸ Ground and road surface runoff
▸ Industrial waste accidents and leaks ▸ Raw materials and waste are loaded in the
field
Sediment, Nutrients, Oil, Heavy metals
Development Area
▸ Works leaking muddy water
▸Abandoned waste building materials and various construction waste
Sediment, Oil, Heavy metals, Impurities
Shin et al. (2001) investigated the amount of NPS pollution runoff per unit area at Paldang Dam water supply, and the amount of runoff of SS, BOD, COD, T-P, and T-N were 423.4, 20.0, 56.6, 2.6, 20.9 kg/ha/year respectively. Moreover, unit measurement by land-uses considering the livestock breeding conditions was suggested. In case of rice field, the runoff of COD, T-N, and T-P were 173.6, 74.26, 7.7 kg/ha/year respectively. For field, the runoff of COD, T-N, and T-P were respectively 63.0, 14.0, 4.2 kg/ha/year.
11
For mountains, the runoff of COD was 24.8 that of TN were 11.2 that of TP was 0.4 kg/ha/year. And in case of livestock field, the runoff of COD, TN, and TP was 14.7, 3.8, 0.3kg/ha/year respectively.
Lee et al. (2002) suggested basic unit of NPS pollution at the Paldang Dam Water Supply according to land-use by calculating for each water system. According to each water system, the basic unit for each land-use was quite high in Kyung-an stream, but there were not much difference compared to that of the Bookhan River and the Namhan River Basin.
Table 2.2 Unit value of NPS pollution by land-uses
(Lee, hyeondong, etc., 2002)
Watershed Land-use Type
NPS Runoff Loading(kg/ha/year)
BOD COD SS TOC T-N T-P
North Han River Forest/Resort 3.4 7.2 333.4 1.0 1.3 0.100 Crops 19.3 34.5 355.6 5.1 6.8 0.528 Urban 370.6 1,844.7 9,462.3 72.3 121.0 3.442 South Han River Forest/Resort 3.2 33.7 325.4 0.9 1.1 0.096 Crops 18.9 33.7 348.4 5.0 6.6 0.516 Urban 363.2 1,807.9 9,273.5 70.9 118.6 3.373 Kyung-an River Forest/Resort 3.7 7.6 342.0 1.0 1.4 0.104 Crops 19.8 35.4 364.0 5.2 7.0 0.542 Urban 379.2 1,887.7 9,682.5 74.0 123.9 3.522
12
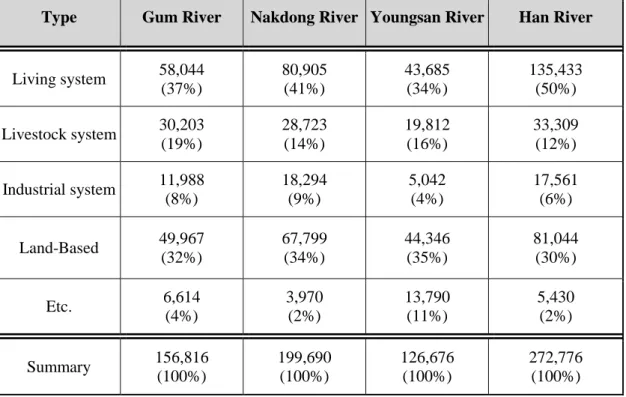
Table 2.3 Water pollution load by pollution sources of river watershed
Type Gum River Nakdong River Youngsan River Han River
Living system 58,044 (37%) 80,905 (41%) 43,685 (34%) 135,433 (50%) Livestock system 30,203 (19%) 28,723 (14%) 19,812 (16%) 33,309 (12%) Industrial system 11,988 (8%) 18,294 (9%) 5,042 (4%) 17,561 (6%) Land-Based 49,967 (32%) 67,799 (34%) 44,346 (35%) 81,044 (30%) Etc. 6,614 (4%) 3,970 (2%) 13,790 (11%) 5,430 (2%) Summary 156,816 (100%) 199,690 (100%) 126,676 (100%) 272,776 (100%)
According to 2003 Water environment management Plan, 30~35% of water quality was affected by soil pollutants that occupies most of non-point pollution, and if effects of sewer leakage other than land-based pollution are included, it was expected that the weight of impact would increase by 65~70% in 2015.
2.1.2 Characteristics of NPS in urban area
Because urban area has high ratio of impermeable imperviousness among total river area, rainfall runoff and change of concentrations of water quality changes rapidly.
The runoff flow rate was raised sharply during rainfall, and when rainfall terminated, the flow rate was rapidly decreased and recovered with short amount of time. Hydrological phenomena in urban area are very sensitive to changes of rainfall. Generally, in urban areas,
13
early stage of runoff phenomena stand out at the beginning of rainfall, so maximum pollution loads runoff proceed maximum flow rate.
Pollution loads per unit area of NPS pollutants, which are discharged in urban areas, are highly concentrated compared to other land-used characteristics, and they contain organic matter, nutrients, heavy matter as well as toxic substances.
In general, compared to pre-development district, the discharges of NPS pollutants such as BOD and SS have been increased 92 times and 24 times respectively. Due to increase of impermeable area by urbanization, large amount of NPS pollution were released to public waters during rainfall, which increase the problem of water pollution. (Choi, 1998)
In addition, in the case of urban areas, due to various development projects and vigorous commercial activity, the increase in traffic, a lot of pollutants have been accumulated in road surface. Also, various shops, traditional market, and gas stations also accumulate heavy metals, nitrogen, organic substances such as petroleum hydrocarbons which become a major cause of ecological destruction like water pollution and death of fish. Within urban areas, the type of land-use is subdivided. Therefore, the outflow of NPS pollutants differs a lot by the types of land-use. In other words, among land-use in urban areas, areas with many parks and grassland release less amount of pollutant compared to the area with many commercial and industrial sites. Those areas have large amount of outflow (runoff) of non-point pollutant due to quite a number of impermeable areas and emissions of pollutants.
In the case of residential areas, depending on the effects of housing density, vegetation, etc., amount of discharge of NPS varies. Table 2.4 demonstrates that according to once case in which the NPS loads were compared by the types of land-use in urban areas, low density and medium-density residential area shows higher concentration of BOD, COD while industrial,
14
commercial area and roads showed high concentration of micro-particle substances and heavy metals.
Table 2.4 NPS pollution in urban area (unit : mg/L)
land-use BOD COD TSS TDS T-P TKN Pb Cu Zn Cd Low-density residential 38 124 70 144 0.52 3.32 0.057 0.026 0.161 0.004 Medium-density residential 38 124 70 144 0.52 3.32 0.180 0.047 0.176 0.004 High-density residential 15 79 97 189 0.24 1.17 0.041 0.033 0.218 0.003 Commercial area 21 80 77 294 0.33 1.74 0.049 0.037 0.156 0.003 Industrial area 24 85 149 202 0.32 2.08 0.072 0.058 0.671 0.005 Road 24 103 141 294 0.43 1.82 0.049 0.037 0.158 0.003 Source: International Erosion Control Association, 2002
In the Jin et al. (2006) through the urban areas of Youngsan River region, combined sewer and Pungyoungjeong stream and YongBong stream property of sewer region the flow loads classified by land-use were calculated. Discharge characterization of NPS pollutants in urban areas were 4.43~14.22mg/L for BOD and EMC, 8.27~18.81mg/L for COD, 35.76~358.86mg/L for SS, 1.61~7.13mg/L for T-N and 0.03~0.46mg/L for T-P, Moreover, the discharge characterization of NPS pollution at sewer drainage areas for BOD was 20.24~32.28mg/L, 38.96~56.17mg/L for COD, 65.87~202.78mg/L for SS, 5.50~6.59mg/L for T-N, 0.33~0.46mg/L for T-P.
15
2.1.3 Characteristics of road runoff
Due to the fact that road is a social base construction that connects broadband organizations, the pollutants that occurred in certain areas can easily move from one place to another.
Also, many highways and roads pass through water system and cities adjacently. Due to this characteristic, pollutants such as various organic and particulate materials, heavy metals, etc. are cumulated on the highways during dry period, and during rainfall, these pollutants flow through the nearby water system and land which become the permanent internal pollution source and affect seriously to water quality and ground water. The generation type of NPS pollution and the main types of pollutants are shown in table 2.5.
16
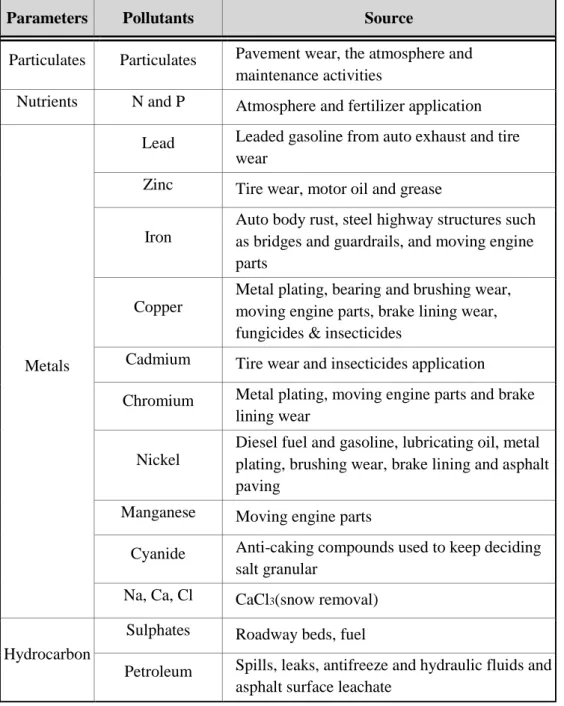
Table 2.5 NPS pollution occurrence types and materials on the road
Parameters Pollutants Source
Particulates Particulates Pavement wear, the atmosphere and maintenance activities
Nutrients N and P Atmosphere and fertilizer application
Metals
Lead Leaded gasoline from auto exhaust and tire wear
Zinc Tire wear, motor oil and grease
Iron
Auto body rust, steel highway structures such as bridges and guardrails, and moving engine parts
Copper
Metal plating, bearing and brushing wear, moving engine parts, brake lining wear, fungicides & insecticides
Cadmium Tire wear and insecticides application Chromium Metal plating, moving engine parts and brake
lining wear Nickel
Diesel fuel and gasoline, lubricating oil, metal plating, brushing wear, brake lining and asphalt paving
Manganese Moving engine parts
Cyanide Anti-caking compounds used to keep deciding salt granular
Na, Ca, Cl CaCl3(snow removal)
Hydrocarbon
Sulphates Roadway beds, fuel
Petroleum Spills, leaks, antifreeze and hydraulic fluids and asphalt surface leachate
Source: USEPA, 1994
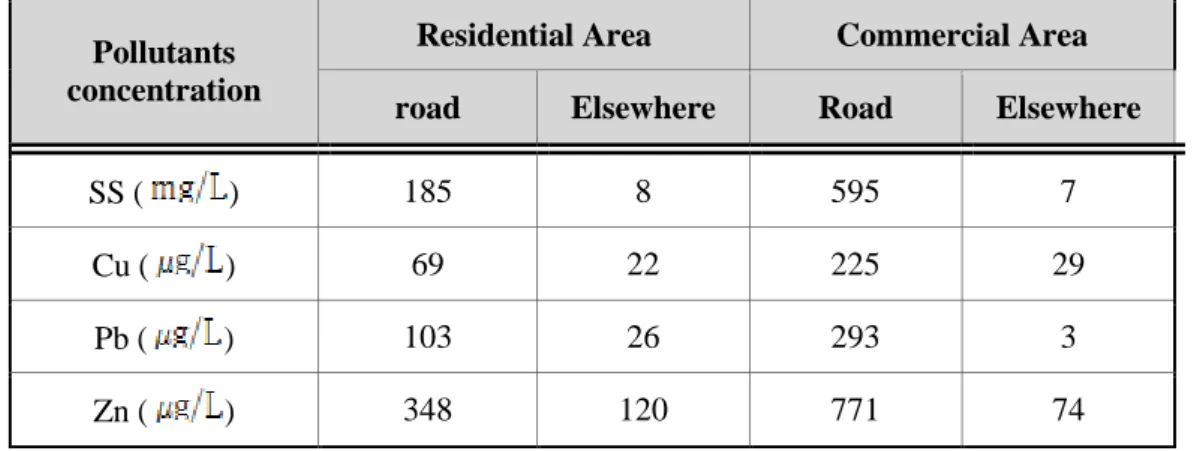
Table 2.6 summarizes the study of concentration of pollutants in storm water runoff that are caused in roads of commercial and residential area to investigate the concentration of pollutants occurred on roads by types of land-use. The result was that road areas showed 20~80
17
times higher concentration for particulate substances and 3~10 times higher concentration for heavy metal compared to other areas.
Table 2.6 Comparison with the pollutants concentration on the road and elsewhere
Pollutants concentration
Residential Area Commercial Area
road Elsewhere Road Elsewhere
SS ( ) 185 8 595 7
Cu ( ) 69 22 225 29
Pb ( ) 103 26 293 3
Zn ( ) 348 120 771 74
Kim et, al. (2004) investigated on discharge characterization of NPS pollutants on the highway in the United States. It was calculate that TSS, COD, and oil & grease represented the range of 5~880mg/L, 13~780mg/L, 0.5~34mg/L respectively.
When EMC’s 95% confidence interval was examined, TSS, COD, Oil& grease, and TKN represented 102.8 ~ 216.4 mg/L, 104.5~251.8 mg/L, 5.4~10.6 mg/L, and 2.4~10.2 mg/L respectively.
The heavy metals that are found in high concentration in runoff are mainly Cu, Ni, Pb and Zn, and the range of Cu, Ni, Pb, and Zn were 10~1,000 , 1~400 , 1~200 , and 30~7,000 respectively.
Kim et al. (2011) concluded that after monitoring the rainfall events at bridge areas for 18 times, the dry period before rainfall showed the range of 1~45 days, and total rainfall sedimentation was 5.0~149mm, and rainfall duration time was 3.0~16.7hr. The result of examination of discharge characterization of NPS pollutants in wider range was that average
18
EMC represented that value of TSS, COD, T-N, and T-P were 94.94mg/L, 23.37 mg/L, 4.16 mg/L, and 1.01 mg/L respectively.
2.2 Filtration efficiency from road runoff
For the effective prevention of pollutants in road runoff through filtration treatment process, the good grasp of size distribution of particles in runoff is necessary, and many study results on size distribution of runoff are reported in United States, and also few studies are reported in Korea.
2.2.1 Characteristics of particle size distribution
Detention Basin Analysis has reported that the particles in road runoff fall in range of 2∼100㎛, and National Urban Runoff Program reported that 90% of particles were distributed in range of 1∼100㎛.
Municipal Research & Service Center (of Washington) reported that distribution of 90% of bigger size particles falls under 400㎛.
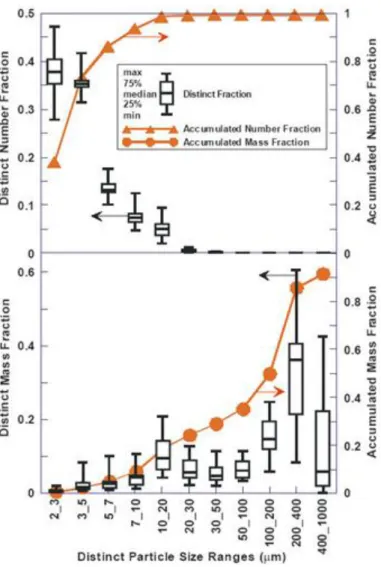
Figure 2.1 shows the study at three highways in LA for two years by Particle Size distribution of Highway Runoff and Modification Through storm water treatment, and most of number of particles were under 20㎛, and in quality, those of 400㎛ had the 90% of distribution.
19
Figure 2.1 Particle size distribution and accumulated mass fraction of
highway runoff (LA area)
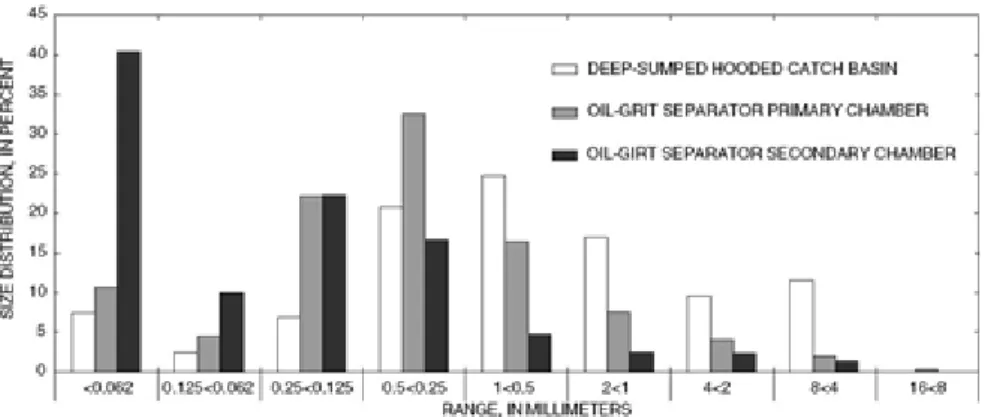
Figure 2.2 describes the research of particle distribution of solids in storm water inlet and oil-grit separators by Effectiveness of Three Best Management Practices for Highway-Runoff Quality along the Southeast Expressway. The study showed that micro particles(< 100㎛) with higher concentration of heavy metal pollution were mostly discharged from first chamber of storm water inlet and oil-Grift Separator. Therefore, highly expensive separation method by sedimentation rather than filtration type device would not give a satisfactory treatment for micro-particles and heavy metals in road runoff.
20
Figure 2.2 Particle-size distribution of a sample of bottom sediment
collected from three oil-grit separators located along
the Southeast Expressway, Boston
Figure 2.3 describes the movement characterization classified by size of particles and Figure 2.4 describes the size distribution of road runoff during rainfall. Most of particles of road runoff that are in range of 1∼100㎛ are affected by fluid rather than gravitational sedimentation, and the domestic studies corresponds with studies in foreign countries.
Figure 2.3 Conceptual schematic of movement characterization
classified by size of particles
21
Figure 2.4 Size distribution of road runoff during rainfall
Cho et al. (2007) reported that most of particles in bridge runoff had size of 10∼20㎛, and depending on rainfall duration time, the size increased. In details, the size of particles hit the maximum at the beginning of peak runoff and drastically decreased after the maximum point.
Lee et al. (2005) stated that according to the examination of particle size of road runoff, range of Dmean value was 6.7∼23.4㎛ and range of D90 was 36.2∼105.2㎛ and the average particle size of road runoff was approximately 20㎛.
2.2.2 Efficiency of filtration devices
In United States, pre and post control techniques have been developed, and mainly passive control method is applied, which ease of securing available land and security of land for installing passive treatment facility when planning of road constructions are on the premise. Therefore, the studies like filtration that can be applied to land with smaller area are comparably small.
22
In the case of domestic region, as the treatment facilities for NPS pollution were legalized, many studies concerning treatment methods are in progress. With different condition from United State which security of land for facilities are not at ease, consumer demands more for device type facilities which require less land.
In this regard, until recently, vortex-type device such as CDS, DD have been applied a lot, but people perceive vortex-type devices are not suitable for the road runoff with particle size less than 200um, and Ministry of Environment also points out this problem with guidelines.
Kim(2006) experimented on down flow filtration research about EPP (1∼3), zeolite (bi ocell), zeolite (1∼3), Inpakpalm (1∼3), Ferox (1∼3), GAC (2.5∼5). The experiment showed that filtration speed and removal rate were inversely proportional, and SS removal rate were 39.7%, 5.3%, 43.3%, 60.4%, 39.1%, 21.1% respectively. Kim also experimented on EPP, GAC, and Zeolite considering treatment efficiency and filtration speed according to thickness of the filter layer.
Figure 2.5 Treatment efficiency by filter media
(Filter layer of 15cm)
23
Figure 2.5 shows the treatment efficiency in case of thickness filter layer set as 15cm. Also, the result of filtration duration time test about zeolite that has highest treatment efficiency demonstrated that setting initial stage as 20cm and average inflow SS concentration as 425mg/L, the filtration duration time was about 4 hours 25 minutes, and the relation between filtration speed and time was . When the filtration was continued by , drastic increase in head loss was accompanied which increase was in number of meters.
Bang et al. (2005) researched on fiber, hydro ball, perlite, orchid stone, activated carbon, and sand setting the filtration rate as 200, 400, 600 m/day for each up flow and down flow.
For filtration rate, 200m/day, all filter media was close to or exceed 90% of the removal efficiency, and for 400m/day, 26~87% of removal efficiency was represented additionally, fiber showed the fair treatment efficiency and sand with particle size 38~63 showed bad treatment efficiency ( lower than 8%).
SS removal efficiency about filtration duration classified by the filter media showed almost no change for down flow. In case of up flow, sand showed the fastest degradation in treatment efficiency. With fly ash (particle size from 38 to 63mm) as a representative, SS removal with filtration time 200m/day for perlite (3~4mm) showed more than 90% treatment efficiency even after thirty minutes.
2.3 Case study of treatment facilities from road runoff
There are two types of NPS management techniques for water quality of public waters. They are structural method that are based on ecological and engineering technology such as sedimentation, construction of penetration zone and physical treatment facility, and non-structural method such as application of drain water standard and land-use regulation. Among
24
those, NPS pollution management facilities that reduce NPS by various physical facilities can be classified by storage, penetration, vegetation, device-type facilities. The device-type facilities to remove pollutants in road runoff have methods that are removal by filtration treatment facility, sedimentation, and storm water separation device.
Device-type NPS reduction technology that is to remove pollutants included in road runoff during rainfall uses physical and chemical device. The examples are filtration type using screen and sand and commercialized products (storm filter, storm receptor, Swirl concentrators/Vortex solids separators, and oily water separation device).
Screen is used to remove relatively large floatation or garbage mainly for pre-treatment, but recently they have been used in 1st treatment stage of sewage and waste water due to the advance in screening technology.
Sand filtration consists of filtration layer which is comprised of sand with various particle sizes (from peat to coarse sand) and gravel layer which is for releasing of filtrated water. The removal of pollutants are mainly processed by filtration by filter media, sedimentation from upper layer of sand, but sand filtration has limitation that blockage occurs as time proceeds, so prompt removal of surface sediments, leaves, miscellaneous trash, etc. is required. Therefore, sand filtration is generally used in small areas, and also can be used as pre-treatment in larger areas, but sufficient treatment effects cannot be obtained.
In domestic areas, many devices for reduction of NPS pollution are manufactured and installed, and main products are classified by method using physical flow of rainfall runoff and method using removal such as filtration, coagulation to reduce pollution loads. Among those, the pros and cons of device type facilities that are combined with double filtration facility are shown in table 2.7.
25
Table 2.7 Analysis of storm water treatment using filtration
Advantages Disadvantages
1. Attached to suspended solids and solid contaminants can be removed 2. Possible to apply various filter media
such as sand
3. Effectively remove bacteria and algae
4. Can be installed in a variety of formats
1. In a large drainage area unsuitable 2. Because it has a direct impact on the
efficiency, filtration layer were required deleting and replacing periodic
3. Inlet to the pre-treatment facilities (sedimentation) is required 4. Management constraints on the
installation location
5. This is applicable only in impervious area
Among NPS which occurs during rainfall, the road runoff especially that occurs at impermeable lands or roads have been pointed out with its water quality risk, so the application performances about the practical techniques and domestic and abroad studies have been increasing. Centered on advanced countries, since 1970s, many techniques listed in table 2.8 have been developed.
Table 2.8 shows the rate of removal according to each treatment process monitored by National Management Measures to Control NPS pollution from Urban Areas.
26
Table 2.8 Pollutants removal rate by storm water treatment devices
(USEPA, 2005)
Runoff treatment median pollutant removal(percent) or control practice category
Pollutant removal rate (%)
No. of studies TSS T-P OP T-N NOx Cu Zn Quality Control Pond 3 3 19 N/A 5 9 10 5 Dry Extended Detention Pond 6 61 20 N/A 31 -2 29 29
Dry Ponds 9 47 19 N/A 25 3.5 26 26
Wet Extended Detention Pond 14 80 55 69 35 63 44 69 Multiple-Pond System 1 91 76 N/A N/A 87 N/A N/A
Wet Pond 28 79 49 39 32 36 58 65
Wet Ponds 43 80 51 65 33 43 57 66
Shallow Marsh 20 83 43 66 26 73 33 42
Extended Detention Wetland 4 69 39 59 56 35 N/A -74 Pond/Wetland System 10 71 56 37 19 40 58 56 Submerged Gravel Wetland 2 83 64 14 19 81 21 55
Wetlands 36 76 49 48 30 67 40 44
Organic Filter 7 88 61 30 41 -15 66 89 Perimeter Sand Filter 3 79 41 68 47 -53 25 69 Surface Sand Filter 7 87 59 N/A 31.5 -13 49 80 Vertical Sand Filter 2 58 45 21 15 -87 32 56
Bio retention 65 N/A 49 16 97 95 - -
Filtering Practices 18 86 59 57 38 -14 49 88 Infiltration Trench 3 100 42 100 42 82 N/A N/A
Porous Pavement 3 95 65 10 83 N/A N/A 99
Ditches 9 31 -16 N/A -9 24 14 0
Grass Channel 3 68 29 32 N/A -25 42 45
Dry Swale 4 93 83 70 92 90 70 86
Wet Swale 2 74 28 -31 40 31 11 33
Open Channel Practices 9 81 34 1.0 84 31 51 71 Oil-Grit Separator 1 -8 -41 40 N/A 47 -11 17
27
2.4 Characteristics of CSOs
At the area of combined sewer where sewage and rainfall runoff are transferred together during rainfall (only sewage during dry period), increase of discharge and change of concentration of pollution are large.
The road runoff that occurred during rainfall inflow to sewage including various pollutants cumulated on surface of road. In case of exceeding capacity of intercepting sewer pipe, that is not carried to sewage treatment plant, and non-intercepting discharge are out flowed to river via storm overflow diverging tank. Likewise, CSOs is discharged to receiving body of water (like river, dam, and etc.) because it exceeds the intercepting sewer capacity. Because CSOs contains road runoff as well as house sewage, it contains various pollutants and the effects on receiving body of water are known to be serious.
Among CSOs, early stage rainfall runoff contains highly concentrated hospital microbes or harmful materials due to the sediment in sewer, and if left untreated, public hygiene and ecosystem can be damaged. It also contains problem in appearance of landscapes due to trash and concomitants. (Japan sewage work association, 2002)
When the characterization of CSOs is examined during dry and rainfall period, dry period shows the variations in 2~3 times of water quality, while the range of variations was more than 10 times in case of during rainfall. According to report of EPA in US, CSOs contains all the contaminants like as organic materials, bacteria, nutrients, ammonia, turbidity, TSS, and toxic substances only except for acidic waste water. Therefore, those pollutants aggravate the water pollution by discharging a lot of amount via overflow drainage, and causes environmental pollution by flowing to river or lakes.
28
Chebbo et al. (1992) analyzed the floatable solid in runoff during rainfall, and reported that mostly the distribution of solid (66~85%) was under 100㎛. Also, it was reported that if the sediment was removed up to 3~44㎛ (average sedimentation velocity : 4~11m/hr), up to 69~87% of total pollution load (in case of COD) were possible to remove.
Milne et al. (1996) interpreted the size distribution result in order to characterize the mutual effects between large solids and sewer sediments in combined network, and Becker et al. (1996) analyzed that most of particulate COD and total phosphorous sediment under the range of 0.04~0.9cm/s in case of road runoff.
In addition, Chancelier et al. (1998) proposed the mathematical model which represented property of settlement of pollutants by each sedimentation experimental methods. Meanwhile, Lee et al. (2005) reported that range of average particle size was 6.7~23㎛ as the result of analysis of size distribution of road runoffs. Also, Han et al. (2002, 2003) studied on variation characteristics of floc size in potable water treatment process.
Yoon et al. (2006) measured the size distribution of CSOs, sewage during dry season, and surface runoff during rainfall by using the laser diffraction measurement method. According to analysis result of particles numbers, the median of particle size by sample type was similar for dry sewer and surface runoff (0.5㎛), but the range of size was 0.3~0.6㎛ in sewer during dry season, 0.3~45㎛ in combined sewer outflows, and 0.3~313㎛ in surface runoff, which showed very big variation in CSOs and surface runoffs. For volume analysis of particles, the median of sewage in the dry season and CSOs were 85㎛ and median of surface runoff was 50㎛, which is smaller. For frequency curve of the surface area of particles, it was analyzed that sewage in the dry season was 2.5㎛ and CSOs was 15.3㎛ and surface runoff was 9.0㎛. It was assumed that size distribution became very diverse because the solids deposited in dry season
29
and the deposited solids were mixed and flowed with large particles and storm water during rainfall.
Lee (2004) measured the change of water quality of CSOs which flowed into K sewage treatment plant, and the flowing concentration of SS was 14~812mg/L, averagely 228mg/L. Concentration of COD, BOD, TN and TP were 14~812 mg/L, 35~449 mg/L, 28~219 mg/L, 23~93 mg/L, 0~7 mg/L respectively, and SS change curve of CSOs and change of T-N, T-P, COD represented very similar trend.
Lee et al. (2010) proposed that when the flow rate of CSOs was measured, the flow rate rapidly increased 2 hours after the rainfall, which was two times greater than flow rate at same time during dry season. For particle distribution of the dry season, particle range 5~3000㎛ were distributed. There was significant amount of more than the particles size of 180㎛ during rainfall. During dry and rainy season, the concentration of COD, BOD, T-N, T-P did not change, but concentration of SS during rainy season increase 5.7 times greater than dry season due to the inflow of road surface sediments and big size particles by early stage storm water.
2.5 Filtration efficiency from CSOs
Yoon et al. (2006) conducted the sedimentation study by the depth of sedimentation column using CSOs. Sedimentation rate of pollutants by rainfall showed very different results: The range of removal rates was large, and compared to median curve of pollutants of CSOs, sedimentation rate curve of dry season sewage and surface runoff showed the tendency to fall downward. This means that sediment removal of CSOs is possible in despite of larger surface load amount and shorter residence time than dry sewage and surface runoff. Also, by this fact, we can conclude that pollutants by the re-flotation of sewer sediment have significant affect.
30
COD and SS showed similar sedimentation velocity change proportional to concentration. In other words, the higher the concentration at the beginning of study, the higher the removal rate of settling speed. This showed the similar trend to the study result of Randall et al. (1982) that early concentration and SS removal amount by sedimentation were proportional. For COD, setting 0.1cm/s as average sedimentation velocity, the removal rate of sedimentation velocity was 10% while it was respectively 40%, 20% for CSOs and surface runoff. For SS, CSOs was 50% and surface runoff was 20%.
Lee (2004) introduced DAF (Dissolved Air Flotation) based on the fact that particulate pollutants take up the largest portion among pollutants in CSOs. When CSOs were treated with DAF, SS removal rate was more than 90%, and the particles size greater than 10㎛ were mostly removed. With same operating condition that showed 90% removal by DAF, the SS removal rate by sedimentation and flotation was respectively 53% and 37%.
When separating settlement for CSOs, the SS treatment efficiency was low, so filtration process is introduced (Tanaka et al., 1995). Filtration process was different from potable water treatment in that it has lots of suspended solids and lots of clogging-causing materials that can cause the blocking of filter pores, so introduction of sand filtration was difficult (Maeng et al., 2006).
As an alternative, Son et al. (2010) introduced the fiber filtration device. As the flow rate increase, the removal efficiency of suspended solids is lowered, but at speed exceeding about 750m3/m2/d, the treatment efficiency was not lowered significantly. T-P also showed the similar trend but compared to SS, T-P removal efficiency was relatively low.
31
Figure 2.6 Relationship between filtration velocity and removal rate
(Son et al., 2010)
Lee et al. (2010) treated CSOs using Vortex separator and continuous filtration process device, and the result was that removal efficiency of COD, BOD, T-N, T-P was 50%, 50%, 8%, 18%, respectively. The removal efficiency of Vortex separator was lower than fiber filtration device, but if fiber filtration device was operated alone, the treatment efficiency rapidly decreased because of fast blocking of fiber filter media by solids.
32
2.6 Case study of treatment facility from CSOs
The facility to reduce the discharge loads caused by CSOs has limitation in many respects such as efficiency, maintenance, and affordability. As methods to reduce CSOs discharge loads, increase of intercepting pipe capacity, separate sewer system, installment of storage facilities, and real-time control method can be used.
Intercepting pipe capacity expansion is the method to replace sewer pipe with larger capacity one. It is most common way but it increases traffic disorder, increases capacity and lowers efficiency of waste water treatment plant and has high construction cost.
Separate sewer system treats sewage without letting sewage flow into river during dry and rainy season without CSOs, however it is considered the efficiency of treatment plant and the applicability in the area. This is an effective way to reduce the overflows, but factors such as construction costs should be examined beforehand.
In general, more problems such as incorrect house connection to main pipe can occur due to the complex separate sewer compared to existing combined sewer system. Also, first flush in storm water sewer can be discharged into rivers, which become a fundamental problem. Therefore, the solution for this problem is required. (Kong et al., 2004)
Installment of storages at the combined sewer regions can not only reduce the overflow loads but also facilitate the installment and management due to function of reducing rainfall discharge for prevention of flood. Through this, we can cope with change of flow amount at ease. However, because it requires large space, there is a limitation to usage due to narrow land capacity in Korea, and the maintenance cost can be great due to the facility during storage period. In addition, it allows runoff (before discharge into the sewer) to stay at specific region, so the problem regarding public hygiene and public health can be raised (Gong et al., 2004).
33
Real-time control method uses computer to ensure the operation and control of the system. At the time of rainfall, the goal of real time control method is to copes with the state of flow in sewer and the change of rainfall type. To maximize the amount, it adjusts the pumping rate and location of flood control sluice. In other words, by measuring rainfall at multiple points, right amount of rainfall is calculated. Thus, optimal flow control method is derived. However, compared to general facilities, this method required complex and expensive devices. (Gong et al., 2004)
For managing CSOs, in case of USA, separate sewer system had been promoted to eliminate CSOs. Already in the 1960s, 122 local government 1,755 separate sewer system projects were in progress, but because of technical problems such as incorrect house connection caused by procedure to separate sewer system from combined sewer system and the monetary problem, the projects were changed from full-scale separate sewer system to mixed system. And for the combined sewer with the good condition of the pipeline, and overflow-control facilities were focused to install because it was concluded that it is better to treat first flush in early stage rainfall rather than change to separate sewer system.
In addition, in order to achieve the water quality standard of discharge line according to the CSOs maintenance policy announced by federal government in 1994, Nine Minimum Controls (NMC) was written and Long Term Control Plan (LTCP) were established.
In Japan, in order to reduce the pollution load, the reorganization of combined sewer (Retrofitting CSOs) project has been promoted, and established the policy on the ‘Guidelines and construction manual for reduction of CSOs’ published in 1982 that the goal was reducing CSOs loads to fewer than 5% of annual generation of BOD loads. In order to achieve this goal, method such as increase of intercepted capacity, improvement of storm overflow diverging
34
tanks, separate sewer system, inflow/infiltration reduction, construction of storm water storage tank, and outflow treatment facilities were suggested.
According to the revised the Sewerage Act Decree, the generation of overflow is regulated for improvement of sewer in case impact of rainfall is not great, and set discharge amount at its minimum by installment of screen at storm overflow diverging tanks. Also, in case of generation of overflow, the law set limit of event mean concentration (EMC) of BOD to less than 40 mg/L. (Gong et al., 2004)
35
CHAPTER 3 MATERIALS AND METHODS
3.1 Experimental sites
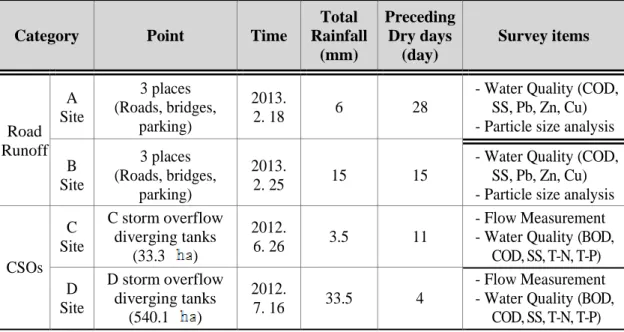
In this study, before the evaluating head loss, water quality treatment efficiency and particle size distribution for each filter media, we examined the particle size analysis and water quality of road runoff and CSOs generated at combined sewer storm overflow diverging tank in order to evaluate the discharge characterization of NPS during rainfall. In the case of road runoff, one-way four lanes highway, bridges, and three parking lots for each Area A and Area B in Gyeonggi-Do were examined, and for CSOs, storm overflow diverging tanks of Seoul urban area C and D that include drainage area of 33.3ha and 540.1ha were selected as point of analysis.
The overview of investigation points and the field photos of NPS discharge characteristics are shown in Table 3.1 and Figure 3.1.
Table 3.1 Summary of investigation points for capture of NPS pollution
Category Point Time
Total Rainfall (mm) Preceding Dry days (day) Survey items Road Runoff A Site 3 places (Roads, bridges, parking) 2013. 2. 18 6 28
- Water Quality (COD, SS, Pb, Zn, Cu) - Particle size analysis B Site 3 places (Roads, bridges, parking) 2013. 2. 25 15 15
- Water Quality (COD, SS, Pb, Zn, Cu) - Particle size analysis
CSOs C Site C storm overflow diverging tanks (33.3 ) 2012. 6. 26 3.5 11 - Flow Measurement - Water Quality (BOD,
COD, SS, T-N, T-P) D Site D storm overflow diverging tanks (540.1 ) 2012. 7. 16 33.5 4 - Flow Measurement - Water Quality (BOD,
36
vision Fields photos
Road Runoff CSOs C storm overflow diverging tanks D storm overflow diverging tanks
Figure 3.1 Investigation points for capture of NPS pollution.
The measurement of CSOs were conducted at the diverging tank that consist of various land forms such as residential, commercial, and roads form and has 33.3 ha drainage area and at the diverging thank with macro scale drainage area, 540.1 ha. The date of measurement was June 26th, 2012 when 3.5mm of rainfall occurred and July 16th, 2012 when 33.5mm of rainfall occurred.
37
3.2 Samplings and analysis
3.2.1 Samplings
In order to determine the First Flush during the rainfall, sampling was conducted at five minute intervals by sequentially increasing the yield interval depending on water quality. To measure discharge, PCM portable flow meter was used, and the details are shown in Table 3.2.
Table 3.2 Portable flow meter specifications
Division Contents Manufacture / Model NIVUS(Germany) / PCM3 Details Specifications Flow
∙ Method: Ultrasound (Doppler) method ∙ Flow range : 1.52 ~ 6.1m/s
∙ Accuracy : ±2%
Level
∙ Type : Fencing fast pressure conversion ∙ Range : 5mm ~ 3.5m
∙ Accuracy : ±0.085 Flow rate ∙ Accuracy : ±2%
3.2.2 Analysis
Preceding case study for road runoff states that toxic substances such as heavy metals are existed in fine particles.
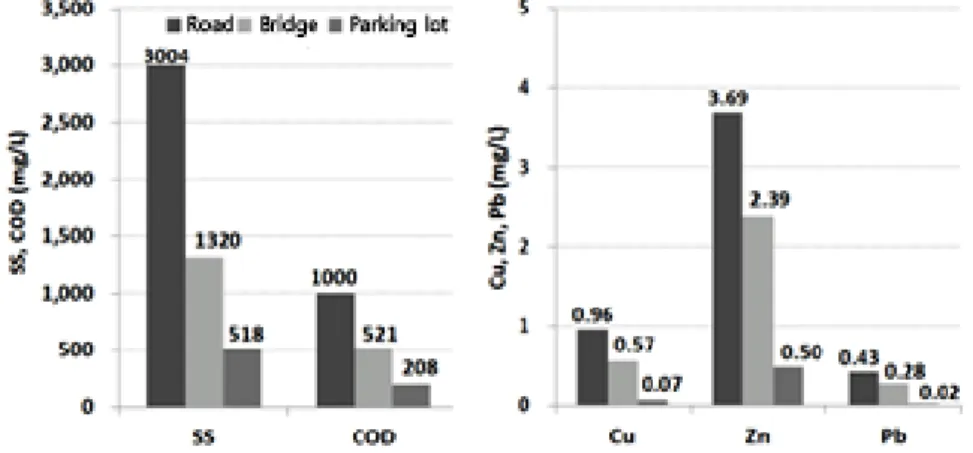
For water quality check, SS category was measured over time during rainfall, and then COD, Pb, Zn, Cu that contain heavy metals were analyzed for the sample that maximum SS
38
concentration was observed from each source. Additionally, size distribution analysis was conducted to examine the characteristics depending on size distribution.
The water quality categories about the collected water sample were analyzed according to standard method (APHA, 1995), and particle size analysis was conducted using Malvern’s Mastersizer 2000E, measuring from 0.1 ~ 1000㎛.
Heavy metals were analyzed using the ICP-MS. In specific, PerkinElmer's NEXION300X was used.
Specifications of each analyzer are shown in Table 3.3 and Table 3.4.
Table 3.3 Specifications of particle size analysis
Division Contents Manufacture / Model Malvern Instruments / Mastersizer 200E Details Specifications
. Measuring range - 0.1 ~ 1000 micrometer
. Various kinds of measurements - emulsions, suspensions and dry powders . Accordance with the terms of measurable Flexibility - provides a variety of
semi-automatic sample dispersion unit, 'plug and play' cassette system applies
. An accuracy - Malvern Quality Audit Standard in accordance with the measurement results Dv50 is around ± 1%
. Reproducibility - Dv50 measured under 1% RSD is superior in Malvern Quality Audit Standard
![[PDF] Cours de base complet sur les notations UML | Cours informatique](data:image/gif;base64,R0lGODlhAQABAIAAAP///wAAACH5BAEAAAAALAAAAAABAAEAAAICRAEAOw==)