O
pen
A
rchive
T
OULOUSE
A
rchive
O
uverte (
OATAO
)
OATAO is an open access repository that collects the work of Toulouse researchers and
makes it freely available over the web where possible.
This is an author-deposited version published in :
http://oatao.univ-toulouse.fr/
Eprints ID : 18782
The contribution was presented at MFI 2016 :
http://mfi2016.org/Main_Page
To cite this version : Wei, Qi and Bioucas-Dias, José M. and Dobigeon, Nicolas
and Tourneret, Jean-Yves and Godsill, Simon Blind model-based fusion of
multi-band and panchromatic images. (2016) In: IEEE International Conference on
Multisensor Fusion and Integration for Intelligent Systems (MFI 2016), 19
September 2016 - 21 September 2016 (Baden-Baden, Germany).
Any correspondence concerning this service should be sent to the repository
administrator:
[email protected]
Blind Model-Based Fusion of Multi-band and Panchromatic Images*
Qi Wei1, Jos´e Bioucas-Dias2, Nicolas Dobigeon3, Jean-Yves Tourneret3, and Simon Godsill1
Abstract— This paper proposes a blind model-based fusion method to combine a low-spatial resolution multi-band image and a high-spatial resolution panchromatic image. This method is blind in the sense that the spatial and spectral responses in the degradation model are unknown and estimated from the observed data pair. The Gaussian and total variation priors have been used to regularize the ill-posed fusion problem. The formulated optimization problem associated with the image fusion can be attacked efficiently using a recently developed robust multi-band image fusion algorithm in [1]. Experimental results including qualitative and quantitative ones show that the fused image can combine the spectral information from the multi-band image and the high spatial resolution information from the panchromatic image effectively with very competitive computational time.
Index Terms— image fusion, inverse problems, optimization, Sylvester equation
I. INTRODUCTION
Multi-band imaging generally suffers from the limited spatial resolution of the data acquisition devices, mainly due to an unsurpassable trade-off between spatial and spectral sensitivities [2]. To enhance its spatial resolution, fusing a multi-band image, more specifically, a multispectral (MS) image, with a high spatial resolution panchromatic (PAN) image, referred to as pansharpening, has been receiving particular attention in remote sensing [3], [4]. Note that an PAN image is a one-band image which has much higher spatial resolution than than a MS image.
Generally, the linear degradations modelled in the ob-served images, including the multi-band and PAN images, with respect to (w.r.t.) the target spatial and high-spectral image reduce to spatial and high-spectral transformations. Thus, the pansharpening problem can be interpreted as restor-ing a three dimensional cube from two degraded data-cubes. A more precise description of the problem formulation is the well-admitted linear degradation model provided as
YM = XBS + NM
yP= rX + nP
(1) where
• X∈ Rp×n is the full resolution target MS image and
each row is a vector obtained by rearranging each band.
*This work was supported by DSO Singapore.
1
Qi Wei and Simon Godsill are with Department of Engineering, University of Cambridge, CB2 1PZ, Cambridge, UK (e-mail: {qi.wei, sjg}@eng.cam.ac.uk)
2
Jos´e Bioucas-Dias is with Instituto de Telecomunicac¸˜oes and Instituto Superior T´ecnico, University of Lisbon, Portugal (email: [email protected])
3
Nicolas Dobigeon and Jean-Yves Tourneret are with Univer-sity of Toulouse, IRIT/INP-ENSEEIHT, 2 rue Camichel, BP 7122, 31071 Toulouse cedex 7, France (e-mail: {nicolas.dobigeon, jean-yves.tourneret}@enseeiht.fr)
• YM∈ Rp×m is the spatially degraded MS image. • yP∈ R
1×n is the spectral degraded PAN image. • B∈ Rn×n is a cyclic convolution operator. • S∈ Rn×m is a uniform downsampling operator. • r∈ R1×p is the spectral response of the PAN sensor. • NM ∈ Rp×m and nP ∈ R1×n are additive terms that
include both modeling errors and sensor noise.
• p is the number of bands in the MS image. • m is the number of pixels in each MS band. • n(> m) is the number of pixels in the PAN image.
Since the fusion problem is usually ill-posed, the Bayesian methodology offers a convenient way to regularize the prob-lem by defining appropriate prior distribution for the scene of interest given the observed MS and PAN images. More specifically, the posterior, which is the Bayesian inference engine, has two factors: a) the likelihood function, which is the probability density of the observed MS and PAN images given the target image, and b) the prior probability density of the target image, which promotes target images with desired properties, such as being segmentally smooth.
Computing the Bayesian estimators is a challenging task, mainly due to the large size of X and to the presence of the downsampling operator S, which prevents any direct use of the Fourier transform to diagonalize the blurring operator B. To overcome this difficulty, several computational strategies have been designed to approximate the estimators. Based on a Gaussian prior modeling, a Markov chain Monte Carlo (MCMC) algorithm has been implemented in [5] to generate a collection of samples asymptotically distributed according to the posterior distribution of X. The Bayesian estimators of X can then be approximated using these samples. Despite this formal appeal, MCMC-based methods have the major drawback of being computationally expensive, which pre-vents their effective use when processing images of large size. Relying on exactly the same prior model, the strategy developed in [6] exploits an alternating direction method of multipliers (ADMM) embedded in a block coordinate descent method (BCD) to compute the maximum a posterior (MAP) estimator of X. This optimization strategy allows the numerical complexity to be greatly decreased when compared to its MCMC counterpart. Based on a prior built from a sparse representation, the fusion problem is solved in [7], [8] with the split augmented Lagrangian shrinkage algorithm (SALSA) [9], which is an instance of ADMM. In [10], contrary to the algorithms described above, a much more efficient method is proposed to solve explicitly an underlying Sylvester equation (SE) associated with the fusion problem derived from (1), leading to an algorithm referred
to as Fast fUsion based on Sylvester Equation (FUSE). The MAP estimators associated with a Gaussian prior similar to [5], [6] can be directly computed thanks to the proposed strategy. When handling more complex priors such as [7], [8], the FUSE solution can be conveniently embedded within a conventional ADMM or a BCD algorithm. A more robust version of FUSE algorithm, which is termed as R-FUSE has been proposed recently in [1], getting rid of the invertibility assumption of blurring kernel. Besides, the core of this fast fusion algorithm has been extended and applied in single image super-resolution [11], [12].
In terms of the spatial blurring B and spectral response r, they are very often assumed known [5], [8]. In practice, how-ever, the information that is available about these responses is often scarce and/or somewhat inaccurate. In [7], the authors formulated an convex problem to estimate the spatial and spectral response, making only minimal assumptions, i.e., the spatial response has limited support and that both responses are relatively smooth.
In this work, we propose to first estimate the spatial and spectral responses, i.e., B and r, using the method in [7] and then fuse the offered MS and PAN images using the method in [1], leading to a blind multi-band image fusion method.
II. PROBLEM FORMULATION AND METHODOLOGY
A. Estimating the spatial and spectral responses
Following the strategy proposed in [7] and taking model (1) into account, we infer B and r by solving the following optimization problem
minimize
B,r !rYM− yPBS! 2
2+ λbφb(B) + λrφr(r) (2)
where φb(·) and φr(·) are quadratic regularizers, and
λb, λr≥ 0 are the respective regularization parameters. Note
that S is a uniformly downsampling operator, which contains only zeros and ones. This operator is uniquely defined by the downsampling ratio d = n/m, which can be obtained directly from the size of MS and PAN images. We refer the reader to [7] for more details about the estimation of B and r.
B. Fusing the multispectral and panchromatic images
Following statistical inference, i.e., maximizing the pos-terior distribution of the target image X, the optimization problem associated with the fusion problem following the linear model (1) can be formulated as
arg min X 1 2!YM− XBS! 2 F + 1 2!yP− rX! 2 2+ λφ(X) (3)
where the first two data fidelity terms are associated with the MS and PAN images and the last term φ(X) is a penalty ensuring appropriate prior/regularization. Note that ! · !F
represents the Frobenius norm. In this work, we propose to use a Gaussian prior [5] and a Total Variation (TV) prior [7] as follows. Gaussian:φ(X) = !X − ¯X!2 F TV:φ(X) = n X j=1 v u u t p X i=1 ! [(XDh)ij] 2 + [(XDv)ij] 2"
Note that the matrix ¯X represents the prior mean of target image and right multiplying by the matrices Dh and Dv
computes the horizontal and vertical discrete differences of an image, respectively. This optimization problem can be solved efficiently using the recently developed algorithm in [1].
Algorithm 1: Multi-band and PAN image fusion Input: YM, yP
// Estimating the blurring kernel B and spectral response r 1 { ˆB, ˆr} ← HySure (YM, yP); // cf. [7] // Fusing YM and yP 2 Xˆ ← R-FUSE # YM, yP, ˆB, ˆr $ ; // cf. [1] Output: ˆX C. Complexity Analysis
The most computationally expensive part of the proposed algorithm is the FFT and iFFT operations to the target image, which has a complexity of orderO(pn log n). More details about the complexity analysis of the HySure and R-FUSE algorithms can be found in [1], [7].
III. DATACOLLECTION
The dataset used in our experiments was acquired on May 30th, 2015, over Vancouver, Canada (49◦
15′
N 123◦
6′
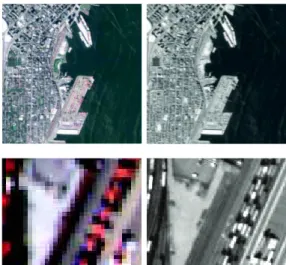
W), from the DEIMOS-2 satellite. It includes a PAN image at 1m resolution and a 4-band (red (R), green (G), blue (B) and near infrared (NIR) bands) MS image at4m resolution [13]. The MS and PAN images are calibrated and radiometrically corrected, by being manually orthorectified and resampled to a map grid. The two images cover exactly the same ground area, which are shown in Figs. 1. The size of selected MS image is 500 × 500 × 4 and the size of PAN image is 2000 × 2000. The target image considered here as the high-spatial multi-band image is of size2000 × 2000 × 4. Thus, we havep = 4, n = 20002
andm = 5002
. IV. EXPERIMENTAL RESULTS
In this section, the proposed algorithm are used to fuse the observed MS and PAN images with two different priors. The algorithm has been implemented using MATLAB R2015b on a computer with Intel(R) Core(TM) i7-4790 [email protected] and 16GB RAM.
A. Fusion quality metrics
As there is no ground-truth for this real dataset, we evaluate the fusion results by computing the reconstruction error (RE) defined in (4), the Sharpness Index (SI), and the
SIndex of an image as defined in [14]. The smaller RE and the larger SI and the S Index, the better the fusion.
RE= !YM− ˆXBS! 2
F+ !yP− r ˆX! 2
2 (4)
The SI and the its simplified version S Index are two interesting no-reference quality measures. The key idea was
Fig. 1. Observed MS and PAN images (top) with their zoomed parts (bottom). -0.005 0 0.005 0.01 0.015 0.02 0.025 MS bands
NIR-1 Red-2 Green-3 Blue-4
0 0.1 0.2 0.3 0.4 0.5 0.6 0.51101 0.47562 0.17248 0.00058
Estimated Spectral Blurring
Fig. 3. Estimated blurring kernel (left) and spectral response (right).
to quantize how much the regularity or total variation of the image was affected by the destruction of the phase information. As a sharp (or noise-free) image is generally much more sensitive to phase degradations than a blurry (or noisy) image, such a characterization of phase coherence is directly related to image quality.
B. Estimation of the spatial and spectral responses
The spectral and spatial responses of the sensors (B and r) were first estimated from the real-life data using the strategy in [7]. The values of λb and λr were both fixed to10 by
cross-calibration. The estimated spatial (blurring kernel) and spectral responses are shown in Figs. 3. The blurring kernel is approximately Gaussian shape and looks quite reasonable. The spectral ranges for MS and PAN images in Deimos-2 satellite is given in Table I. Note that the wavelength of the PAN image (560-900nm) covers the green (532 − 599nm), red (640 − 697nm) and NIR (770 − 892nm) bands and does not overlap with the blue band (466 − 525nm). This explains why the estimated weighting coefficient of the blue band (corresponding to the last point in the right of Figs. 3) is around zero.
C. Fusion of Multi-band and PAN images
In this section, we consider the Bayesian fusion of MS and PAN images with a Gaussian prior [5] and a TV
TABLE I
BANDS AND SPECTRAL RANGES FORDEIMOS-2SATELLITE
λ @ FWHM (nm)
Band min max
PAN 560 900
MS-1 (NIR) 770 892 MS-2 (Red) 640 697 MS-3 (Green) 532 599 MS-4 (Blue) 466 525
prior [7]. The associated optimization problem were solved using the R-FUSE algorithm in [1] and their performances were measured. To better illustrate the role of the priors, the fused result using a non-informative prior (e.g., setting the Gaussian prior regularization parameter to a very small constant), i.e., the maximum likelihood (ML) estimator has also been considered. For the Gaussian prior, its prior mean
¯
X was fixed to an interpolated MS image following the strategy in [5]. The regularization parametersλ for the ML, Gaussian and TV cases were fixed to 10−13
, 0.001 and 0.0001 respectively by manually tuning. For the Gaussian case, the problem (3) was solved analytically. For the TV case, an iterative ADMM update was used and the evolution of the cost function in (3) w.r.t. the iterations has been plotted in Fig. 4, showing that the cost function descended fast in a few steps.
The fused images (including the whole image and three zoomed parts) obtained with different priors (or no prior) are depicted in the 3rd to 5th columns in Figs. 2. Visually, the fused images combined finer spectral information from MS image and spatial information from PAN image. Compared to the two Bayesian results, the ML result (in the3th column) was much noisy because of its sensitivity to noise in the inversion process. The fused images using the Gaussian prior (in the 4th column) and using the TV prior (in the last column) can both depress the noise effectively as well as keep preserving edges and details. This good result using the TV prior can be expected as the TV prior is well known due to its ability to preserve sharp features. The good performance using the Gaussian prior can be attributed to using a high-quality prior mean ¯X which was obtained following the strategy in [5], making the Gaussian prior be different from a simpleℓ2norm regularization. Besides, the
corresponding quantitative results were reported in Table II. The ML and two Bayesian methods gave very similar REs while the fusion using the TV prior gave better SI and S index than using the Gaussian prior. The ML fusion gave the worst results in terms of SI and S index. Regarding to the computational cost, all the algorithms cost less than one minute, which was quite efficient considering that the size of the fused image was2000 × 2000 × 4. Furthermore, the Gaussian and ML cases used much less time, i.e., only seconds, than the TV case due to the existence of an analytical solution and thus avoidance of any iterative operation.
Fig. 2. MS+PAN fusion results. 1st row: MS (column 1), PAN (column 2), ML fusion (column 3), Bayesian fusion using a Gaussian prior (column 4) and a TV prior (column 5) , 2nd-4th rows: zoomed details including containers, trees, houses, roads, stadiums, of the corresponding images in the 1st row.
TABLE II
PERFORMANCE OFMS+PANFUSION METHODS: RE (IN105
), SI (IN
103
), S INDEX(IN103
)ANDTIME(IN SECOND) Prior RE SI SIndex Time
ML 1.15176 18.4 18.7 3.62
Gaussian 1.15180 21.0 21.3 3.63
TV 1.15176 23.4 23.8 53.24
V. CONCLUSION
This paper developed a blind model-based multi-band image fusion method using a recently developed model estimation method in [7] and a Sylvester equation based fusion method in [1]. First, the spatial and spectral responses were reasonably estimated by solving an optimization prob-lem (2). Then, two priors including Gaussian and TV were used to regularize the ill-posed inverse problem associated with the multi-band image fusion. Following the strategy in [1], an analytical solution of (3) was obtained directly for the Gaussian prior and an alternating direction method of multipliers was used to solve (3) for the TV prior. Numerical experiments showed that the Gaussian and TV priors could effectively remove unwanted noise whilst preserving impor-tant details such as edges. Besides, the proposed method can be implemented with low computational cost.
Iteration number 1 2 3 4 5 6 7 8 9 10 Cost function 102 103 104 105
Fig. 4. Cost function using a TV prior vs iterations
ACKNOWLEDGMENTS
The authors would like to thank Deimos Imaging for acquiring and providing the data used in this study, and the IEEE GRSS Image Analysis and Data Fusion Technical Committee. The authors also thank Raquel Chivato from Deimos Imaging for offering the spectral ranges of PAN and
MS images.
REFERENCES
[1] Q. Wei, N. Dobigeon, J.-Y. Tourneret, J. M. Bioucas-Dias, and S. Godsill, “R-FUSE: Robust fast fusion of multi-band images based on solving a Sylvester equation,” submitted. [Online]. Available: http://arxiv.org/abs/1604.01818/
[2] C.-I. Chang, Hyperspectral data exploitation: theory and applications. New York: John Wiley & Sons, 2007.
[3] B. Aiazzi, L. Alparone, S. Baronti, A. Garzelli, and M. Selva, “25 years of pansharpening: a critical review and new developments,” in Signal and Image Processing for Remote Sensing, 2nd ed., C. H. Chen, Ed. Boca Raton, FL: CRC Press, 2011, ch. 28, pp. 533–548. [4] L. Loncan, L. B. Almeida, J. M. Bioucas-Dias, X. Briottet, J.
Chanus-sot, N. Dobigeon, S. Fabre, W. Liao, G. Licciardi, M. Simoes, J.-Y. Tourneret, M. Veganzones, G. Vivone, Q. Wei, and N. Yokoya, “Hyperspectral pansharpening: a review,” IEEE Geosci. Remote Sens. Mag., vol. 3, no. 3, pp. 27–46, Sept. 2015.
[5] Q. Wei, N. Dobigeon, and J.-Y. Tourneret, “Bayesian fusion of multi-band images,” IEEE J. Sel. Topics Signal Process., vol. 9, no. 6, pp. 1117–1127, Sept. 2015.
[6] ——, “Bayesian fusion of multispectral and hyperspectral images using a block coordinate descent method,” in Proc. IEEE GRSS Workshop Hyperspectral Image SIgnal Process.: Evolution in Remote Sens. (WHISPERS), Tokyo, Japan, Jun. 2015.
[7] M. Simoes, J. Bioucas-Dias, L. Almeida, and J. Chanussot, “A convex formulation for hyperspectral image superresolution via subspace-based regularization,” IEEE Trans. Geosci. Remote Sens., vol. 53, no. 6, pp. 3373–3388, Jun. 2015.
[8] Q. Wei, J. Bioucas-Dias, N. Dobigeon, and J. Tourneret, “Hyperspec-tral and multispec“Hyperspec-tral image fusion based on a sparse representation,” IEEE Trans. Geosci. Remote Sens., vol. 53, no. 7, pp. 3658–3668, Jul. 2015.
[9] M. Afonso, J. M. Bioucas-Dias, and M. Figueiredo, “An augmented Lagrangian approach to the constrained optimization formulation of imaging inverse problems.” IEEE Trans. Image Process., vol. 20, no. 3, pp. 681–95, 2011.
[10] Q. Wei, N. Dobigeon, and J.-Y. Tourneret, “Fast fusion of multi-band images based on solving a Sylvester equation,” IEEE Trans. Image Process., vol. 24, no. 11, pp. 4109–4121, Nov. 2015.
[11] N. Zhao, Q. Wei, A. Basarab, N. Dobigeon, D. Kouam´e, and J. Y. Tourneret, “Fast single image super-resolution using a new analytical solution for ℓ2− ℓ2problems,” IEEE Trans. Image Process., vol. 25,
no. 8, pp. 3683–3697, Aug. 2016.
[12] N. Zhao, Q. Wei, A. Basarab, D. Kouam, and J. Y. Tourneret, “Single image super-resolution of medical ultrasound images using a fast algorithm,” in Proc. IEEE Int. Symp. Biomed. Imaging (ISBI), Apr. 2016, pp. 473–476.
[13] “2016 IEEE GRSS Data Fusion Contest,” http://www.grss-ieee.org/ community/technical-committees/data-fusion, 2016.
[14] A. Leclaire and L. Moisan, “No-reference image quality assessment and blind deblurring with sharpness metrics exploiting fourier phase information,” J. Math. Imag. Vision, vol. 52, no. 1, pp. 145–172, 2015.