HAL Id: cea-02339844
https://hal-cea.archives-ouvertes.fr/cea-02339844
Submitted on 5 Nov 2019HAL is a multi-disciplinary open access archive for the deposit and dissemination of sci-entific research documents, whether they are pub-lished or not. The documents may come from teaching and research institutions in France or abroad, or from public or private research centers.
L’archive ouverte pluridisciplinaire HAL, est destinée au dépôt et à la diffusion de documents scientifiques de niveau recherche, publiés ou non, émanant des établissements d’enseignement et de recherche français ou étrangers, des laboratoires publics ou privés.
Interplay between silicate and hydroxide ions during
geopolymerization
J. Aupoil, J.-B. Champenois, J.-B. d’Espinose de Lacaillerie, A. Poulesquen
To cite this version:
J. Aupoil, J.-B. Champenois, J.-B. d’Espinose de Lacaillerie, A. Poulesquen. Interplay between silicate and hydroxide ions during geopolymerization. Cement and Concrete Research, Elsevier, 2019, 115, pp.426-432. �cea-02339844�
1
Interplay between silicate and hydroxide ions during
1geopolymerization
2Julien Aupoil1,2, Jean-Baptiste Champenois1,*, Jean-Baptiste d’Espinose de Lacaillerie2, Arnaud 3
Poulesquen1 4
1CEA, DEN, DE2D, SEAD, LCBC, F-30207 Bagnols-sur-Cèze, France
5
2Laboratoire de Sciences et Ingénierie de la Matière Molle, UMR CNRS 7615, ESPCI Paris, PSL
6
Research University, 10, rue Vauquelin, 75231 Paris Cedex 05, France 7
* Corresponding author
8
Keywords: silicate, hydroxide, Hammet, alkali, metakaolin, dissolution, condensation, 9
10 11
2
Abstract
12
Two set of activating solutions were prepared with increasing sodium hydroxide content, either 13
containing or not silicates. Their alkalinities, here defined as the ability of solutions to resist 14
changes in pH, were determined and compared by measuring Hammet acidity functions that can 15
be assimilated to extended pH values. Such Hammet functions in sodium silicate solutions are 16
reported for the first time. The impact of both the alkalinity and the initial Hammett function on 17
the reactivity of metakaolin (MK)-based pastes was assessed using Isothermal Conduction micro-18
Calorimetry (ICC). It was concluded that the reactivity of MK mixed with sodium hydroxide 19
solution related directly to the Hammett function values whereas in sodium silicate mixes, the 20
alkalinity value was a more pertinent parameter. A mechanism was deduced to clarify the role of 21
hydroxide ions during the geopolymerization, highlighting at the same time the role of silicate 22
species as hydroxide reservoir to nurture the dissolution process. 23
3
1. Introduction
25
Geopolymers refer to silicate binders obtained by reaction of a powdered alumino-26
silicate source, such as dehydroxylated kaolin (metakaolin, MK), with an alkali hydroxide or 27
alkali silicate solution, as described by Davidovits1. Schematically, the geopolymerization 28
process can be described by three simplified steps2-5. First, MK dissolution in the activating 29
solution provides aluminate and silicate species to the reacting medium. These species then 30
rearrange in solution, to finally polycondense, yielding the 3D network of the hardened 31
geopolymer. 32
Carrying out a detailed mechanistic study of these three steps is a hard task. They occur 33
concurrently and furthermore, no realistic reaction equations can be written to describe any of 34
these steps. However, since most of the expected reaction steps are exothermic, the use of 35
Isothermal Conduction Calorimetry (ICC) was previously reported6-11 as being an efficient tool 36
for studying the whole geopolymerization process. Indeed, heat flow and heat profiles recorded 37
during geopolymerization provide qualitative and quantitative information. As an example, the 38
global geopolymerization extent at a given time has been calculated as the ratio of the cumulated 39
heat Q(t) release to the theoretical total heat at completion, Qmax6,9,10. Hence, in alkali hydroxide
40
activating solutions free from silicates, Zhang et al.9 reported an increase of the aforementioned 41
geopolymerization extent with increasing hydroxide ions content. 42
The relationship between activating solution composition and geopolymerization has been the 43
subject of an extensive body of literature. Indeed, such a topic is a key issue for the use of 44
geopolymers and their industrial development. For examples, Rahier et al.12 reported that the 45
activating solution modulus, defined as the SiO2/Na2O molar ratio, and the amount of water,
46
defined as the H2O/Na2O molar ratio, are driving parameters to tune geopolymers stoichiometry
4 and consistency respectively. At a Na/Al molar ratio equal to one, the optimal geopolymer 48
stoichiometry can thus be reached by choosing the appropriate SiO2/Na2O modulus of the
49
activating solution. Later, Duxson et al.13 observed an increase in the proportion of unreacted 50
metakaolin and a decrease in the geopolymers density when increasing the silicate content of 51
activating solutions as a consequence of the resulting simultaneous increase of the SiO2/Al2O3
52
and SiO2/Na2O molar ratios. Such a result was further rationalized by using Density Functional
53
Theory (DFT)-based Coarse-Grain Monte-Carlo simulations14. Similarly, Zhang et al.10 reported 54
that an increase in the activating solution modulus, defined as the SiO2/Na2O molar ratio, leads to
55
a decrease in the geopolymerization extent, evaluated byisothermal calorimetry. 56
The use of 29Si Nuclear Magnetic Resonance (NMR) clearly exhibited that silicates connectivity 57
in activating solutions increases when increasing the modulus of the solutions15-17. Duxson et al.13 58
postulated that the higher the silicates connectivity, the lower the silicates species lability. 59
According to these authors, highly connected silicate species would thus hardly rearrange and 60
densify before gelation, leading to the formation of a gel of lesser density and thiner pore size 61
distribution, around metakaolin grains. 62
63
In most of the aforementioned studies, the activating solutions compositions are described in 64
terms of silicate content, SiO2/Na2O and H2O/Na2O molar ratios. The influence of the free
65
hydroxide ions content on the geopolymerization reaction is thus not explicit. Although it had 66
already been mentioned by Xu and Van Deventer18 and Zhang et al9, to the best of our 67
knowledge, only one scientific paper has been dedicated to that topic. Indeed, by increasing the 68
alkali hydroxide content of activating solutions and using fly ash as an aluminosilicate source, 69
Phair and Van Deventer19 reported that a higher activating solution pH leads to a higher 70
5 polycondensation extent. However, pH reported values seem to be approximate as they are given 71
only in full pH units19. In any case, these three studies9,18,19 clearly highlight the importance of 72
hydroxide ions in the geopolymerization process. 73
An effect of solution pH on aluminosilicates dissolution was indeed evidenced by Xu and Van 74
Deventer18 when studying in diluted suspensions the dissolution of 15 aluminosilicates minerals. 75
They concluded that the extent of dissolution increases for increasing alkali hydroxide solution 76
concentrations. Complementarily, Duxson et al.2 (and references therein) and Granizo et al.20 77
amongst others also pinpointed that the dissolution kinetics of aluminosilicate sources was highly 78
dependent on the initial pH of the solution. 79
However, all the previously mentioned experiments2,18,20 were carried out using solutions free 80
from silicates and using high liquid to solid ratio. As such, the role of silicate species and their 81
interplay with hydroxide ions on the dissolution step during geopolymerization have never been 82
investigated. This literature gap may have resulted from the difficulty to assess by standard pH-83
metry pH values of solutions containing extremely high amounts of alkali metal ions. 84
85
In consequence, the present study firstly aims at quantifying the hydroxide content and the 86
alkalinity of two sets of activating solutions. Two sets of solutions of increasing sodium 87
hydroxide content were considered: the first one with a fixed silicate content and the second one 88
devoid of silicate species. Each time, Hammet acidity functions of studied solutions were 89
measured instead of pH, as described in the theoretical part. The corresponding alkalinity21, 90
defined here as the ability of a solution to resist to changes in pH, was evaluated for the two sets 91
of solutions. Then, the geopolymers reactivity observed by mixing metakaolin into these 92
solutions was evaluated by using Isothermal Conduction Calorimetry (ICC). Finally, these new 93
6 data led us to discuss the role of silicate species and their interplay with hydroxide ions during 94
geopolymerization. 95
7
2. Theoretical basis.
97
In activating solutions used for geopolymers elaboration, molality of alkali metal ions can range 98
between 1 mol / kg of water to 15 mol / kg of water. The use of a glass electrode sensitive to 99
oxonium ions H3O+ to assess pH values is then questionable in such media. First, a high sodium
100
concentration in basic solutions often leads to an alkaline error, since the alkali ion concentration 101
can be typically orders of magnitudes larger than the oxonium ions one. As an example, the alkali 102
ion concentration is 1014 times higher than the oxonium one in a sodium silicate solution 103
containing 10 mol / kg of sodium ions at pH ≈ 13. Then, water activity in the studied solution can 104
be far below the value of 0.9 expected in a 3 mol / kg potassium chloride electrode filling 105
solution. As a consequence, the ionic flow from the electrode to the studied medium could be 106
strongly impacted, leading to false measurements. Finally, in the specific case of silicate-107
containing activating solutions, silicate species can interact or even deteriorate the glass electrode 108
surface, leading to additional errors. 109
Consequently, in this work, the measurement of Hammet acidity functions22-24 was chosen 110
instead of standard pH-metry to quantify the amount of hydroxide ions in activating solutions. 111
Such a function represents the hydroxide ions ability to deprotonate a weak acid, noted SH in 112
reaction equation 1, added in small amounts in the aqueous medium. It is obviously equivalent to 113
pH in dilute systems. Upon introduction in the studied medium, again in small amounts, the 114
weak acid SH plays the role of an acid-base indicator whose ionization ratio is measured 115
quantitatively thanks to the intensity shift of its UV-visible spectrum induced by its deprotonation 116
. This concept was initially introduced to measure acidity of extremely acidic solution and later 117
adapted to basic solutions, either in aqueous alkali hydroxide solutions or in non-aqueous 118
solvents25-30. 119
8 120
H. H H-. H -. H n 1 H (Reaction Equation 1) 121
122
In reaction equation 1, the coefficient n = (x + y - z) accounts for the difference in hydration 123
degrees between reactants and products, according to the model used by Edward29. The 124
corresponding equilibrium constant K is then written as: 125
(Equation 1)
126
with ai the activity of the species i.
127
As reaction equation 1 represents an acid-base reaction between the two couples SH/S- and 128
OH-/H2O, the constant K can also be written as the ratio of the associated ionization constants: Ka
129
for the acid ionization constant of SH and Kw for the one of water (tabulated by Bandura and
130
Lvov31 and taken as 10-14 at 25°C), 131
Hammett23 defined the acidity function H- according to equation 2. Rearranging equation 1 also
132
provides equation 3, another definition of the acidity function: 133 (Equation 2) 134 (Equation 3) 135 With: 136
pKx the cologarithm of constant Kx,
137
the ionization ratio,
138
[i] the concentration of species i in mol / kg of water, 139
and γi its activity coefficient defined such as ai = γi.[i]/[i]° where [i]° is the standard state
140
concentration of species i conventionally set equal to 1 mol / kg. 141
9 The experimental determination of activity coefficients being complex, equation 3 is mainly of 142
theoretical interest, except in the rare cases when good approximations of activity coefficients24,29 143
are possible. Nevertheless, equation 3 clearly states that the function H- takes into account not
144
only the hydroxide ions activity but also their environment through the parameter n and the 145
variables aH2O and γSH/γS-, respectively related to the ions hydration, the free water content and the
146
ionic force of the solution. In consequence, the acidity function is an appropriate tool to represent 147
the ability of hydroxide ions to react in a solution. 148
If both S- and SH forms absorb UV-visible light at different wavelengths, the [S-]/[SH] 149
ionization ratio can be measured by using spectrocolorimetry. From Beer-Lambert’s law, the 150
ionization ratio can be obtained from absorbance measurements for a constant indicator 151
concentration according to (eq. 4). 152 (Equation 4) 153 With 154
ASH the absorbance of a solution where the indicator is fully protonated,
155
AS- the absorbance of a solution where the indicator is fully deprotonated,
156
A the absorbance of any basic solution with intermediate concentration. 157
A set of three solutions is thus needed to determine an ionization ratio. 158
10
3. Experimental section.
160
3.1. Activating solutions elaboration
161
Sodium hydroxide solutions were elaborated with an increasing molality ranging from 3.17 .10-2 162
to 1.40 .101 mol / kg by dissolving sodium hydroxide pellets (AR grade, VWR) in ultrapure water 163
(18.2 MΩ . A set of alkali silicate solutions was then elaborated b diluting in water a 164
commercial alkali silicate solution (Betol® 52T, Wöllner: 30.2% w/w SiO2, 14.7% w/w Na2O and
165
55.1% w/w H2O) and by adding sodium hydroxide pellets in order to reach increasing sodium
166
ions molality, ranging from 5.46 to 1.40 .101 mol/kg. All solutions were stirred for at least 4 h 167
and cooled down to 25°C prior to any use. Solutions compositions are reported in Tables 1 and 2. 168
169
Table 1. Composition in molality, water activity and acidity function values of sodium hydroxide
170
solutions together with the molar ratios of the corresponding geopolymers prepared with 171
metakaolin. Acidity functions were taken from literature when indicated (a Rochester32, 172 b Schwarzenbach25). 173 174 175 176 Na1 3.17 .10-2 1.000 12.51 ± 0.06 3.28 .10-3 733 Na2 1.00 .10-1 1.000 12.99 ± 0.06 1.04 .10-2 232 Na3 3.17 .10-1 - 13.42 ± 0.08 3.28 .10-2 73.2 Na4 1.00 0.987 14.01a 1.04 .10-1 23.2 Na5 2.00 0.956 14.42a 2.07 .10-1 11.6 Na6 3.01 0.917 14.72a 3.11 .10-1 7.73 Na7 5.00 0.812 15.19a 5.18 .10-1 4.64 Na8 7.00 0.692 15.62a 7.25 .10-1 3.32 Na9 9.66 0.520 16.06a 1.00 2.41 Na10 1.20 .101 - 16.47b 1.24 1.94 Na11 1.40 .101 0.275 16.87b 1.45 1.66 [NaOH] (mol/kg) aH2O (± 0.008) H -Geopolymers Na/Al Solutions
11
Table 2. Molality, molar ratio, water activity and acidity function values of sodium silicate
177
solutions. When indicated, the composition of the corresponding geopolymers prepared with 178
metakaolin is also given. 179 180 181 182 3.2. Geopolymers preparation 183
Prior to the cure and any measurements, geopolymer pastes were prepared by mixing 32.05 g of 184
metakaolin (MK, Metakaolin Argical M1000 from Imerys, characteristics in Table 3) with the 185
appropriate weight of activating solution to obtain a constant (initial water)/MK weight ratio of 186
0.78. Elaborated geopolymers formulations are reported in Tables 1 and 2. 187
188
Table 3. Physical and chemical characterization of Metakaolin by XRF, laser granulometry and
189
N2 adsorption-desorption (with BET method) as provided by the supplier.
190 191 NaS1 0 5.46 5.79 2.12 0.965 - 0.57 6.36 NaS2 5.26 .10-1 6.01 5.80 1.93 0.952 10.82 ± 1.98 0.62 5.79 NaS3 1.54 7.01 5.80 1.65 0.928 11.64 ± 0.35 0.73 4.97 NaS4 2.54 8.02 5.79 1.45 0.903 12.19 ± 0.14 0.83 4.34 NaS5 3.53 9.00 5.80 1.29 - 12.52 ± 0.10 - -NaS6 4.20 9.68 5.80 1.20 0.837 12.74 ± 0.10 1.00 3.60 NaS7 5.02 10.5 5.80 1.10 - 13.10 ± 0.11 - -NaS8 5.52 11.0 5.80 1.05 0.767 13.25 ± 0.12 1.14 3.16 NaS9 6.54 12.0 5.80 9.66 .10-1 0.711 13.59 ± 0.20 1.24 2.68 NaS10 7.54 13.0 5.79 8.91 .10-1 0.649 14.12 ± 0.53 1.34 2.32 NaS11 8.54 14.0 5.80 8.27 .10-1 - - - -Geopolymers Solutions [NaOH]added (mol/kg) [Na]total (mol/kg) [Si] (mol/kg) H -aH2O (± 0.008) Na/Al
Oxides SiO2 Al2O3 CaO Fe2O3 TiO2 K2O
Composition %w/w 54.40 38.40 0.10 1.27 1.60 0.62 Granulometry (µm) d10 1.8 d50 10.3 d90 48.2
12 192
3.3. Acidity function measurements
193
Thiazole Yellow G (TYG, also known as Titan Yellow, Sigma-Aldrich) was used in the present 194
study as the weak acid UV-visible-sensitive indicator, chosen to be compatible with the expected 195
acidity function range of the studied solutions. Absorptions of activating solutions containing 196
TYG were measured in the spectral range 300 to 600 nm, with a resolution of 1 nm, in 10-mm 197
quartz cells at 25°C. Absorbance spectra were recorded on a dual-beam spectrophotometer 198
(Genesys 10S UV-Visible, ThermoFischer Scientific), with a xenon flash lamp. Indicator-free 199
activating solutions were used as backgrounds so that only the indicator would contribute to the 200
recorded spectra. For the whole set of solutions, absorbance of indicator-free solutions was 201
checked to be close to zero for wavelength ranging from 400 to 500 nm. 202
The absorbance at 480 nm has been checked to be proportional to TYG concentration up to 203
approximately 5.10-4 mol / kg in sodium hydroxide solution, defining the range of validity of the 204
Beer-Lambert law (details are available in supplementary information). Accordingly, the working 205
concentration of TYG in all activating solutions was set to 5.10-5 mol / kg. In sodium hydroxide 206
solutions, absorption bands centered at 405 and 475 nm have been observed respectively for the 207
SH form and S- form, with an isobestic point at 433 nm. In sodium silicate solution with 208
increasing amounts of sodium hydroxide, absorption bands were centered at 390 and 480 nm, 209
with an isobestic point at 438 nm. Previous observations from Allain and Xue33 in sodium 210
hydroxide solutions support the existence of a simple acid-base equilibrium for TYG as described 211
in Reaction Equation 1. Allain and Xue also reported that TYG has a good chemical resistance to 212
hydroxide ions, and a large dynamic spectral range. In addition, the similar position of the S -213
form absorption band in both media corroborates the absence of any drastic conformation 214
13 modification, at least for the deprotonated form. This meant that silicates did not interact to any 215
significant level with the indicator and that the latter was only involved in a simple acid-base 216
equilibrium. Acidity functions were thus calculated from absorbance at 480 nm. 217
The pKa of TYG has been measured in sodium hydroxide solution following Safavi and
218
Abdollahi’s procedure34. The pKa value of 12.92 ± 0.01 at 25°C measured in this work is
219
consistent with the 12.92 value reported by Safavi and Abdollahi. TYG was thus considered as a 220
suitable weak acid indicator for acidity function measurements in study alkali silicate activating 221
solutions. 222
Finally, the working range of TYG was established (see Sup. Inf.) to be comprised between 11.9 223
and 13.9, corresponding to an H- range equal to approximately pKa ± 1, which is consistent with
224
the dynamic spectral range found by Safavi and Abdollahi34 and Allain and Xue33. 225
226
3.4. Water activity measurements
227
Water activity was measured in all considered activating solutions in presence of 5.10-5 mol/L of 228
TYG. Measurements were done at 25 ± 2°C with a Hygropalm HP23-AW-A analyzer equipped 229
with a HC2-AW water activity probe (Rotronic) and calibrated in temperature and humidity with 230
Rotronic certified humidity standards at 50% RH and 80% RH. After an equilibration time of 231
5 min, water activity was measured with a precision of ± 0.008. Water activity measurement 232
relies on Equilibrium Relative Humidity measurement (ERH, in %), when the atmosphere in the 233
sample holder is at equilibrium with the solution (aH2O = ERH/100).
234 235
3.5. 29Si Nuclear Magnetic Resonance.
14
29Si NMR measurements were performed on silicate activating solutions to investigate the silicate
237
connectivity. Spectra were recorded at a Larmor frequency of 99.36 MHz (at 25 ± 2°C) in 238
zirconia rotors using a Bruker Avance spectrometer and a 7-mm commercial Bruker MAS probe 239
but without spinning. 1600 transients were acquired using a single 90° pulse of 6.4 µs and a 240
recycle time of 10 s. The recycle time was verified to be long enough by increasing it ten folds 241
and confirming that intensities did not vary. Spectra were referenced externally to 242
tetramethylsilane (TMS). The proportions of the different types of silicon centers were obtained 243
by the integrated intensities of their resonances using the software Dmfit developed by D. 244
Massiot et al.35. The different silicon centers were designated according to Engelhardt’s 245
nomenclature15. Each center is designated as Q since silicon atoms are quadri-coordinated to 246
oxygen. A superscript Qn 0 ≤ n ≤ 4 indicates the number of silo o bonds i-O-Si), without 247
considering the protonation degree of non-bridging oxygens. For example Q0 designates a single 248
silicate, Q1 a silicate with one neighbor silicate (end-chain or in a dimer) and so on. When 249
present, subscript c indicates that silicates are part of a three-membered ring. These Q2 250
resonances are detected at slightly different frequencies compared to the ones of Q2 groups in 251
chains or larger rings due to their more constraint geometry. 252
253
3.6. Isothermal Conduction Calorimetry
254
Approximately 5 g of each elaborated geopolymer has been then introduced in a sealed ampoule 255
to assess its reactivity by using Isothermal Conduction Calorimetry at 25°C on a TAM Air 256
microcalorimeter. Water was used as the reference, to compensate for possible external 257
temperature disturbances. Due to the external mixing procedure, a parasitic heat flow signal 258
associated to the introduction of sample interfered with the initial reaction signal. The 259
15 equilibration time of this interference amounted to about 1.5 h, measured on an inert sample 260
(available in supplementary information). Normalized heat flow release during 261
geopolymerization, expressed in mW/g of paste, was recorded as a function of time during 90 h. 262
Cumulative heat releases were obtained by integrating heat flow profiles after the end of the 263
introduction peak here defined as when the heat flow drops to a value of 8 mW / g to minimize 264
the contribution of the introduction peak. 265
266 267
16
4. Results
268
4.1. Acidity function H- and alkalinity evaluation.
269
Acidity function values of were measured for the first time in sodium silicate solutions and 270
compared to the ones of pure sodium hydroxide solutions. Results are plotted as a function of 271
added sodium hydroxide molality in Figure 1. 272
273
Figure 1. Comparison of H- acidity function scales of pure sodium hydroxide () or sodium
274
silicate solutions () (with [Si] = 5.8 mol / kg) as a function of added sodium hydroxide 275
molality. Literature data from Edward29 (), Bowden30 () and Rochester32 () were used for 276
highly concentrated sodium hydroxide solutions. The dash line represents calculated theoretical 277
pH which is equivalent to H- in dilute solutions (< 1 mol / kg).
278 279
In a sodium hydroxide solution free from silicate, an addition of approximately 0.97 mol / kg 280
sodium hydroxide is needed to raise the H- value from 12.00 to 14.01 (value from Bowden30).
281
Within this concentration range and in the specific case of pure sodium hydroxide solutions, H- is
282
fairly equivalent to theoretical pH calculated by pKw + log [OH-] (with a mean deviation of 0.03)
283
and our measured values were consistent with previously reported data29. Above 1 mol / kg, H
17 values are out of the working range of TYG, and cannot be measured with this indicator. For 285
sodium hydroxide addition higher than 1 mol / kg, the deviation of the H- function from the
286
linearity is illustrated by plotting data from the literature29,30,32. Such a deviation is mainly due to 287
a sharp decrease in water activity as mentioned by Edward29, which was measured for reference 288
and reported in Tables 1 and 2. 289
In a silicate-containing solution, an addition of approximately 4.0 mol / kg sodium hydroxide was 290
needed to raise the H- value from 12.19 to 13.59. For higher sodium hydroxide additions, the
291
resulting H- function values were higher than the 13.9 threshold value of TYG working range.
292
This set of data remarkably highlights the alkalinity difference between sodium hydroxide and 293
sodium silicate solutions. Alkalinity is here defined as the ability of a solution to resist changes in 294
pH in a given pH range. Using this working definition, the alkalinity of both sets of studied 295
solutions was calculated as the amount of hydroxide ions that has to be added to the solution to 296
raise the H- value by one unit, within a H- range from 12 to 14. For H- values ranging from 12 to
297
14, the alkalinity values were found to be 0.48 mole added hydroxide per H- unit for a
silicate-298
free solution and 2.86 for a solution containing 5.80 mol/kg of silicate,. Within the same acidity 299
function range, the alkalinity of the silicate-containing solution is thus more than 5 times higher 300
than the one of the silicate-free solution. 301
302
4.2. Silicate connectivity
303
Liquid state 29Si NMR spectra of some sodium silicate solutions investigated herein are reported 304
on Figure 2. Several types of silicate species were present. The most deshielded are Q0 silicates (δ 305
= -71.45 ppm in NaS1) and then Q1 (δ = -79.45 ppm in NaS1), Q2c (δ = -81.36 ppm in NaS1) Q2
306
(δ = -87.47 ppm in NaS1), Q3c (δ = -89.55 ppm in NaS1), Q3 (i = -95.52 ppm in NaS1). A Q4 (δ =
18 -105.4 ppm) resonance was only observed in NaS1. For indication, the 29Si resonances are known 308
to shift to higher frequencies (higher deshielding) when increasing the alkali hydroxide content. 309
This well-known fact is due both to the deprotonation of silanol groups (Si-OH) and to the 310
formation of ion pairs (Si-O-+Na) according to Kinrade and Swaddle17. As expected, when the 311
alkali hydroxide content is increased, the peak intensities decreased for highly connected silicates 312
and increases for poorly connected silicates, reflecting the general decondensation of silica 313
oligomers with pH. Poorly resolved Q2 and Q3c contributions were decomposed by fitting spectra
314
with gausso-lorentzian lineshapes using the freeware Dmfit35. The average connectivity of Si 315
centers was calculated from the spectral decomposition of 29Si NMR measurements: 316
with Qn the proportion of each silicate population (%). 317
19 319
Figure 2. Liquid state 29Si NMR spectra of some sodium silicate solutions investigated herein 320
with varying sodium hydroxide contents. Peaks are named after Engelhardt notation15. 321
322
On Figure 3, the average silicate connectivity is plotted as a function of acidity function values in 323
silicate solutions. In the working range of TYG (dash lines), the average connectivity decreases 324
for increasing H- values. For sodium hydroxide additions from 2.54 to 6.54 mol/kg and
325
corresponding H- values ranging from 12.19 to 13.59 respectively, the silicate connectivity is
326
divided by almost 2. It demonstrates the decondensation of silicates species when sodium 327
hydroxide is added to solutions, as already reported by many authors.15-17 Decondensation 328
consists in the hydrolysis of siloxo bonds Si-O-Si. Such an effect, highlighted by Svensson et 329
20 al.16, can be seen as the transfer of hydroxide ions from the solution onto silicates in the form of 330
Si-OH groups. This leads to the consumption of initially added hydroxide ions, as illustrated by 331 Reaction Equation 2: 332 i- - i a H- i- H - - i (Reaction Equation 2) 333 334
Figure 3. Evolution of the average connectivity of silicate oligomers in sodium silicate activating
335
solutions as a function of their acidity function H- along the working range of the indicator TYG.
336
Consequently, it was apparent that the low H- values in silicate solutions (<14) despite their high
337
sodium hydroxide contents, up to 7.5 mol/kg, were due to the presence of silicate species in 338
solutions and to the associated reaction described above. The presence of silicate was thus 339
responsible for the alkalinity measured in silicate-containing solutions. 340
341
4.3. Isothermal Conduction Calorimetry measurements
342
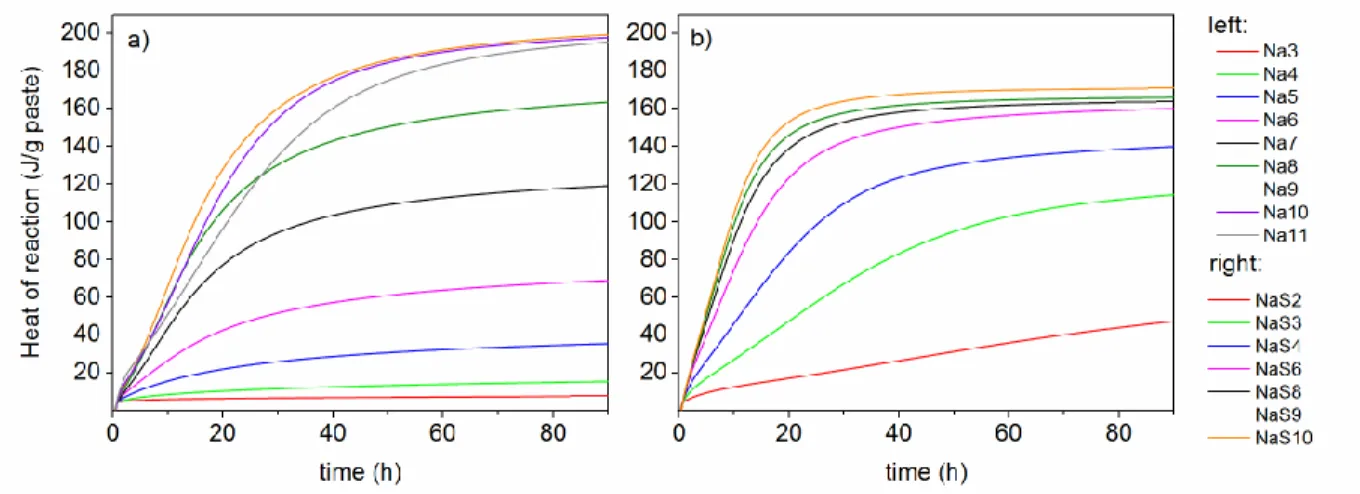
Metakaolin-based pastes were then prepared with the solutions under investigation. For all the 343
studied compositions, cumulative heat profiles could be described as a succession of two stages 6-344
11 (Figure 4). The sharp heat release at the early beginning of the reaction can be ascribed mainly
345
to the metakaolin dissolution. But this contribution often overlapped second stage of the 346
21 geopolymerization, namely the alumino-silicate polycondensation. After a variable duration, the 347
heat release stabilized as the reaction slowed down. The heat value at the plateau (Figure 4 and 5) 348
could then be assumed to be approximately proportional to the extent of geopolymerization.6,9,10 349
350
Figure 4. Total heat release of geopolymer pastes prepared from a) sodium hydroxide solutions
351
and b) sodium silicate solutions, with varying NaOH content, measured by ICC. 352
22
5. Discussion
354
The final heat value was plotted as a function of total sodium ions content. In the same figure, the 355
initial H- values of the activating solutions were plotted on the right axis (Figure 5).
356
357
.
358
Figure 5. Comparison of the final heat released at 90 h of MK-based geopolymers measured by
359
Isothermal Conduction Calorimetry () with the initial H- function () in either pure sodium
360
hydroxide solutions (solid symbols) or sodium silicate solutions (empty symbols) as a function of 361
total sodium molality. 362
For both sets of experiments, i. e. with or without silicate in the activating solution, increasing the 363
total sodium ions molality by adding sodium hydroxide up to 9.66 mol / kg led to an increase in 364
the heat of geopolymerization. Above this 9.66 mol / kg value, the heat released during 365
geopolymerization remained constant. It has to be noted that this molality value corresponded to 366
a Na/Al ratio equal to 1, described in literature36 as the optimal geopolymer stoichiometry due to 367
the charge balance between Na+ ions and AlO4- units. At this point, the initial H- values of
368
activating solutions amount to 12.7 and 16.1 respectively in silicate-containing and silicate-free 369
activating solution. At this 9.66 mol / kg sodium molality, (Na/Al = 1), the H- value in the
23 silicate-containing solution was thus more than 3 units lower than in the silicate-free one. Despite 371
this huge difference, and for the same total sodium ions concentration, geopolymerization extents 372
were rather close in both systems. 373
374
While, it was predictable that the composition of the reactants with respects of the stoichiometry 375
of the final geopolymer product (Na/Al = 1) piloted the possibility or not to reach completion, 376
and that this explains the dependence on the sodium content of the activating solution, it 377
remained surprising at first glance that the silicate containing activating solutions, despite their 378
much lower initial H- values, led to large geopolymerization extent. Indeed, Xu and Van
379
Deventer18 have demonstrated among others that increasing the pH value of the dissolution media 380
enhances alumino-silicate minerals dissolution and one might expect consequently a much lower 381
extent of reaction for metakaolin in silicate solutions than in pure NaOH ones. The benefits in 382
adding silicate species in activating solutions to enhance the geopolymerization process have 383
been previously mainly attributed to their role on condensation reactions, since silicate species 384
are available from the beginning of geopolymerization according to Duxson et al.13. Moreover, 385
Phair and Van Deventer19 have shown that increasing the alkali content leads to less condensed 386
and more labile silicate species. A more porous and less dense geopolymer would thus be yielded 387
at lower modulus SiO2/Na2O13,19.
388
However, the data presented here suggest another important role for the silicate species. When 389
using a silicate-free solution as the activating solution, hydroxide ions are consumed by 390
metakaolin dissolution, as described by Reaction Equation 3 as already reported by Xu and Van 391
Deventer18. Due to the low alkalinity of sodium hydroxide solutions, meaning, as defined in the 392
24 introduction, that they do not oppose pH changes, the pH necessarily drops during reaction and, 393
to insure that all metakaolin is dissolved, a high initial H- value was necessary.
394 395
i- - i Al metakaolin H- i- H metakaolin -- i Al a (Reaction Equation 3) 396
397
At the opposite, when a silicate-containing solution was used to activate metakaolin and for a 398
same Na/Al ratio (typically 1), the H- initial values were lower but a similar level of
399
geopolymerization was reached. Obviously, the lower acidity function H- values were
400
compensated by the strong alkalinity resulting from the presence of silicate species. While 401
hydroxide ions are also consumed by the metakaolin dissolution which releases aluminate and 402
silicate species in solution, following Equation 3, the hydroxide are removed from solution but 403
the concomitant release of silicate and aluminate species in solution favors condensation of pre-404
existing alumino-silicate species, thus releasing further hydroxide ions or water molecules in 405
solution (Reaction Equations 4 and 5). Those freshly released hydroxide ions are then available to 406
react in turn at the metakaolin surface, releasing more and more silicate and aluminate species 407
which can feed the condensation. As a result, a chain reaction can be established thanks to this 408
circular mechanism that nurtures the dissolution process. This phenomenon is enhanced in 409
silicate-containing solutions due to their alkalinity. In other terms, the initial silicate in solution 410
act as a reservoir of hydroxide compensating the effect of the H- values which are initially lower
411
than in silicate-free solutions but remain probabbly somewhat constant during the dissolution. 412
i- H a -- i Al a i- - i Al a H- (Reaction Equation 4) 413
i- H a H - i Al a i- - i Al a H (Reaction Equation 5) 414
25 It is understood, as shown in Reaction Equation 5, that condensation can also possibly release 415
water molecules. Nevertheless, it has been shown that Si(OH)2O22- and Si(OH)3O- are the
416
predominant forms of silicate monomers in activating solutions for geopolymers with respective 417
pKa’s of 12.6 and 15.737. Besides, silicates pKa’s decrease with their connectivity37. In
418
consequence, the level of silicate deprotonation should thus be significant in the present 419
activating solutions. The release of hydroxide ions rather than water molecules would thus be 420
favored. 421
5. Conclusion
422Comparing initial H- values at identical Na content in sodium hydroxide and sodium silicate
423
allowed assessing for the first time the role of activating solution alkalinity in the 424
geopolymerization process, where the alkalinity is defined as the ability of activating solutions to 425
resist to H- changes. As a consequence, the role of silicate species in the geopolymerization
426
process is indirectly highlighted, since the presence of silicate species is responsible for 427
activating solutions alkalinity. 428
The basicity of geopolymer activating solutions was investigated by UV-Visible spectroscopy 429
using Thiazole Yellow G as a weakly acidic indicator to calculate their Hammett acidity function 430
H-. Sodium silicate and sodium hydroxide solutions alkalinity has thus been measured by using
431
this methodology. The present results on sodium hydroxide solutions were consistent with 432
previous results from Safavi34, validating the implemented methodology. For the first time to our 433
knowledge, this technique was applied to alkali silicate solutions. Quantitative data on the 434
basicity of geopolymer activating solutions were obtained, without using pH-metry. Thiazole 435
Yellow G was an appropriate indicator to measure H- functions comprised in the range 11.9 -
436
13.9, which is ideally suitable for concentrated alkali silicate activating solutions. 437
26 The variation of acidity function was found low in silicate-based solutions when compared to 438
silicate-free solutions, for similar sodium hydroxide additions. This alkalinity difference, defined 439
as the ability of studied solutions to resist changes in pH, is due to the condensation and 440
decondensation of silicate species in the medium, as evidenced by using liquid state 29Si NMR. 441
442
The reactivity of metakaolin-based geopolymers elaborated with previously investigated 443
activating solutions was studied by using Isothermal Conduction Calorimetry. Taking into 444
account initial H- values and corresponding alkalinity of activating solutions allow to precise the
445
respective role of hydroxide ions and silicate species in the geopolymerization process. After 446
metakaolin dissolution initiation b h dro ide ions the “h dro ide reservoir” on silicates can 447
gradually release hydroxide ions into the solution during the subsequent condensation of 448
alumino-silicate species. Those freshly released hydroxide ions would then be able to dissolve at 449
their turn additional amounts of metakaolin. This would generate a chain reaction and a self-450
sustained circular mechanism. This high alkalinity explain why silicate solutions of low initial H
-451
values lead to a similar extent of geopolymerisation compared to a silicate-free solution 452
presenting drastically higher H- values. The fact that silicate solutions allow the reaction to take
453
place at lower hydroxide concentrations is probably crucial in directing the reaction path towards 454
geopolymers rather than zeolites. 455
Experimental work has to be enriched to further validate this proposition, especially by 456
measuring acidity functions during the course of geopolymerization. It must be understood 457
however that only discontinuous measurements would be possible with this technique, after 458
extracting the solution from the geopolymer paste at different times, since translucent media are 459
required for absorption based methods. 460
27 461
6. Conflicts of interest
462463
There are no conflicts to declare 464
28
7. Reference section
465
(1) Davidovits, J. GEOPOLYMERS - Inorganic polymeric new materials. J. Therm. Anal. 1991, 37 (8),
1633-466
1656.
467
(2) Duxson, P.; Fernandez-Jimenez, A.; Provis, J. L.; Lukey, G. C.; Palomo, A.; van Deventer, J. S. J.
468
Geopolymer technology: the current state of the art. J. Mater. Sci. 2007, 42 (9), 2917-2933.
469
(3) Provis, J. L.; Duxson, P.; van Deventer, J. S. J.; Lukey, G. C. The role of mathematical modelling and gel
470
chemistry in advancing geopolymer technology. Chem. Eng. Res. Des. 2005, 83 (A7), 853-860.
471
(4) Fernandez-Jimenez, A.; Palomo, A.; Criado, M. Microstructure development of alkali-activated fly ash
472
cement: a descriptive model. Cem. Concr. Res. 2005, 35 (6), 1204-1209.
473
(5) Khale, D.; Chaudhary, R. Mechanism of geopolymerization and factors influencing its development: a
474
review. J. Mater. Sci. 2007, 42 (3), 729-746.
475
(6) Buchwald, A.; Tatarin, R.; Stephan, D. Reaction progress of alkaline-activated metakaolin-ground
476
granulated blast furnace slag blends. J. Mater. Sci. 2009, 44 (20), 5609-5617.
477
(7) Granizo, M. L.; Blanco, M. T. Alkaline activation of metakaolin - An isothermal conduction calorimetry
478
study. J. Therm. Anal. Calorim. 1998, 52 (3), 957-965.
479
(8) Yao, X.; Zhang, Z. H.; Zhu, H. J.; Chen, Y. Geopolymerization process of alkali-metakaolinite
480
characterized by isothermal calorimetry. Thermochim. Acta 2009, 493 (1-2), 49-54.
481
(9) Zhang, Z. H.; Wang, H.; Provis, J. L.; Bullen, F.; Reid, A.; Zhu, Y. C. Quantitative kinetic and structural
482
analysis of geopolymers. Part 1. The activation of metakaolin with sodium hydroxide. Thermochim. Acta
483
2012, 539, 23-33.
484
(10) Zhang, Z. H.; Provis, J. L.; Wang, H.; Bullen, F.; Reid, A. Quantitative kinetic and structural analysis of
485
geopolymers. Part 2. Thermodynamics of sodium silicate activation of metakaolin. Thermochim. Acta
486
2013, 565, 163-171.
487
(11) Sun, Z. Q.; Vollpracht, A. Isothermal calorimetry and in-situ XRD study of the NaOH activated fly ash,
488
metakaolin and slag. Cem. Concr. Res. 2018, 103, 110-122.
489
(12) Rahier, H.; Simons, W.; VanMele, B.; Biesemans, M. Low-temperature synthesized aluminosilicate
490
glasses .3. Influence of the composition of the silicate solution on production, structure and properties. J.
491
Mater. Sci. 1997, 32 (9), 2237-2247. 492
(13) Duxson, P.; Provis, J. L.; Lukey, G. C.; Mallicoat, S. W.; Kriven, W. M.; van Deventer, J. S. J.
493
Understanding the relationship between geopolymer composition, microstructure and mechanical
494
properties. Colloid Surf. A-Physicochem. Eng. Asp. 2005, 269 (1-3), 47-58.
495
(14) White, C. E.; Provis, J. L.; Proffen, T.; van Deventer, J. S. J. Molecular mechanisms responsible for the
496
structural changes occurring during geopolymerization: Multiscale simulation. Aiche J. 2012, 58 (7),
497
2241-2253.
498
(15) Engelhardt, G.; Zeigan, D.; Jancke, H.; Hoebbel, D.; Wieker, W. 29Si NMR-Spectroscopy of Silicate
499
Solutions .II. Dependence of Structure of Silicate Anions in Water Solutions from Na:Si Ratio. Z. Anorg.
500
Allg. Chem. 1975, 418 (1), 17-28. 501
(16) Svensson, I. L.; Sjoberg, S.; Ohman, L. O. Polysilicate Equilibria in Concentrated Sodium Silicate
502
Solutions. J. Chem. Soc., Faraday Trans. 1 1986, 82, 3635-3646.
503
(17) Kinrade, S. D.; Swaddle, T. W. Silicon-29 NMR Studies of Aqueous Silicate Solutions .1. Chemical
504
Shifts and Equilibria. Inorg. Chem. 1988, 27 (23), 4253-4259.
505
(18) Xu, H.; Van Deventer, J. S. J. The geopolymerisation of alumino-silicate minerals. Int. J. Miner.
506
Process. 2000, 59 (3), 247-266. 507
(19) Phair, J. W.; Van Deventer, J. S. J. Effect of the silicate activator pH on the microstructural
508
characteristics of waste-based geopolymers. Int. J. Miner. Process. 2002, 66 (1-4), 121-143.
29
(20) Granizo, N.; Palomo, A.; Fernandez-Jimenez, A. Effect of temperature and alkaline concentration on
510
metakaolin leaching kinetics. Ceram. Int. 2014, 40 (7), 8975-8985.
511
(21) Drever, J. I. The Geochemistry of Natural Water. Pearson Education Canada: 1988.
512
(22) Flexser, L. A.; Hammett, L. P.; Dingwall, A. The Determination of Ionization by Ultraviolet
513
Spectrophotometry: Its Validity and its Application to the Measurement of the Strength of Very Weak
514
Bases. J. Am. Chem. Soc. 1935, 57 (11), 2103-2115.
515
(23) Hammett, L. P.; Deyrup, A. J. A SERIES OF SIMPLE BASIC INDICATORS. I. THE ACIDITY FUNCTIONS OF
516
MIXTURES OF SULFURIC AND PERCHLORIC ACIDS WITH WATER. J. Am. Chem. Soc. 1932, 54 (7),
2721-517
2739.
518
(24) Hammett, L. P. THE THEORY OF ACIDITY. J. Am. Chem. Soc. 1928, 50 (10), 2666-2673.
519
(25) Schwarzenbach, G.; Sulzberger, R. Über die Alkalinität starker Lösungen der Alkalihydroxyde. Helv.
520
Chim. Acta 1944, 27 (1), 348-362. 521
(26) Paul, M. A.; Long, F. A. H0 AND RELATED INDICATOR ACIDITY FUNCTIONS. Chem. Rev. 1957, 57 (1),
522
1-45.
523
(27) Stewart, R.; Odonnell, J. P. STRONGLY BASIC SYSTEMS .III. H- FUNCTION FOR VARIOUS SOLVENT
524
SYSTEMS. Can. J. Chem.-Rev. Can. Chim. 1964, 42 (7), 1681-1693.
525
(28) Rochester, C. H. Correlation of Acidity Functions with Equilibria of p-Nitroaniline in Aqueous Sodium
526
Hydroxide Solution. Trans. Faraday Soc. 1963, 59 (492), 2820-2825.
527
(29) Edward, J. T.; Wang, I. C. IONIZATION OF ORGANIC COMPOUNDS .II. THIOACETAMIDE IN AQUEOUS
528
SODIUM HYDROXIDE. THE H- ACIDITY FUNCTION. Can. J. Chem.-Rev. Can. Chim. 1962, 40 (3), 399-407.
529
(30) Bowden, K. ACIDITY FUNCTIONS FOR STRONGLY BASIC SOLUTIONS. Chem. Rev. 1966, 66 (2),
119-530
131.
531
(31) Bandura, A. V.; Lvov, S. N. The ionization constant of water over wide ranges of temperature and
532
density. J. Phys. Chem. Ref. Data 2006, 35 (1), 15-30.
533
(32) Rochester, C. H. Correlation of Reaction Rates with Acidity Functions in Strongly Basic Media .Part 2.
534
Reaction of 2,4-Dinitroaniline With Aqueous Sodium Hydroxide. Trans. Faraday Soc. 1963, 59 (492),
535
2826-2837.
536
(33) Allain, L. R.; Xue, Z. L. Optical sensors for the determination of concentrated hydroxide. Anal. Chem.
537
2000, 72 (5), 1078-1083.
538
(34) Safavi, A.; Abdollahi, H. Optical sensor for high pH values. Anal. Chim. Acta 1998, 367 (1-3), 167-173.
539
(35) Massiot, D.; Fayon, F.; Capron, M.; King, I.; Calvé, S. L.; Alonso, B.; Durand, J. O.; Bujoli, B.; Gan, Z.;
540
Hoatson, G. Modelling one‐ and two‐dimensional solid‐state NMR spectra. Magn. Reson. Chem. 2002, 40
541
(1), 70-76.
542
(36) Rahier, H.; VanMele, B.; Biesemans, M.; Wastiels, J.; Wu, X. Low-temperature synthesized
543
aluminosilicate glasses .1. Low-temperature reaction stoichiometry and structure of a model compound.
544
J. Mater. Sci. 1996, 31 (1), 71-79. 545
(37) Sefcik, J.; McCormick, A. V. Thermochemistry of aqueous silicate solution precursors to ceramics.
546
Aiche J. 1997, 43 (11), 2773-2784. 547