HAL Id: cea-02893732
https://hal-cea.archives-ouvertes.fr/cea-02893732
Submitted on 8 Jul 2020Microfluidic Devices
Tobias Lange, Sophie Charton, Thomas Bizien, Fabienne Testard, Florent
Malloggi
To cite this version:
Tobias Lange, Sophie Charton, Thomas Bizien, Fabienne Testard, Florent Malloggi. OSTE+ for in-situ SAXS Analysis with Droplet Microfluidic Devices. Lab on a Chip, Royal Society of Chemistry, 2020, 20, pp.2990-3000. �10.1039/D0LC00454E�. �cea-02893732�
OSTE+ for in-situ SAXS Analysis with Droplet Microfluidic
Devices
Tobias Lange,
a,bSophie Charton,
bThomas Bizien,
cFabienne Testard
aand Florent Malloggi
a,∗aUniversité Paris-Saclay, CEA, CNRS, NIMBE, CEA Saclay, 91191 Gif-sur-Yvette Cedex, France. b CEA, DES, ISEC, DMRC, Univ. Montpellier, Marcoule, France.
c Synchrotron SOLEIL, l’Orme des Merisiers, Saint-Aubin - BP 48, 91192 Gif-sur-Yvette Cedex, France.
July 7, 2020
Abstract
In recent years, microfluidic-based sample preparation techniques have emerged as a pow-erful tool for measurements at large scale X-ray facilities. Most often the microfluidic device was a form of hybrid system, i.e. an assembly of different materials, because a simple, ver-satile and inexpensive microfabrication method, on the one hand, and X-ray compatibility, on the other hand, cannot generally be achieved by the same material. The arrival of a new polymer family based on Off-Stoichiometric Thiol-Ene-epoxy (OSTE+) has recently redis-tributed the cards. In this context, we studied the relevance and the compatibility of OSTE+ for small-angle X-ray scattering (SAXS) studies. The material was characterized regarding its X-ray properties (transmission coefficient, attenuation coefficient, scattering pattern and polymer aging under X-ray light) and their comparison with those of the usual polymers used in microfluidics and/or for synchrotron radiation experiments. We show that OSTE+ has a better SAXS signal than polyimide, the polymer of reference in the SAXS community. Then a detailed protocol to manufacture a suitably thin full OSTE+ chip (total thickness <500 µm) is described and the potency of full OSTE+ devices for in-situ SAXS studies is highlighted in two case-studies: the characterization of gold nanoparticles and the precipitation of cerium oxalate particles, both in moving droplets. Additionally, a method to analyze the scattering signals from droplet and carrier phase in a segmented flow is proposed.
The combination of X-rays and microfluidic devices has been largely developed in the last years to
probe the dynamics and transformation of reactive solutions in-situ.[1,2] It is an appealing way to
study the structure, organization and dynamics of matter in different systems (biology, chemistry,
materials, etc.).[3] The success of this approach is enhanced by the development of focused and
brilliant beams at synchrotron facilities, which are adaptable to the microfluidic channel size.[3]
Since the first combination of in-situ small angle X-ray scattering (SAXS) and microfluidics
in a hydrodynamic focusing device to study proteins folding[4,5], various microfluidic setups have
been developed to probe dynamics in reactive systems.[2] Among the different possibilities, the
segmented flow of two immiscible phases is particularly attractive to confine and control the reactive
system.[6,7] The confinement in droplets prevents reactant dispersion along the channel axis and
possible adsorption of reactive species to the channel wall. Such segmented flow microfluidic
devices were first combined with X-ray diffraction for protein crystallography.[8] The droplets were
generated in the microfluidic device, transferred into a capillary and then analyzed under static
conditions. Stehle et al.[9] were the first to combine SAXS with flowing droplets. They studied
gold nanoparticles under formation with a polydimethylsiloxane (PDMS) device connected to a glass capillary. The signal was integrated over the whole fluid volume, i.e. droplets and carrier phase. To overcome this limitation, Pham et al. synchronized the acquisition to the passing
droplets to study the impact of NaCl concentration on lysozyme in solution.[10,11] The microfluidic
droplet generation device was made from thiol-ene (TE) polymer (Norland Optical Adhesive, NOA 81) coupled to a quartz capillary. The same year, Saldanha et al. studied the transformation of rod-shaped vimentin into filaments upon salt addition, using a PDMS microfluidic device connected
to a quartz capillary.[12]By using short acquisition times and a microbeam, they were able to collect
separated scattering patterns for the oil phase, the water droplets, and for the oil-water interface. Levenstein et al. used the same approach to isolate the droplet signal by X-ray diffraction directly on a microfluidic chip made of a polytetrafluoroethylene sheet sandwiched between two layers of
polyimide.[13] They were able to measure the induction time of CaCO
3 crystallization in presence
of different nucleants.
In most of these examples, the SAXS acquisition is performed on a glass or quartz capillary
connected to the microfluidic devices. Levenstein et al.[13] were the only ones who acquired the
microfluidic devices and can be used for SAXS studies, it exhibits high X-ray absorption, strong
scattering, and is prone to beam-damage.[14] Polyimide, commercially known as Kapton®, is
X-ray resistant[15]. It is generally used as a window material to close the channel geometry and to
make complete devices.[1,13,16–18] Polystyrene (PS) was shown to exhibit adequate properties in
combination with X-rays. It is used to prepare devices[19,20] and windows.[16] Silicon nitride was
used for windows.[21] UV curable TE polymers were also used to make devices.[22,23]
This class of material, based on thiol and allyl groups, opens a new field for soft lithography
microfluidics.[24,25] In particular the off-stoichiometric TE (OSTE)[26], has specific properties for
microfluidic devices. Its surface can be easily modified, it exhibits strong adhesion properties with various substrates (e.g. silicon and glass), it is optically transparent and shows biological
compat-ibility.[24] Additionally, this material is very promising for combining microfluidic and small angle
X-ray scattering. Ghazal et al., have combined SAXS and a microfluidic device made of an OSTE piece and two polystyrene windows, to probe the dynamics of structural transition of phytantriol
cu-bosomes under increasing calcium ions concentration.[16] Rodríguez-Ruiz et al.[27,28] used a hybrid
microfluidic platform made of off-stoichiometry thiol-ene-epoxies (OSTE+) and Kapton® windows
to evidence an amorphous primary phase in the first moments of cerium oxalate precipitation. Until now, OSTE+ was used in combination with different window materials. Although OSTE+ devices have already been described, no microfluidic device for in-situ SAXS has been made from OSTE+
alone[27,29–34].
Here, we report the fabrication of a thin full OSTE+ chip that is compatible with X-rays and its preparation protocol based on soft-lithography techniques. First, the used OSTE+ is characterized regarding its interactions with X-ray radiation. We calculated and measured the transmission coefficient, the attenuation coefficient, the scattering pattern and the aging of OSTE+ under a X-ray beam. Then we describe a protocol to manufacture thin OSTE+ devices, and a method to extract the scattering patterns of both the droplet and carrier phase from a segmented flow in the device. Finally, the proof of concept for the use of a droplet generator OSTE+ device combined with in-situ SAXS is presented by studying i) the SAXS signature of 9.4 nm ± 1.0 nm sized gold nanoparticles in water droplets, ii) the liquid/liquid extraction of cerium oxalate in the oil phase and iii) the wide angle X-ray scattering (WAXS) signal from cerium oxalate crystals synthesized in a binary water-1,2-propanediol solvent.
2
Materials and Methods
2.1
Materials
Off-stoichiometry thiol-ene-epoxy (OSTE+) pre-polymers (OSTEMER 322) are purchased from Mercene Labs. The negative molds and flats were prepared by mixing the PDMS elastomer base
Aldrich. Span 80 (sorbitan monooleate) was acquired from CRODA and used in combination with hexadecane and light mineral oil. The gold nanoparticles suspension was obtained from a
classi-cal reverse Turkevitch synthesis (see ESI Section 1†). Cerium nitrate (Ce(NO
3)3) and oxalic acid
(H2C2O4) were purchased from Sigma-Aldrich and used without further purification to prepare
aqueous solutions at 0.10 m Ce(NO3)3 and 0.15 m H2C2O4.
2.2
OSTE+ Preparation and Microfluidic Device Fabrication
The presented protocol is based on the technical sheets supplied with OSTEMER 322. It was developed to produce thin microfluidic devices with controlled thickness. The manufacturing steps
are shown in Figure 1.
OSTE+ Glass PDMS 1. UV 2. 90 °C 3. drilling UV 90 °C A B C 150 µm 200 µm 200 µm
Figure 1: OSTE+ device fabrication. A: First, PDMS molds are consecutively filled with OSTE+
pre-polymer, aligned, exposed to UV and demolded. The flexible OSTE+ is then cured at 90◦C
and access holes are drilled into the material. B: Second, PDMS molds are consecutively filled with OSTE+ pre-polymer, aligned, exposed to UV and demolded. C: Lastly, the flexible bottom
part is aligned to the rigid top part and cured at 90◦C.
OSTE+ pre-polymers were mixed in the recommended ratio (1.00:1.09) with a vortex mixer and shaken by hand until all haziness disappeared. Before using the mixture, it was left to rest until no air bubble was visible anymore (usually 5 to 10 min). Afterwards, it was poured on PDMS
flexible piece of OSTE+ was then placed on a 1 mm flat sheet of polytetrafluoroethylene (PTFE)
and cured in an oven at 90◦C over night. Access holes were machined into the fully cured piece
with a bench-top drill. A PMMA template was used to align the drill with the device in order to obtain reproducible hole distances. The cured and drilled piece was then rinsed with alcohol, blow dried with pressurized air and cleaned with sticky tape. Afterwards, it was aligned and bubble-free
laminated onto a UV-cured flat piece of OSTE+ at room temperature (Figure1C). It is important
to note that the lamination can be done either by pressing by hand or with a hot roll laminator (ZX-J series HF-380, Innovo). The assembled piece was then transferred onto a PTFE sheet and
again cured at 90◦C overnight in an oven.
To increase the hydrophobic character of OSTE+ surface in the microfluidic chip, the channels were flushed with a fluorosilane polymer solution (Novec 1720, 3M) before putting it on a hotplate
at 110◦C for 30 min. This process was repeated for a total of three times.
To assess the influence of the curing temperature on the scattering profile, an additional heat
treatment was performed on some pieces (150◦C for seven days).
2.3
Droplet Generation
The microfluidic device is connected to computer controlled (neMESYS UserInterface, Cetoni) sy-ringe pumps (neMESYS system, Cetoni) via a commercial device holder (ICH-01K, IMT). Polyether ether ketone (PEEK) tubing is connected to gas tight syringes (SGE Analytical Science) by Luer adapters and to the device holder by hollow screws with a PTFE gasket on their tip (see ESI Section 3). To use the device holder in the X-ray scattering experiments, the device holder was customized and an adapter was machined from stainless steel.
Observations were made through a microscope (IMT-2, Olympus) with a mounted and computer controlled (Phantom Camera Control 2.2, Ametek) high speed camera (Phantom v7.3, Vision Research). Droplets are generated by uniting three streams of water and feeding the united stream into a T-junction with an immiscible phase. The flow rates, the wetting behavior, and the droplet pinch-off were optimized. To observe reactivity in the formed droplets, two of the three water streams were substituted by a stream of cerium nitrate and oxalic acid solution respectively. These two channels were separated by a stream of an inert phase (here water) solvent in the center channel to avoid any reaction before reaching the mixing part of the device. The droplets were then allowed to mix in a passive 2 cm long serpentine mixer, and to age in a 24 cm long channel before being collected.
2.4
SAXS Experiments
X-ray scattering experiments were performed at i) the SWAXS Lab Saclay on a XEUSS 2.0 labora-tory set-up (Xenoxs) at a photon energy of 8.04 keV with a Pilatus3 R 1M detector (Dectris) at a
beamline of the SOLEIL synchrotron facility in France, with a Eiger 4M detector (Dectris). Static experiments at SOLEIL were realized at photon energy of 16.00 keV and a sample detector dis-tance of 52.2 and 616.5 cm with a 75 µm × 450 µm (vertically × horizontally) sized beam. While in-situ microfluidic experiments were realized at 12.00 and 16.00 keV at a sample detector distance of 52.2 cm with a 50 µm × 125 µm (vertically × horizontally) sized beam. At least 100 frames are collected in a typical acquisition sequence, with an acquisition time of 50 ms, and a minimum gap time of 25 ms (at least half of the acquisition time) between two consecutive frames. The microfluidic device and the X-ray beam were aligned using a periscope camera provided by the
SWING facility (see ESI Section 4). The photon flux was typically 1 × 10¹¹s−1 for 16 keV during
the in-situ experiments.
For both SAXS set-ups (i.e. SWAXS lab and SWING), the sample detector distance was calibrated with tetradecanol and silver behenate. For transmission measurements, the sample thickness was measured with a digital micrometer (293-521 N, Mitutoyo, precision of 1 µm, and a
probe head diameter of 6.35 mm2).
2.5
SAXS Data Treatment
The scattering patterns were masked and azimuthally averaged to yield the scattering curve I(q). The intensity was normalized by the solid angle, the acquisition time and the transmitted flux. After background subtraction, the intensity was normalized by the sample thickness and brought
to absolute scale by either the measurement of the direct beam (XEUSS)[35] or through an indirect
calibration with Lupolen and water (SWING).[36,37]The scattering vector is defined as q = 4π
λ sin θ,
with λ the wavelength and θ the scattering angle.
A dedicated Python 3 code has been developed to process the in-situ SAXS data and to isolate
the scattering signals from the microfluidic chip.[38]
The nexusformat§ package, made available by the SWING facility, was used to read data from
the Nexus data files, and the pyFAI[39]¶ package was used to achieve azimuthal averaging and
normalization by the solid angle.
ex-ld la
lb
Figure 2: Train of droplets in a microfluidic channel that passes a rectangular X-ray beam. The
droplet length ld, beam length lb, and acquisition length la are indicated. The beam spot is shown
as a solid white rectangle, while the broken white rectangle shows the part of the droplet that has already crossed the beam during the acquisition time.
In order to isolate the scattering signal of the two phase segments, certain prerequisites have to be met. For a given flow rate ratio of the two phases, the length of the droplet segment
ld is constant. During the experiment the droplets pass the X-ray beam, which is characterized
by its length lb along the channel axis. To isolate the signal of the droplets, ld > lb has to be
fulfilled, otherwise lb is never completely filled by the droplet. During the acquisition time ta, the
droplets move with a velocity v through the channel. Thus, the acquisition time corresponds to an
acquisition length la= ta· v along which the scattering signal is collected. The acquisition length
that is necessary to obtain a signal from a droplet alone is la ≤ ld− lb. By choosing la smaller than
ld, the probability of collecting the signal from the droplet alone increases, and several patterns of
the same droplet can be acquired for la ld. The frequency of acquisition fa can be equal to,
lower, or higher than the droplet frequency fd. However, for fa = n · fd (n ∈ N) the acquisition
should be synchronized with the passing droplets. Otherwise, a phase shift between the acquisition and the passing droplets might result in a convolution of the droplet and carrier phase patterns, or patterns that are only from the carrier phase.
For the case fa6= fd, three different types of scattering patterns are obtained: i) patterns from
the carrier phase alone, ii) mixed scattering patterns from the carrier phase and the droplet phase, and iii) patterns of the droplets alone. These scattering patterns have then to be sorted, in order to obtain information about the individual phases.
Figure 3 depicts the methodology implemented to isolate the scattering signal of the droplet
and the oil phase. It shows 150 scattering patterns that were collected in fast succession, which results in a mixture of all three above-mentioned pattern types. The scattering patterns were then sorted by choosing a segment of the scattering vector (grey area) for which the carrier phase and the droplet phase have a different scattering intensity, and where no Bragg-peak develops. The intensity in this segment was integrated and the value was assigned to the corresponding frame. The frames were then categorized based on threshold values, rejecting all patterns that were related to the mixture of oil and droplet phase. Unlike the method employed by Saldanha et al., the described method does not discard the frames of the oil phase and consequently allows the
100 101 q / nm 1 Intensity / a.u. 0 25 50 75 100 125 150 frame number Int. / a.u. 100 101 q / nm 1 Intensity / a.u. oil droplet
b
c
Figure 3: a: 150 scattering patterns that were acquired at one sampling point. The grey area is integrated for curve selection. b: The integrated intensity is plotted for each frame. Based on the different values, oil and droplet patterns can be isolated by defining threshold values (yellow for oil, green for droplet). All patterns in-between are discarded, as they are associated with scattering from mixed oil/droplet sections. c: Scattering patterns after selection. Oil and droplet phase are
Table 1: Main components (initiators are omitted) and their used ratio in an OSTE+ formu-lation from literature and its relative composition used to calculate the linear attenuation
coeffi-cient.[42,43]Only Pentaerythritol tetrakis(2-mercaptoacetate) (PTMA),
1,3,5-Triallyl-1,3,5-triazine-2,4,6(1H,3H,5H)-trione (TATATO) and Bisphenol A diglycidyl ether (BADGE) are considered for the calculation Name C H N O S Ratio PTMA 13 20 0 8 4 1.5 TATATO 12 15 3 3 0 1 BADGE 21 24 0 4 0 0.5 OSTE+ 42 57 3 17 6
3
Results and Discussion
3.1
X-ray Compatibility
3.1.1 X-ray Transmittance and Linear Attenuation Coefficient
To be considered as an interesting material for in-situ X-ray investigations, a material has to show good transmittance and scattering properties. The linear attenuation coefficient µ of a material describes the decrease in transmission T per unit-length d as:
µ = − ln T
d
It can be either determined from the measured transmission of a sample with known thickness, or it
can be calculated from the mass attenuation coefficient (µ
ρ)and the density ρ of the material. The
mass attenuation coefficient can be calculated from the tabulated mass attenuation coefficients
of the individual atoms(µ
ρ)i[40,41] that constitute the material and their corresponding ratios in the
material mi mx: (µ ρ)x = X mi mx (µ ρ)i
The transmission measurement of OSTE+ samples of different thickness (335, 511, 537 and
685 µm) are plotted in Figure 4a and yielded µ =24.4 cm−1. Since the composition and density
of Ostemer 322 are unknown, the values of an OSTE+ formulation from literature were used to
estimate the attenuation coefficient by calculation. Table 1 summarizes the main components
of a published OSTE+ formulation.[42,43] With a density of δ =1.15 g cm−3 and a total chemical
composition of C42H57N3O17S6[42,43], the calculation yields µ = 24.9 cm−1 at 8.04 keV. Since
collected and calculated data agree well, we calculated µ for other relevant energies to obtain the
theoretical transmission at different energies as function of the thickness (Figure 4a). At 8.04 keV.
5.0 7.5 10.0 12.5 15.0 17.5 20.0 Photon energy / keV
100
101
102
103
Linear att. coef. / cm
1 QuartzPDMS OSTE+ PET Polyimide PEEK PMMA COC 0 200 400 600 800 1000 Thickness / m 0 20 40 60 80 Transmission / % 16 keV 12 keV 8 keV experimental data
b
Figure 4: a: Experimental and calculated transmission of OSTE+ at different sample thickness and different photon energies. Data points were collected at a photon energy of 8.04 keV (XEUSS
2.0). b: Calculated linear attenuation coefficient µ of different materials (see Table 2), including
those of polyimide and OSTE+ for photon energies from 5 to 20 keV. Data was calculated with
Table 2: Generic repeat unit formulas and approximate densities ρ used in the calculation of the linear attenuation coefficient for Cyclic olefin copolymer (COC), Polydimethylsiloxane (PDMS), Polyether ether ketone (PEEK), Polyethylene terephthalate (PET), Poly(methyl methacrylate) (PMMA) Name Formula ρ / g cm−3 COC C9H14 1.02 PDMS C2H6OSi 0.965 PEEK C19H12O3 1.32 PET C10H8O4 1.38 PMMA C5H8O2 1.18 Polyimide C22H10N2O5 1.43 Quartz SiO2 2.65
The transmission is higher at higher energies. Therefore, a chip of greater thickness could be used without losing too many photons by absorption.
Figure 4b compares the linear attenuation coefficient of OSTE+ and different materials (see
Table 2) typically used in microfluidics and for X-ray scattering The materials can be divided into
three groups. Quartz is the first and has the highest linear attenuation coefficient due to its high density, and the presence of heavier elements compared to the organic polymers. The second group consists of OSTE+ and PDMS, which have higher coefficients due to the presence of S and Si, respectively. The members of the last group have the lowest linear attenuation coefficients
and contain only elements from the first and second period[2,44]. Regarding the linear attenuation
coefficient, the thermoplastic COC appears as the best material for X-ray compatibility. However, protocols for making COC devices are based on hot embossing techniques for making the structures and followed by a chemical or thermal bonding to close the devices. Although these methods are
known[45] and have been simplified during the last decade[46], they are still difficult to implement.
Compared to polyimide, which is a commonly used material in X-ray scattering, OSTE+ absorbs more photons at any given thickness. In other words, at identical thickness, OSTE+ has a lower transmission than polyimide.
3.1.2 X-Ray scattering profile
The absolute scattering intensity of polyimide and OSTE+ are plotted against the scattering vector
q in Figure 5a. Polyimide shows the typical bump between 0.3 to 2 nm−1 and the typical peaks at
4 and 8 nm−1. OSTE+ has a scattering profile similar to that of polyimide between 10 to 20 nm−1,
but has no defined peaks. At smaller values of q, the scattering intensity of OSTE+ is up to 180 times lower than that of polyimide. This means that, at equal thickness, OSTE+ produces less background scattering than polyimide. The good compromise between X-ray absorption and scattering properties of OSTE+ makes it a suited candidate for SAXS sample environments. Until
10 1 100 101 q / nm 1 10 1 100 101 102 103 Intensity / cm 1 peaks peaks bump Polyimide 10 1 100 q / nm 1 10 2 10 1 100 101 102 Intensity / cm 1 90 °C 150 °C 0 200 400 Time / s 0.15 0.20 0.25 I. / cm 1 90 °C 150 °C
b
Figure 5: a: Scattering patterns of OSTE+ and polyimide, collected with a photon energy of 8.04 keV (XEUSS 2.0). b: Comparison of the aging behaviour of OSTE+ that was normally cured
at 90◦C (colored curves and points) and after additional curing at 150◦C (black curves and points)
under the influence of X-rays at 16 keV. OSTE+ was irradiated for a total of 500 s by repeatedly
acquiring scattering images. The inset shows the change in intensity at 0.2 nm−1 with increasing
now, however, no full OSTE+ chip has been used for SAXS measurements. Generally, OSTE+ is used in combination with a polyimide window as described by Rodriguez et al. for in-situ
experiments.[27]
3.1.3 Aging of OSTE+ under influence of X-rays and heat
In order to check if the scattering pattern of OSTE+ alters under the influence of X-rays, a piece of OSTE+ (511 µm thickness) was irradiated for a total of 500 s by repeatedly acquiring scattering images. The same procedure was repeated for a piece of 538 µm-thick OSTE+ that
was additionally cured at 150◦C. During the additional curing, the color changed to orange (see
ESI Section 5). After the SAXS experiments, an orange stain is observed at the beam position
for both chips (similar to Figure S8†), but vanishes after some weeks. Figure 5b shows the SAXS
patterns of the two OSTE+ samples. For OSTE+ that was cured under normal conditions (90◦C),
the bump between 0.07 and 1 nm−1 increases while the slope below 0.07 nm−1 slightly decreases
with increasing irradiation time. Above 1 nm−1 the scattering does not change significantly. For
the sample that was cured at 150◦C no change is observable with increasing irradiation time.
The similarities of the two patterns and the saturation curve for the sample that was cured at
90◦C suggest that the observed changes are induced by heat and that the magnitude of change
is influenced by the experienced temperature. By choosing an appropriate curing temperature, structural changes in the polymer during the experiment could be prevented. Additionally, the stream of liquid during microfluidic experiments is expected to cool the material and may delay or prevent any pattern changes.
Nonetheless, staining was observed during the in-situ microfluidic experiments (Figure S8†).
The origin of staining is not very clear, since it was also observed for OSTE+ that was cured
at 150◦C, while no consecutive change in the scattering pattern was observed. Hence, the stain
might not have an influence on the scattering pattern. These observations have to be related to
the recent published results from Geczy et al.[47] who evidenced that heating thiol-ene materials
improves compatibility with solvent. They explain the effect of the heat treatment by a structural rearrangement with a volumetric change in the polymer and an increase of the glass transition
temperature. Although we operate at a lower temperature (150◦C instead of 200◦C), our results
are consistent with their observations. Indeed, Figure 5b clearly shows structural differences after
the heat treatment. The lower slope in the small q range indicates a different organization inside the material (between electron rich density and electron poor density regions), while the increase of the bump intensity could be related to an increase of the order in the material. Analysis by SAXS would be a good tool to find the optimum thermal curing conditions of OSTE+ in order to attain a stable structure.
200 0 200 Width / a.u. 0 50 100 Height / OSTE+ Master
c
d
e
Figure 6: a: Finished device. b: Channel height profile for the finished device and the master. A shrinkage of 5 % is observed after the final curing of OSTE+. c: Microscopy image for a channel in an open OSTE+ Device. The channel has a width of 190 µm and a height of 150 µm. Scale
bar is 100 µm. d: Droplets with a concentration of 0.010 m Ce(NO3)3 and 0.015 m H2C2O4 right
after generation. Arrows point at translucent material inside the droplet. Scale bar is 200 µm. e: Droplets right after leaving the device showing aggregated dark spots. Scale bar is 200 µm.
3.2
OSTE+ Device for in-situ SAXS
3.2.1 Droplet-based OSTE+ device
Full OSTE+ chips for SAXS and optical microscopy were manufactured to produce a train of water droplets in different oils by a standard droplet generator. The detailed protocol is reported in the
Table 3: Measurements of the device thickness at different positions. Positions 2 and 5 are in the center of the device, while 1, 3, 4 and 6 are closer to the edge of the device
Position Thickness / µm 1 488 2 424 3 492 4 475 5 436 6 486
value, and slightly inhomogeneous (Table 3). This result, representative of all the produced chips,
however varies slightly from one chip to another. One possible explanation is that pressing the molds together to remove excess pre-polymer compresses the molds more than intended, resulting in thinner walls. It also appears that the glass slide is not able to entirely prevent the collapse of the elastic PDMS molds under pressure. Thus, although thin walls are preferable to achieve in-situ SAXS measurements, because the thinner the walls, the lower the background scattering of OSTE +, the thickness variation along the channels will result in a different SAXS background for each
position. Due to the slight height inhomogenities (<16 %, see Table3) of the device, a background
measurement for each position must be taken. We can note that a more rigid mold should help to rationalize the thickness variation and thus makes easier the measurements.
We use a device made of 4 inlets (3 for the segmented aqueous phase, 1 for the carrier oil
phase) and 1 outlet (Figure 6a). The 3 channels intercept at a junction where droplets are created
by the shearing of the oil phase (see inset Figure 6a). Immediately after the drops have formed,
a passive serpentine mixer of 2 cm allows for fast and homogeneous mixing inside the droplets. Under the used flow conditions, the mixing time is approximately 500 ms. Once the droplets are mixed, they age in a 24 cm-long channel where it is possible to acquire SAXS patterns at different
positions Pi, as it will be shown later.
3.2.2 Solvent compatibility for droplet generation
In order to generate droplets in a microfluidic device, a particular attention had to be paid to the surface chemistry of the channels. Indeed to handle droplets in oil, the channels must be hydrophobic, or in other words, the continuous phase must wet the surfaces. Without the addition of surfactants or surface modification of the channel walls, only 3-octanol enabled to successfully generate well-stabilized droplets. After surface modification by a fluorosilane polymer, it was possible to generate water droplets with 3-octanol, hexadecane and FC-40. Solutions of hexadecane and light mineral oil with 1 % (w/w) of Span 80 were able to stabilize water-in-oil droplets in devices with and without surface treatment. In addition to these solvents, a wider range of solvent
solvents such as chloroform, tetrahydrofuran, dimethylformamide, after heat treatment of OSTE+ materials. This opens the way towards multiple applications of the OSTE+ chips (e.g. chemical reactivity and liquid/liquid extraction studies).
The chips were successfully tested for the precipitation of cerium oxalate inside the droplets from
the reaction between cerium nitrate and oxalic acid in aqueous solution (2 Ce(NO3)3+3 H2C2O4+
10 H2O −−→ Ce2(C2O4)3·10 H2O ↓ + 6 HNO3) (see Figure 6d). The flow rates were 4 µL min−1
for water in the central channel of the junction, 0.5 µL min−1 for 0.10 m Ce(NO
3)3, 0.5 µL min−1 for
0.15 m H2C2O4and 6 to 10 µL min−1for the oil phase (light mineral oil with 1 % (w/w) of Span 80).
For this particular case of cerium oxalate precipitation, it was necessary to add a surfactant to the carrier phase in order to prevent channel blockage by precipitate deposits on the channel wall. These droplets were also stable enough to be collected and observed after they left the device (see
Figure 6e). The same conditions were used for the in-situ SAXS experiments.
3.3
In-situ SAXS characterizations
We used the combination of in-situ SAXS and droplet generation chips to follow the SAXS signal in the droplets along the microfluidic channel. The signals form oil and droplets are separated following the protocol described in Materials and Methods. We took benefit from the difference between oil and water in the WAXS region to differentiate between the phases. The protocol was first applied to a gold nanoparticles suspension and then used to study a reactive system.
3.3.1 Inert system: AuNPs
The device was tested regarding its capability to acquire the scattering patterns of a gold nanopar-ticle (AuNP) suspension inside the channel under static and dynamic conditions. The carrier phase
was hexadecane with 0.2 % (w/w) of Span 80, the flow rates were 5 µL min−1 for the gold
disper-sion, 0.5 µL min−1 for each water inlet, and 4 µL min−1for the oil phase. Measurements were carried
out in a OSTE+ device without surface treatment. The experiments were performed at 16 keV with a small beam size (50 µm × 125 µm, vertically × horizontally), implying a strong reduction of the beam intensity.
100 q / nm 1 10 2 10 1 100 Intensity / cm 1 AuNP reference ta= 100 ms AuNP feed ta= 100 ms AuNP droplet ta= 20 ms Oil Au H2O H2O
Figure 7: SAXS patterns of gold nanoparticles (AuNP) in a Kapton capillary (diameter 1.506 mm) as reference and inside the microfluidic device in the feeding channel (150 µm) and in the droplets flowing in the microfluidic device. Data collected at 16 keV and averaged over ten frames. Inset shows sampling points (red) and channel contents.
Nonetheless, it still allows the observation of the first part of the AuNP form factor below 1 nm−1,
which is related to the size of the nanoparticles. The mismatch in intensity probably results from the low photon flux due to the small beam size used and the chosen energy (16 keV).
Nevertheless, the successful identification of the particles inside the droplets in a 150 µm chan-nel at a concentration of 212 µm demonstrates the capability of a full OSTE+ chip for SAXS measurements. These first results clearly underline that such microfluidic SAXS experiments would greatly benefit from the application of a microfocused beam, which would improve the signal to noise ratio.
3.3.2 Reactive system: Cerium oxalate precipitation in water
The precipitation reaction of cerium oxalate was used as a case study for the observation of the temporal changes during a rapid reaction inside the droplets.
The precursor solutions were encapsulated into a droplet under the above-mentioned flow
con-ditions, and mixed in the serpentine mixer. Several positions Pi were probed along the microfluidic
channel (see Figure8). Thanks to the developed data treatment, it was possible to observe the oil
phase and the droplet phase separately.
For the observation of the oil phase, the scattering of the corresponding empty positions on the device, and a proportionate amount of the pure oil scattering were subtracted. Background subtraction for the droplet phase was carried out by subtracting the scattering signal taken at the water inlet. Artifacts from the oil lubrication film surrounding the droplets should not appear, since
its thickness can be estimated to be below 1 µm in total.[48]
100 q / nm 1 10 4 10 3 10 2 Intensity / cm 1 q 3 P1 = 2.1 s P2 = 7.9 s P3 = 13.7 s P4 = 19.5 s P5 = 25.2 s P6 = 29.6 s 100 q / nm 1 10 2 10 1 Intensity / cm 1 AuNP feed ta= 10 100 ms AuNP droplet ta= 10 20 ms 100 q / nm 1 10 3 10 Intensity / cm 1 P3 = 14.6 s P4 = 20.8 s P5 = 27.0 s P6 = 31.7 s 4.0 nm 6.5 nm Oil H2O Ce Ox
b
H2O Oil Oil H2O Ce OxFigure 8: a: Oil phase SAXS patterns at different points in the microfluidic channel. The broken lines indicate the scattering signal that would be generated by spherical objects of 4.0 ± 1.0 and 6.5 ± 1.0 nm diameter. Inset shows sampling points (red) and channel contents. Data collected at
12 keV and a total flow rate of 14 µL min−1. b: Droplet phase SAXS patterns at different points in
the microfluidic channel. Inset shows sampling points from P1 to P6 (red) and channel contents.
Data collected at 12 keV and a total flow rate of 15 µL min−1.
intensity from low to high values of q. This is characteristic of electronic density fluctuations in the solution and indicates the presence of nanometer sized objects. From the first sampling point
to the last, the observed minimum between 1 and 2 nm−1 shifts to lower values, while the intensity
below 1 nm−1 increases. After P4, the changes are only minimal and the process seems to be
finished. This could be explained by the presence of reverse micelles in the oil phase that swell by extracting water and/or reactants from the droplets. The high similarity between the in-situ
10
010
1q / nm
110
210
1Int
en
sit
y /
cm
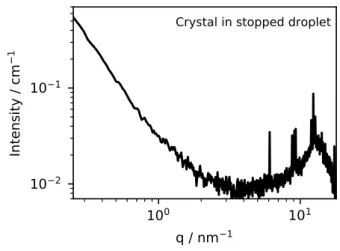
1Crystal in stopped droplet
Figure 9: In-situ scattering pattern of cerium oxalate that was formed inside a stopped droplet. The droplet age is approximately 15 min. Data collected at 12 keV.
6.5 nm. Compared to the objects in the pre-contacted mineral oil, the larger size observed in the situ-experiment is probably not only related to an extraction, but could be explained by the growth of cerium oxalate particles inside the reverse micelles.
The scattering patterns of the droplets show slopes that scale with ≈ q−3 and a small bump
below 1 nm−1(Figure8). With increasing droplet age, the bump shifts its position towards smaller q
values, indicating the growth of scattering objects. After subtraction of a q−3 slope, the bump gets
even more pronounced, evidencing the growth of globular objects (see Figure S10†). The position
of the bump is similar to the patterns that were observed in the oil phase. From the comparison to the theoretical curves of polydisperse spheres, it can be estimated that these objects grow from 4.0 nm at P1 to 6.5 nm at P6. Comparing the scattering plateau of the spherical objects at small q values reveals that the scattering intensity in the oil phase is approximately 10 times larger than in
the droplet phase. Additionally, the q−3slope indicates the presence of a 3-dimensional organization
inside the droplets, which is in agreement with the observations from Rodriguez-Ruiz et al.[27,28]
From single phase microfluidic SAXS experiments, they identified the existence of an intermediate phase with a fractal organization that quickly evolves towards well-defined micron sized particles. The lower timescale of their experiment might be related to the differences in chemical conditions
and experimental geometry (1 m HNO3 solution and mixing by diffusion). While in our conditions,
we also retrieve the existence of an intermediate phase prior to the crystallization of the particles, the characteristic timescale of the crystallization process is too long to be caught by the in-situ SAXS experiments. Nonetheless, our results evidence that it is possible to follow the evolution of a reaction in the full OSTE+ microfluidic device by SAXS, and that the oil and water phases can be explored independently.
The microfluidic device also allowed to extract the WAXS signal from a cerium oxalate crystal synthesized in a binary water-1,2-propanediol solvent droplet after stopping the flow. The used
solvent is known to modify the morphology of the final particles[49]. An OSTE+ device with surface
treatment was used. The flow rates were 3 µL min−1 for the carrier phase (light mineral oil with
1 % (w/w) of Span 80), 1 µL min−1 for the binary solvent (water:1,2-propanediol in a 25:75 (w/w)
ratio) in the central channel of the junction, 0.5 µL min−1 for 0.10 m Ce(NO
3)3 and 0.5 µL min−1
for 0.15 m H2C2O4.
After the flow was stopped, the scattering patterns of several quasi-stationary droplets were
collected and subtracted from the background of OSTE+ and binary solvent (see Figure S11†).
The droplets quickly showed the typical cerium oxalate Bragg peaks, and the slope below 1 nm−1
decreased to q−2. The decrease of the slope during the reaction is in agreement with the SAXS
observations from macroscopic mixing experiments in binary solvent.[50]The Bragg peaks are closed
to the expected one for the structure of cerium oxalate decahydrate with the following lattice
parameter a = 11.34 Å, b = 9.630 Å, c = 10.392 Å and β = 114.5° (JCPDS card No 20-0268).[51]
Thus, it should be possible to observe the growth from molecular solution to final crystals in the full OSTE+ device in future studies.
4
Conclusion
An Off-Stoichiometric Thiol-Ene-epoxy (OSTE+, Ostemer 322) material was characterized re-garding its X-ray transmission coefficient, attenuation coefficient, scattering pattern and its aging under X-ray light. We showed that the investigated OSTE+ material has competitive scattering
properties compared to commercial polyimide (Kapton®), a commonly used material for SAXS
investigations. In particular, the absolute scattering intensity of OSTE+ is up to 180 times lower than that of polyimide and OSTE+, and does not have any defined Bragg peaks. At last, the X-ray aging of this material could be eliminated by increasing the temperature of the thermal curing step
to (150◦C instead of 90◦C), leading to a structural rearrangement in line with a recent study.
Moreover, we presented a protocol based on soft-lithography to make thin (thickness <500 µm) full OSTE+ chips, which allow to perform in-situ SAXS/WAXS analysis with a standard beam. We also described a way to analyze the scattering signals from droplet and carrier phase in a segmented
Due to its ease of fabrication and its properties (transparency, X-ray compatibility), OSTE+ is an undeniable asset for the miniaturization of instrumentation at synchrotron facilities and opens up great prospects for different X-ray techniques, especially in combination with the focused and more brilliant beams of the new generation of synchrotrons.
Conflicts of interest
There are no conflicts to declare.Author Contributions
TL: Conceptualization, Data curation, Formal analysis, Investigation, Methodology, Software, Vi-sualization, Writing – original draft, Writing – review & editing. SC: Conceptualization, Funding acquisition, Investigation, Project administration, Supervision, Validation, Writing – review & edit-ing. TB: Investigation. FT: Conceptualization, Funding acquisition, Investigation, Project adminis-tration, Supervision, Validation, Visualization, Writing – original draft, Writing – review & editing. FM: Conceptualization, Investigation, Methodology, Supervision, Validation, Visualization, Writing – original draft, Writing – review & editing.
Acknowledgements
We acknowledge the Laboratory Leon Brillouin (LLB) for the access to the SWAXS Lab facility and O. Taché for his help for the SAXS experiments in the SWAXS Lab. We acknowledge the synchrotron SOLEIL for the provided beamtime (proposal 20181598). We wish to thank T. Bernard for the mechanical design of the chip holder for SAXS experiments; S. Teychené and I. Rodriguez-Ruis for their help during the SWING run and associated fruitful discussions and F. Gobeaux for the TEM images of the gold nanoparticles. We acknowledge M. Paternostre for the access to the mini-electron microscopy platform “TEM-team” (CEA/iBiTec-S). This work was funded by the CEA Amont-Aval program.
[1] A. Ghazal, M. Gontsarik, J. P. Kutter, J. P. Lafleur, D. Ahmadvand, A. Labrador, S. Salentinig and A. Yaghmur, The journal of physical chemistry letters, 2017, 8, 73–79.
[2] A. Ghazal, J. P. Lafleur, K. Mortensen, J. P. Kutter, L. Arleth and G. V. Jensen, Lab on a
Chip, 2016, 16, 4263–4295.
[3] B. F. B. Silva, Physical Chemistry Chemical Physics, 2017, 19, 23690–23703.
[4] L. Pollack, M. W. Tate, A. C. Finnefrock, C. Kalidas, S. Trotter, N. C. Darnton, L. Lurio, R. H. Austin, C. A. Batt, S. M. Gruner and S. G. Mochrie, Physical Review Letters, 2001,
86, 4962–4965.
[5] L. Pollack, M. W. Tate, N. C. Darnton, J. B. Knight, S. M. Gruner, W. A. Eaton and R. H. Austin, Proceedings of the National Academy of Sciences of the United States of America, 1999, 96, 10115–10117.
[6] H. Song and R. F. Ismagilov, Journal of the American Chemical Society, 2003, 125, 14613– 14619.
[7] H. Song, J. D. Tice and R. F. Ismagilov, Angewandte Chemie International Edition, 2003, 42, 768–772.
[8] B. Zheng, J. D. Tice, L. S. Roach and R. F. Ismagilov, Angewandte Chemie International
Edition, 2004, 43, 2508–2511.
[9] R. Stehle, G. Goerigk, D. Wallacher, M. Ballauff and S. Seiffert, Lab on a Chip, 2013, 13, 1529–1537.
[10] N. Pham, D. Radajewski, A. Round, M. Brennich, P. Pernot, B. Biscans, F. Bonneté and S. Teychené, Analytical Chemistry, 2017, 89, 2282–2287.
[11] I. Rodríguez-Ruiz, D. Radajewski, S. Charton, N. Phamvan, M. Brennich, P. Pernot, F. Bon-neté and S. Teychené, Sensors (Basel), 2017, 17, 1266.
[14] A. Merlin, J. Angly, L. Daubersies, C. Madeira, S. Schöder, J. Leng and J.-B. Salmon, The
European Physical Journal E, 2011, 34, 58.
[15] R. Barrett, M. Faucon, J. Lopez, G. Cristobal, F. Destremaut, A. Dodge, P. Guillot, P. Laval, C. Masselon and J.-B. Salmon, Lab on a Chip, 2006, 6, 494–499.
[16] A. Ghazal, M. Gontsarik, J. P. Kutter, J. P. Lafleur, A. Labrador, K. Mortensen and A. Yagh-mur, Journal of Applied Crystallography, 2016, 49, 2005–2014.
[17] V. Lutz-Bueno, J. Zhao, R. Mezzenga, T. Pfohl, P. Fischer and M. Liebi, Lab on a Chip, 2016, 16, 4028–4035.
[18] S. With, M. Trebbin, C. B. A. Bartz, C. Neuber, M. Dulle, S. Yu, S. V. Roth, H.-W. Schmidt and S. Förster, Langmuir, 2014, 30, 12494–12502.
[19] K. N. Toft, B. Vestergaard, S. S. Nielsen, D. Snakenborg, M. G. Jeppesen, J. K. Jacobsen, L. Arleth and J. P. Kutter, Analytical chemistry, 2008, 80, 3648–3654.
[20] J. P. Lafleur, D. Snakenborg, S. S. Nielsen, M. Møller, K. N. Toft, A. Menzel, J. K. Jacobsen, B. Vestergaard, L. Arleth and J. P. Kutter, Journal of Applied Crystallography, 2011, 44, 1090–1099.
[21] T. D. Murray, A. Y. Lyubimov, C. M. Ogata, H. Vo, M. Uervirojnangkoorn, A. T. Brunger and J. M. Berger, Acta crystallographica. Section D, Biological crystallography, 2015, 71, 1987–1997.
[22] O. Saldanha, M. E. Brennich, M. Burghammer, H. Herrmann and S. Köster, Biomicrofluidics, 2016, 10, 024108.
[23] M. E. Brennich, J.-F. Nolting, C. Dammann, B. Nöding, S. Bauch, H. Herrmann, T. Pfohl and S. Köster, Lab on a Chip, 2011, 11, 708–716.
[24] D. Sticker, R. Geczy, U. O. Häfeli and J. P. Kutter, ACS Applied Materials & Interfaces, 2020,
12, 10080–10095.
[25] T. Hong, W. Liu, M. Li and C. Chen, The Analyst, 2019, 144, 1492–1512.
[26] C. F. Carlborg, T. Haraldsson, K. Öberg, M. Malkoch and W. van der Wijngaart, Lab on a
Chip, 2011, 11, 3136–3147.
[27] I. Rodríguez-Ruiz, S. Charton, D. Radajewski, T. Bizien and S. Teychené, CrystEngComm, 2018, 20, 3302–3307.
, 2017, 73, C350–C350.
[29] D. Radajewski, PhD thesis, Institut National Polytechnique de Toulouse, Toulouse, 2017. [30] D. Sticker, S. Lechner, C. Jungreuthmayer, J. Zanghellini and P. Ertl, Analytical chemistry,
2017, 89, 2326–2333.
[31] A. Martin, S. Teychene, S. Camy and J. Aubin, Microfluidics and Nanofluidics, 2016, 20, 92. [32] N. van Pham, PhD thesis, Université de Toulouse, Toulouse, 2016.
[33] N. Sandström, R. Z. Shafagh, A. Vastesson, C. F. Carlborg, W. van der Wijngaart and T. Haraldsson, Journal of Micromechanics and Microengineering, 2015, 25, 075002.
[34] D. Sticker, M. Rothbauer, S. Lechner, M.-T. Hehenberger and P. Ertl, Lab on a Chip, 2015,
15, 4542–4554.
[35] V. Geertsen, E. Barruet, F. Gobeaux, J.-L. Lacour and O. Taché, Analytical chemistry, 2018,
90, 9742–9750.
[36] Neutrons, X-rays and light: Scattering methods applied to soft condensed matter, ed. P. Lind-ner and T. Zemb, Elsevier, Amsterdam and Oxford, New ed. edn, 2002.
[37] T. Zemb, O. Taché, F. Né and O. Spalla, Journal of Applied Crystallography, 2003, 36, 800–805.
[38] T. Lange, PhD thesis, Université Paris-Saclay, Saint-Aubin, 2019.
[39] G. Ashiotis, A. Deschildre, Z. Nawaz, J. P. Wright, D. Karkoulis, F. E. Picca and J. Kieffer,
Journal of Applied Crystallography, 2015, 48, 510–519.
[40] S. Seltzer, X-ray Form Factor, Attenuation and Scattering Tables, NIST Standard Reference
Database 66.
[41] T. Schoonjans, A. Brunetti, B. Golosio, M. Sanchez del Rio, V. A. Solé, C. Ferrero and L. Vincze, Spectrochimica Acta Part B: Atomic Spectroscopy, 2011, 66, 776–784.
[45] J. Steigert, S. Haeberle, T. Brenner, C. Müller, C. P. Steinert, P. Koltay, N. Gottschlich, H. Reinecke, J. Rühe, R. Zengerle and J. Ducrée, Journal of Micromechanics and
Microengi-neering, 2007, 17, 333–341.
[46] M. Denz, G. Brehm, C. Y. J. Hémonnot, H. Spears, A. Wittmeier, C. Cassini, O. Saldanha, E. Perego, A. Diaz, M. Burghammer and S. Köster, Lab on a Chip, 2017, 18, 171–178. [47] R. Geczy, D. Sticker, N. Bovet, U. O. Häfeli and J. P. Kutter, Lab on a chip, 2019, 19,
798–806.
[48] A. Huerre, O. Theodoly, A. M. Leshansky, M.-P. Valignat, I. Cantat and M.-C. Jullien, Physical
Review Letters, 2015, 115, 064501.
[49] M. Jehannin, S. Charton, B. Corso, H. Möhwald, H. Riegler and T. Zemb, Colloid and Polymer
Science, 2017, 295, 1817–1826.
[50] M. Jehannin, PhD Thesis, Universite de Montpellier, Potsdam University, 2015.
OSTE+ for in-situ SAXS Analysis with Droplet Microfluidic
Devices
Tobias Lange,
a,bSophie Charton,
bThomas Bizien,
cFabienne Testard
aand Florent Malloggi
a,∗aUniversité Paris-Saclay, CEA, CNRS, NIMBE, CEA Saclay, 91191 Gif-sur-Yvette Cedex, France. b CEA, DES, ISEC, DMRC, Univ. Montpellier, Marcoule, France.
c Synchrotron SOLEIL, l’Orme des Merisiers, Saint-Aubin - BP 48, 91192 Gif-sur-Yvette Cedex, France.
July 7, 2020
Contents
1 Gold Nanoparticles 2 2 Master preparation 4 3 Tube-chip-interface 6 4 Experimental Set-up 7 5 Thermal Aging 8 6 Staining 9 7 Extraction 101
Gold Nanoparticles
Gold nanoparticles were produced from a reverse Turkevich method following the protocol described
by Sivaraman et al.[1] 250 µL of aqueous 25.4 mm HAuCl
4 solution was added rapidly to 24.75 mL
of 5.2 mm boiling citrate solution under vigorous stirring. Boiling was stopped after 250 s and the solution was let without stirring for 12 h before being used. The nanoparticles were characterized by SAXS and Transmission electron microscopy (TEM) and have a diameter of 9.4 nm ± 1.0 nm.
TEM was performed on a Philips CM12 electron microscope operated at 80 kV. A drop of the solution was deposited on a copper grid covered with a carbon film (Agar Scientific). The excess liquid was blotted off with filter paper after a few seconds.
100 q, nm−1 10−3 10−2 10−1 Intensit y, cm − 1
Figure S2: SAXS pattern of the synthesized gold nanoparticles and a fit by polydisperse spheres.
The fit yields a mean diameter of 9.4 nm ± 1.0 nm and a particle concentration of 8.8 × 1012cm−3.
The scattering length density (SLD) of the particles is 1.314 × 1012cm−3 and the SLD of the
2
Master preparation
Si/WBR masters were prepared by laminating layers of dryfilm (50 µm thick WBR2050 and 100 µm thick WBR2100, Dupont) with a hot roll laminator (ZX-J series HF-380, Innovo) onto a Si wafer (diameter 10 cm, Sil’Tronix Silicon Technologies). After the lamination, microstructures were cre-ated by photolithography. To create a photomask the device structure was designed with the help of a computer-aided design program and printed on a flexible polyester film by a commercial service (JD Photo Data, UK).
Before laminating the wafer it was degreased with acetone (99 %, Honeywell) and blow-dried with pressurized air. The first film layer was roughly cut to size and the protective polyethylene layer was removed by using sticky tape, before placing the wafer on a supporting metal plate (Cu, 1 mm thick). Then, the dryfilm was aligned to it with the unprotected side facing the wafer. To reduce wrinkling of the film, the dryfilm was brought into contact with the metal support on the advancing side of the wafer before starting the roll laminator and the film was kept under tension
during the lamination (Figure S3). The lamination temperature was 85◦C and the lamination
speed was approximately 24 mm s−1. After lamination, the wafer was turned upside down and the
excess dryfilm was removed. To apply a second layer of dryfilm, the protective polyester layer on top of the wafer-WBR stack was removed by using sticky tape and the procedure was repeated. The adhesion between the film and the substrate was improved by baking the piece over night at
60◦C in an oven. After the item reached room temperature, the protective polyester layer was
removed by using sticky tape, a photomask was aligned and brought into contact with the film.
The assembly was then exposed to UV light for 20 s at 48.8 mW cm−1 (365 nm, UV-Kub 2, Kloé).
Before development, the excess of dryfilm was removed with a razor blade and it was baked at
100◦C for 60 s on a hot plate (C-MAG HP 10, IKA). After cooling down, it was developed by
applying a stream of 1 % K2CO3 solution with a peristaltic pump (101U, Watson Marlow) until
no undeveloped film was visible anymore. To finish the development it was washed with tap water and carefully blow dried with pressurized air.
WBR
Si
Cu
Figure S3: Lamination of WBR dryfilm onto a Si wafer with a hot-roll laminator. By gently pulling the dryfilm during lamination, it is kept under tension and the final laminate is wrinkle free.
3
Tube-chip-interface
Figure S5: a: IMT device holder with tube connector. b: IMT tube connector with PTFE gasket.
5
Thermal Aging
Figure S7: Left: OSTE+ device after normal curing at 90◦C. Right: OSTE+ device after
7
Extraction
100 q, nm−1 10−3 10−2 10−1 Intensit y, cm − 1 Span 80 Span 80 + H2O Span 80 + Oxaq Span 80 + CeaqFigure S9: SAXS patterns of 1 % Span 80 (w/w) in light mineral oil before and after equilibration
with H2O, 0.15 m H2C2O4 (Oxaq) and 0.10 m Ce(NO3)3 (Ceaq). Background and scattering of
light mineral oil are subtracted. Data collected at 8.04 keV (XEUSS 2.0).
Before equilibration, the scattering of small spherical objects is visible. After equilibration with water, the scattering intensity decreases. The reverse micelles swell by water and the scattering length density of the micelle core decreases Due to the corresponding decrease in electronic contrast between the micelle core and the alkyl chain of the surfactant, the observed scattering intensity decreases as well. No decrease is observable for the solutions that contain reactants, an increase which might indicate a higher scattering length density in the reverse micelle core caused by the presence of oxalic acid or cerium nitrate. In addition, the scattering signal intensity around 1 nm decreases at a lower q value, which indicates a larger particle size for the reverse micelles that
contain Ce(NO3)3 or oxalic acid, compared to water alone. Fitting the equilibrated scattering
patterns with a model of polydisperse spheres yields an approximate size of 3.6 nm ± 0.8 nm for the Span 80 alone, 4.4 nm ± 0.6 nm for equilibration with 0.10 m oxalic acid and 4.6 nm ± 0.6 nm
100 q, nm−1 10−4 10−3 10−2 Intensit y, cm − 1 P1 = 2.1 s P2 = 7.9 s P3 = 13.7 s P4 = 19.5 s P5 = 25.2 s P6 = 29.6 s 4.0 nm 6.5 nm
Figure S10: Droplet scattering patterns after subtraction of the q−3 slope. The broken lines indicate
the scattering signal that would be generated by spherical objects of 4.0 ± 1.0 and 6.5 ± 1.0 nm diameter.
9
Stopped droplet
Figure S11: Top: SAXS patterns of binary solvent and a droplet with growing crystals inside.
[1] S. K. Sivaraman, S. Kumar and V. Santhanam, Journal of colloid and interface science, 2011,