HAL Id: hal-01389908
https://hal.archives-ouvertes.fr/hal-01389908
Submitted on 30 Oct 2016
HAL is a multi-disciplinary open access
archive for the deposit and dissemination of sci-entific research documents, whether they are pub-lished or not. The documents may come from teaching and research institutions in France or abroad, or from public or private research centers.
L’archive ouverte pluridisciplinaire HAL, est destinée au dépôt et à la diffusion de documents scientifiques de niveau recherche, publiés ou non, émanant des établissements d’enseignement et de recherche français ou étrangers, des laboratoires publics ou privés.
Nanoparticles Assembly in Model Industrial
Silica/Rubber Nanocomposites
Adrien Bouty, Laurent Petitjean, Julien Chatard, Rachid Matmour,
Christophe Degrandcourt, Ralf Schweins, Florian Meneau, Pawel
Kwasńiewski, François Boué, Marc Couty, et al.
To cite this version:
Adrien Bouty, Laurent Petitjean, Julien Chatard, Rachid Matmour, Christophe Degrandcourt, et al.. Interplay between Polymer Chain Conformation and Nanoparticles Assembly in Model Industrial Silica/Rubber Nanocomposites. Faraday Discussions, Royal Society of Chemistry, 2016, 186, pp.325-343. �10.1039/C5FD00130G�. �hal-01389908�
This is an Accepted Manuscript, which has been through the Royal Society of Chemistry peer review process and has been accepted for publication.
Accepted Manuscripts are published online shortly after
acceptance, before technical editing, formatting and proof reading. Using this free service, authors can make their results available to the community, in citable form, before we publish the edited article. We will replace this Accepted Manuscript with the edited and formatted Advance Article as soon as it is available.
You can find more information about Accepted Manuscripts in the
Information for Authors.
Please note that technical editing may introduce minor changes to the text and/or graphics, which may alter content. The journal’s standard Terms & Conditions and the Ethical guidelines still apply. In no event shall the Royal Society of Chemistry be held responsible for any errors or omissions in this Accepted Manuscript or any consequences arising from the use of any information it contains.
Accepted Manuscript
Faraday
Discussions
www.rsc.org/faraday_d
Faraday
Discussions
Royal Society of ChemistryThis manuscript will be presented and discussed at a forthcoming Faraday Discussion meeting. All delegates can contribute to the discussion which will be included in the final volume.
Register now to attend! Full details of all upcoming meetings: http://rsc.li/fd-upcoming-meetings
This is an Accepted Manuscript, which has been through the Royal Society of Chemistry peer review process and has been accepted for publication.
Accepted Manuscripts are published online shortly after
acceptance, before technical editing, formatting and proof reading. Using this free service, authors can make their results available to the community, in citable form, before we publish the edited article. We will replace this Accepted Manuscript with the edited and formatted Advance Article as soon as it is available.
You can find more information about Accepted Manuscripts in the
Information for Authors.
Please note that technical editing may introduce minor changes to the text and/or graphics, which may alter content. The journal’s standard Terms & Conditions and the Ethical guidelines still apply. In no event shall the Royal Society of Chemistry be held responsible for any errors or omissions in this Accepted Manuscript or any consequences arising from the use of any information it contains.
Accepted Manuscript
This article can be cited before page numbers have been issued, to do this please use: A. Bouty, L. Petitjean, J. Chatard, R. Matmour, C. Degrandcourt, R. Schweins, F. Meneau, P. Kwaniewski, F. Boué, M. Couty and J. Jestin, Faraday Discuss., 2015, DOI: 10.1039/C5FD00130G.
Interplay between Polymer Chain Conformation and
Nanoparticles Assembly in Model Industrial
Silica/Rubber Nanocomposites
Adrien Bouty a,b, Laurent Petitjean b, Julien Chatard b, Rachid Matmour b, Christophe Degrandcourt b,
Ralf Schweins c, Florian Meneaud,Paweł Kwasńiewskie, François Boué a, Marc Couty b and Jacques
Jestina*
a
Laboratoire Léon Brillouin, CEA Saclay 91191 Gif-sur-Yvette Cedex France
b
Manufacture Française des Pneumatiques MICHELIN, Site de Ladoux, 23 place des Carmes Déchaux,
F-63 040 Clermont-Ferrand, Cedex 9, France
c
Institut Laue-Langevin, BP 156, 6, rue Jules Horowitz, 38042 Grenoble Cedex 9, France
d
Synchrotron SOLEIL, L’Orme des Merisiers, PO Box 48, Saint-Aubin, 91192 Gif/Yvette, France
e
European Synchrotron Radiation Facility, 6 rue Jules Horowitz 38043 Grenoble, France
*
Corresponding authors: jacques.jestin@cea.fr
Faraday
Discussions
Accepted
Manuscript
Published on 10 September 2015. Downloaded by University of Pennsylvania Libraries on 12/10/2015 12:59:40.
View Article Online DOI: 10.1039/C5FD00130G
Abstract
The question of the influence of nanoparticles (NP) on chain dimensions in polymer nanocomposites
(PNC) has been treated mainly through the fundamental way using theoretical or simulation tools and
experiments on well-defined model PNC. Here we present the first experimental study about the
influence of NP on the polymer chain conformation for PNC designed to be as close as possible to
industrial systems employed in tire industry. PNC are silica nanoparticles dispersed into a
Styrene-Butadiene-Rubber (SBR) matrix whose NP dispersion can be managed by NP loading with interfacial
coating or coupling additives usually employed in the manufacturing mixing process. We associated
specific chain (d) labeling, and the so-called Zero Average Contrast (ZAC) method, with SANS, in-situ
SANS and SAXS/TEM experiments to extract the polymer chain scattering signal at rest for non-cross
linked and under stretching for cross-linked PNCs. NP loading, individual clusters or connected
network, as well as the influence of the type, the quantity of interfacial agent and the influence of the
elongation rate have been evaluated on the chain conformation and on its related deformation. We
clearly distinguish the situations where the silica is perfectly matched from the unperfected matching by
direct comparison of SANS and SAXS structure factor. Whatever the silica matching situation, the
additive type and quantity and the filler content, there is no thus significant change in the polymer
dimension for NP loading up to 15% v/v within a range of 5%. One can see an extra scattering
contribution at low Q, as often encountered, enhanced for non-perfect silica matching but also visible
for perfect filler matching. This contribution can be qualitatively attributed to specific h or d chains
adsorption onto the NP surface inside the NP cluster that modifying the average scattering neutron
contrast of the silica cluster. Under elongation, NP act as additional cross-linking junction preventing
chain relaxation giving a deformation of the chain with NP closer to theoretical phantom network
prediction than for pure matrix.
Faraday
Discussions
Accepted
Manuscript
Published on 10 September 2015. Downloaded by University of Pennsylvania Libraries on 12/10/2015 12:59:40.
View Article Online DOI: 10.1039/C5FD00130G
I. Introduction
Progress in the understanding of the mechanisms that govern reinforcement of polymer matrices by NP
is of a strategic interest to improve the design and the industrial processes of conception of new
materials, specifically in tires industries. One of the critical breakthroughs is to be able to understand
and describe the local structure of the filler (individual dispersion, connected network, aggregates or
agglomerates…) as well as the one of the polymer chain (unmodified, stretched or compressed…) and
to correlate them with the macroscopic mechanical behaviors of the materials like reinforcement, flow
behavior or non-linear deformation [1,2]. Despite of the lack of a general model to describe the filler
contribution (NP or assembly of NP), many progresses have been performed recently especially to
dissociate the filler-filler interactions from the filler-matrix ones in reinforcement on both well-defined
model [3-11] and simplified industrial systems [12-18]. On the contrary, the question of the matrix
chain conformation and its modification due to the presence of NP has been, up to now, only addressed
from a fundamental point of view. Theories have been developed using mainly simulations [19-25]
considering the polymer radius of gyration Rg and the NP radius Rp ratio (Rg /Rp). They lead to
contradictory conclusions, either swelling or decreasing of Rg as a function of the NP volume fraction,
mostly when the polymer radius of gyration Rg is equal or superior to the NP radius Rp. For example,
Termonia et al. and Sung et al. [19, 20] reported a significant swelling of the chains for Rg/Rp > 1 while
Vacatello et al. [21, 22] reported a contraction of the chains. Sharaf et al. [23] have reported a swelling
of the chain but for Rg/Rp < 1. The situation has been also probed from an experimental view on
well-defined model systems [26-34] using SANS and conventional polymers for which the labeling (d) forms
can be conventionally accessible. These studies also yield controveral behaviors whose origins can be
discussed according to different issues. A first possible origin is the difficulty to extract the
experimental signal of the chain without ambiguous matching or undefined extra scattering. Nakatani et
al. [26], Mackay et al. [27] (for the C60/PS system) and also Botti et al. [28] extracted the conformation
of the polymer chain from a complex scattering signal in which the interactions between labeled (d) and
Faraday
Discussions
Accepted
Manuscript
Published on 10 September 2015. Downloaded by University of Pennsylvania Libraries on 12/10/2015 12:59:40.
View Article Online DOI: 10.1039/C5FD00130G
non-labeled (h) chains have to be taken into account. Sen et al. [29], Nusser et al. [30] and Genix et al.
[31] (on latex/silica systems) used ZAC method, which cancels inter and intra-chains correlations, under
unperfected matching conditions [29, 30] or in the presence of extra scattering signal coming from chain
diffusion [31]. Jouault et al. [32] have demonstrated with a random (h/d) matrix who’s matched the
silica NP the unambiguous validity of the ZAC method while also observing an unresolved extra
scattering contribution. An unambiguous contrast matched method used is also the one of Tuteja et al.
[33] with cross-linked PS particles as fillers but concerns a very specific case of PNCs filled with soft
fillers. Another contribution comes from the role played by the NP dispersion into the polymer matrix.
Despite of the general prediction proposed by Mackay et al. [27] that suggested that the particle
dispersion is only governed by the Rg/Rp ratio, it has been also demonstrated that the particle dispersion
strongly depend on the processing conditions [7, 34]. Indeed, some of the previous studies suffer from a
clear NP dispersion characterization that can render a confusing reading of the results if NPs are
aggregated or form connected network. When reducing the discussion to the specific case for which the
polymer radius of gyration is close to the NP radius, the situation is however relatively clear when most
of the experiments have concluded that the chain conformation seems to be unaffected by the NPs [27,
28, 29, 31, 32, 33]. Only two references [26, 30] show some effects that arise only at high NP loading,
up to 40%v/v. The absence of NP influence has been also confirmed recently by Crawford et al. [35] for
PNCs with uniformly dispersed NPs. The previous examples examine the possible pre-strain of the
chain induced by the NP. Another relevant contribution is to see whether the chain deformation is also
affected by the NP under non-linear (large) deformations. This point has been addressed with
simulations [36] or with indirect experiments like NMR [37]. A few experiments have probed the chain
deformation scattering signal directly in presence of NP [38-40] on model PNC. Homogeneous
overstrain has been established in triblock copolymer micelles of PI-PS-PI in cross-linked polyisoprene
(PI) matrix where no overstrain effect have been measured in uncross-linked model silica/polystyrene
PNC [40].
Faraday
Discussions
Accepted
Manuscript
Published on 10 September 2015. Downloaded by University of Pennsylvania Libraries on 12/10/2015 12:59:40.
View Article Online DOI: 10.1039/C5FD00130G
Beyond the fundamental interest of the previous studies mainly performed on model system, the
question of the chain conformation inside a composite is also a main preoccupation of industrial actors.
In the current context of petroleum resources depletion, a new challenge of the tire industry is to
develop new materials that can reduce the oil consumption well as the CO2 emission while offering high
mechanical performances (reinforcement, adhesion, tensile strength…). One possible way is to act on
the NP, for example, by changing the classical carbon black filler by silica nanoparticles. Another
possible way is to act on the rubber matrix by modifying the chain characteristics (molecular mass,
polydispersity index, chemical functions…) to play with the polymer-NP interactions. Consequently, the
question of the matrix chain conformation/deformation modification in PNC and its correlation with the
mechanical performances of the material becomes a central question that we have addressed in the
present paper.
We present here a complete study of model industrial silica/SBR systems using complementary
SAXS/SANS/TEM experiments. We have previously demonstrated [18] that the silica NP dispersion
can be controlled with coating (Octyltriethoxysilane - OCTEO) and coupling (Sulfurfunctional
organosilane bis(triethoxysilyl)propyl tetrasulfide – Si69) additives into SBR for non-cross-linked PNCs
similarly whatever the way of the sample preparation, solvent casting or internal mixing. Thanks to
covalent bonds with the chains of the matrix, the coupling agent gives rise to smaller and denser
aggregates than can form an interpenetrated percolating network when increasing the NP loading. The
coating agent has a more repulsive action that reduce the network density. In other words, it is
demonstrated that interfacial additives can tune the matrix chains confinement and appears thus to be a
relevant way, as well as the NP loading, to evaluate the effect on the chain conformation. The synthesis
of (d) labelled chain, restricted to low molecular mass, limits the capacity here to probe a broad range of
NP dispersion leads to treat the case of NP organized as clusters. We varied the type and the quantity of
interfacial additives for different NP loading from 1 to 15% vol. We applied the principle of ZAC by
mixing labelled (d) and non-labelled (h) SBR chains to extract the single chain scattering signal and see
whether or not the NP are potentially inducing some pre-straining effect on the chains. Clustering of NP
Faraday
Discussions
Accepted
Manuscript
Published on 10 September 2015. Downloaded by University of Pennsylvania Libraries on 12/10/2015 12:59:40.
View Article Online DOI: 10.1039/C5FD00130G
is evaluated from SAXS/TEM analysis. To evaluate the effect of NP on the chain deformation at large
non-linear elongation rate, we completed the study with in-situ SANS measurements on cross-linked
silica NP/SBR PNCs for different elongation rates.
II. Material and methods
II.1. Synthesis of the (d) SBR chains
d8-Styrene and d6-butadiene deuterated monomers were supplied by Cortectnet (purity of 99%) and
Eurisotop (purity of 99%), respectively. Before their use for copolymerization, the monomers were first
dried over BuLi for d6-butadiene and over calcium hydride and dibutyl magnesium for d8-styrene and
then distilled to get the purified monomers. Similarly to hydrogenated SBR copolymers in classical
runs, the deuterated SBR copolymer samples were synthesized by anionic polymerization by the
Michelin Company. The copolymerization was initiated by BuLi in cyclohexane at 50°C. Deuterated
monomers were mixed in appropriate conditions to reach a microstructure as close as possible to the one
of the hydrogenated chains used here (26%wt. of Styrene, 74%wt. of Butadiene; Mn = 40.000 g/mol,
Mw =41.700 g/mol, PDI =1.05). Two samples of deuterated SBR copolymers were obtained with the
same microstructure as the hydrogenated ones (26%wt. of Styrene, 74%wt. of Butadiene) and satisfying
enough chain mass distribution Batch 1 : Mn =49 700 g/mol ,Mw =100 500 g/mol, PDI=2.0, Batch 2 :
Mn =45 000 g/mol , Mw =96.270 g/mol , PDI=2.1). The large polydispersities (PDI ≥ 2.0) obtained for
the deuterated copolymers is due to the presence of butene derivatives impurities present in
non-negligible quantities in the supplied deuterated butadiene.
Faraday
Discussions
Accepted
Manuscript
Published on 10 September 2015. Downloaded by University of Pennsylvania Libraries on 12/10/2015 12:59:40.
View Article Online DOI: 10.1039/C5FD00130G
II. 2. Preparation of the PNCs
The matrix consists systematically in a mixture of chains from the hydrogenated and the deuterated
batches, in the appropriate volume proportions to match the silica. Considering the neutron scattering
length densities of the three components (ρSiO2 =3.41 1010 cm-2, ρh-SBR = 0.59 1010 cm-2 and ρd-SBR = 6.67
1010 cm-2), the matrix composition is fixed to 54%v. h-SBR + 46%v. d-SBR as it theoretically matches
silica. All samples were prepared by solvent casting route with Dimethylacetamide (DMAc) as solvent.
The filler is Ludox type colloidal silica supplied by Aldrich (LS-30); the size distribution of these
nanoparticles was finely characterized by SANS and gives a mean particle radius R0=7.8nm with a
log-normal distribution of 0.15.
The uncross-linked samples were synthesized with deuterated chains from Batch 1. The steps and
conditions of this synthesis - Ludox transfer from water to DMAc, dissolution of matrix, addition of
Ludox/DMAc suspension at 130°C, solvent casting under nitrogen flow at 130°C – were precisely
explained in a previous paper [18] and rigorously reproduced here for uncross-linked samples.
Dispersing agents, coating (OCTEO) and coupling (Si69) additives are in a liquid form at room
temperature. They are diluted at 7% v/v in methanol (MeOH), and this solution is then introduced in the
Ludox−DMAc suspension in the nominal quantity of 1 or 4 triethoxysilane groups per nm² of silica for
OCTEO and 1/2 or 1 triethoxysilane groups per nm² of silica for Si69. Quantities were only adapted to
both the small amount of Batch 1 and the following SANS experiment conditions (beam size).
Uncross-linked samples consist in malleable bulks of about 50mg, which can be fixed in a calibrated cell.
Cross-linked samples were synthesized with deuterated chains from Batch 2. The modifications relative
to unlinked samples are the following. Five minutes before starting the casting phase, a
cross-linking mixture is added in the polymer/silica/DMAc mixture at 130°C: soluble sulfur as cross-linker
(2%wt. with matrix) and CBS as vulcanization accelerator (2%wt. with matrix). These cross-linking
agents are fine powder under normal conditions, and their solubility was previously checked in pure
DMAc at 130°C. In the following phase, mixtures are poured into round Teflon molds (diameter =
Faraday
Discussions
Accepted
Manuscript
Published on 10 September 2015. Downloaded by University of Pennsylvania Libraries on 12/10/2015 12:59:40.
View Article Online DOI: 10.1039/C5FD00130G
50mm, thickness = 10mm) and let cast in an oven at constant temperature TCast = 130 °C under nitrogen
flow for 4 hours. During this phase both solvent casting and crosslinking are taking place. This yields
dry films of about 1mm of thickness, which do not creep at rest and under moderate traction.
Small Angles Neutron Scattering SANS
The composition of the matrix in all samples (54%v. H-SBR + 46%v. D-SBR) is supposed to reach the
Zero Average Contrast condition in SANS experiments. In this case, the scattering is directly
proportional to the form factor of a single chain. SANS measurements in ZAC condition were
performed on two spectrometers. Uncross-linked systems were measured at rest at the Laboratoire Léon
Brillouin (LLB Saclay) on the spectrometer PAXE, by varying the wavelength λ and the
sample-to-detector distance D. The three configurations defined by λ = 4Å / D = 1m, λ = 6Å / D = 5m and λ = 17Å
/ D = 5m, cover a total Q-range from 3 10-3 to 5 10-1 Å-1. Samples were measured in calibrated quartz
cells. The 2D patterns were reduced to 1D spectra I(Q) after radial averaging around the center of
scattering. Standard corrections by sample thickness, neutron beam transmission, empty cell signal
subtraction, detector efficiency, subtraction of incoherent scattering were applied to get the scattered
intensities on absolute scale. Cross-linked systems were measured at the Institue Laue Langevin (ILL
Grenoble) on the spectrometer D11. The three configurations defined by λ = 8Å / D = 1,2m, λ = 8Å / D
= 5m and λ = 8Å / D = 20m cover a total Q-range from 3 10-3 to 4 10-1 Å-1. Samples were fixed in a
home-made traction device allowing to perform measurements at fixed traction rate ζ=L/L0, ranging
from 1 (sample at rest) to 1.8. The resulting 2D SANS patterns were anisotropic and radially averaged
in 30° degree sectors along the parallel and the perpendicular direction of stretching.
Faraday
Discussions
Accepted
Manuscript
Published on 10 September 2015. Downloaded by University of Pennsylvania Libraries on 12/10/2015 12:59:40.
View Article Online DOI: 10.1039/C5FD00130G
Small Angles X-ray Scattering SAXS and Ultra Small Angles X-rays Scattering USAXS
In SAXS experiments, we measure in filled systems the silica scattering due to the electronic contrast
existing between SBR and silica: the scattering length densities are respectively ρSBR = 8.41 1010 cm-2
and ρSilica =17.36 1010 cm-2, calculated from the chemical composition, giving the electronic contrast
∆ρ=8.95 1010 cm-2. Uncross-linked systems were measured in their glass cell, at SOLEIL (Saclay) on
the beam-line SWING, with a single configuration defined by a wavelength of λ = 1.77 Å (E = 7keV)
and a sample-to-detector distances of 6.5m. As the center of scattering was not coinciding with the one
of the detector, this single configuration yield a remarkably large total Q-range from 1 10-3 to 1.6 10-1 Å
-1
, by merging two measurements with two different beam-stops (a small one and a large one). Standard
data treatments include merging, subtraction and normalization. Cross-linked systems were measured at
ESRF on the beam-line ID02, with a wavelength of 1Å (E=12,4keV) and two sample-to-detector
distances of 1 and 10 m, yielding a total Q range from 1 10-3 to 5 10-1 Å-1. On the same beam-line, the
Bonse-Hart setup allowed to reach the lower Q value of 3 10-4 Å-1. SAXS measurements were
performed exclusively at rest, after accurate measurement of the thickness of samples. Standard
treatments of data include isotropic averaging of the 2D isotropic scattering patterns, merging and
normalization. After measuring the scattering of the unfilled system, the pure silica scattering in a
nanocomposite of the silica volume fraction φSiO2, is obtained by subtracting for each sample the matrix
contribution, according to the following operation: ISiO2 = ISample – (1- φSiO2 ) x IMatrix.
Transmission Electronic Microscopy TEM
For TEM characterization, samples were cut by ultracryomicrotomy (mechanical cut) at -80°C (lower
than the glass transition temperature of SBR) at a desired thickness of about 50nm, then laid on a TEM
grid before observation. Observations were realized using a Philips CM200 LaB6 (200kV) microscope
in bright field mode.
Faraday
Discussions
Accepted
Manuscript
Published on 10 September 2015. Downloaded by University of Pennsylvania Libraries on 12/10/2015 12:59:40.
View Article Online DOI: 10.1039/C5FD00130G
III Results and Discussion
1. Chain Conformation
The scattering intensity of a single chain in a nanocomposite can be obtained directly by SANS using
the zero average contrast (ZAC) method. This method was first used for a mix of normal, i.e., non
deuterated (h) and deuterated (d) chain in a solvent: the total scattering intensity I(Q) can be expressed
by the relation [41]:
I(Q) = (ρd-ρh)²φhφdνΦNP(Q)+( φdρd+φhρh-ρ0)²[ νΦNP(Q)+VΦ²S(Q)] (1)
Where ρd, ρh and ρ0 are respectively the scattering length density of deuterated chains, hydrogenated
chains and solvent, φh, φd are the volume fractions of hydrogenated and of deuterated chains, ν is the
volume of the monomer, Φ is the volume fraction of polymer, V is the global volume, P(Q) is the form
factor of the chain, and S(Q) is the inter-chain structure factor. When the average contrast between
polymer mixture and solvent is adjusted to zero, i.e.:
φdρd+φhρh-ρ0 = 0 (2)
The scattering intensity is only related to the form factor of one chain:
I(Q) = (ρd-ρh)²φhφdνΦNP(Q) (3)
In our case, the role of the solvent is played by the silica particles. The scattering length density has
been determined by previous contrast variations experiments [42] in solvent and found to be equal to
3.41 1010 cm-2. For our system, the matching composition to satisfy equation (2) is achieved by mixing
54% v/v of hydrogenated SBR chains (SLD = 0.59 1010 cm-2) and 46% v/v of deuterated SBR chains
(SLD = 6.74 1010 cm-2). When both hydrogenated and deuterated chains have equivalent molecular
weights and when there is no interaction between the monomer, for ideals mixture, the form factor of a
single chain corresponds to a Gaussian chain in a melt whose scattering function can be described by the
Debye function [43]:
Faraday
Discussions
Accepted
Manuscript
Published on 10 September 2015. Downloaded by University of Pennsylvania Libraries on 12/10/2015 12:59:40.
View Article Online DOI: 10.1039/C5FD00130G
P(Q) = 2/(Q²Rg²)²[e-Q²Rg²-1+Q²Rg²) (4)
Where Rg is the radius of gyration of the chain. However mixtures of hydrogenated and deuterated
chains are usually not ideal and one needs to introduce a monomeric interaction parameter
(Flory-Huggins) χ. The equation (3) is extended to the random phase approximation (RPA) [44]:
V ² 2 ) Q ( P N ² 1 ) Q ( P N ² 1 ) Q ( I 1 d d d d h h h h ∆ρ χ − υ φ ρ ∆ + υ φ ρ ∆ = (5)
Where φd,h, Nd,h, νd,h, Pd,h(Q) are the volume fraction, the number of monomeric unit per chain, the
volume of monomeric unit and the form factor of the chains respectively for the hydrogenated and for
the deuterated SBR polymers. V is the average monomer volume = φhνh + φdνd. The molecular weight
determination with SEC experiments permit to extract the Nd,hνd,h product like Mwd,h = dNA Nd,hνd,h
where d is the density in g/cm3 and NA the Avogadro number. As the two monomers have the same
structure, the numbers of parameters can be simplified according to Rgd = Rgh (Mwd/Mwh)1/2.
1.1 Uncross-linked systems
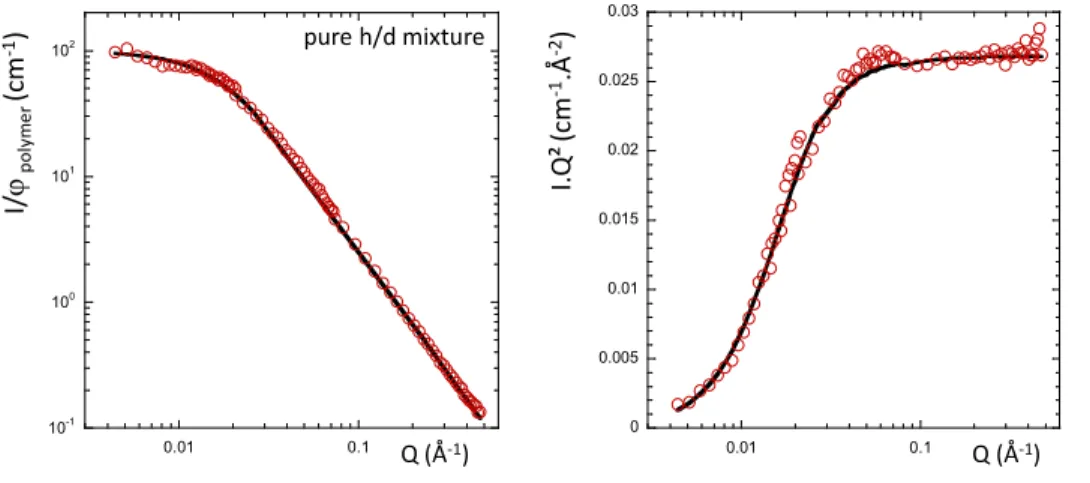
Figure 1: SANS curve the pure h/d SBR chain mixtures at the ZAC composition in log-log
representation (left) and I.Q² versus Q Kratky representation (right). The full line is the best fitted
obtained using the RPA function with the following parameters Rgh= 7.00 nm and χ=6.10-4. The error
bar on the Rg determination is ± 2%. The curves have been scaled for clarity. 10-1 100 101 102 0.01 0.1 I. Q ² (c m -1.Å -2) pure h/d mixture Q (Å-1) I/ ϕp o ly m e r (c m -1) 0 0.005 0.01 0.015 0.02 0.025 0.03 0.01 0.1 Q (Å-1)
Faraday
Discussions
Accepted
Manuscript
Published on 10 September 2015. Downloaded by University of Pennsylvania Libraries on 12/10/2015 12:59:40.
View Article Online DOI: 10.1039/C5FD00130G
The Figure 1 presents the normalized SANS curve obtained for the pure h/d SBR uncross-linked
mixture (batch 1) under the ZAC condition, without filler and additives. The curve is perfectly fitted
with the RPA function that enables to extract the following parameters with an uncertainty equal to 5%:
Rgh= 7.00 nm and χ=6 10-4. The radius of gyration of the d chains can be deduced from the molecular
masses ratio and is equal to Rgd= 8.30 nm. We consider now the situation where we added increasing
content of filler in the h/d polymer matrix first without dispersing agents. The SANS curves are
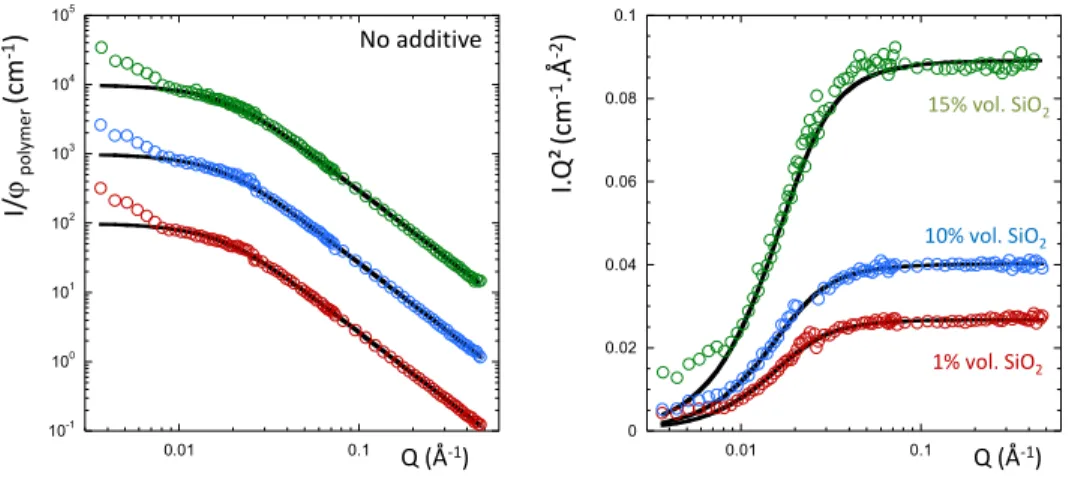
presented in Figure 2 for 1, 10 and 15% vol. of silica. We can observe that up to a Q value of 0.01 Å-1,
all the curves superimpose perfectly with the pure h/d matrix. Below this Q value, one can see an upturn
of the low Q scattering that will be discussed in details below. We performed the SANS analysis with
the RPA function (full black lines) by fixing the χ parameter to the h/d blend value and fitted the Rgh to
the height of the Kratky plateau (only one fitting parameter). The resulting fitting Rgh values are
reported in the Table 1.
Figure 2: SANS curves for the silica filled h/d SBR chain mixtures at the ZAC composition without
additives for 1% vol. (red dots), 10% vol. (blue dots) and 15% vol. of silica (green dots) in log-log (left)
and Kratky (right) representation. The full black lines are the best fitted obtained with the RPA function
(see text). The curves have been scaled for clarity.
0 0.02 0.04 0.06 0.08 0.1 0.01 0.1 10-1 100 101 102 103 104 105 0.01 0.1 Q (Å-1) Q (Å-1) I. Q ² (c m -1.Å -2) I/ ϕp o ly m e r (c m -1) No additive 1% vol. SiO2 10% vol. SiO2 15% vol. SiO2
Faraday
Discussions
Accepted
Manuscript
Published on 10 September 2015. Downloaded by University of Pennsylvania Libraries on 12/10/2015 12:59:40.
View Article Online DOI: 10.1039/C5FD00130G
We now consider the influence of the dispersing additive using the coating agent OCTEO that can
covalently bind to the surface of the silica and is known to improve the compatibility with the polymer.
The different series containing respectively 1 and 4 equivalent (1 and 4 TEOS group per nm² of silica)
of coating agent have been probed with SANS for 1, 10 and 15% vol. of silica filler (Figure 3). We
previously double-checked that the additives do not contribute to the SANS scattering by comparing the
pure h/d blend with the same blend with the same amount of OCTEO or Si69. No specific scattering
coming from the additive can be detected with SANS.
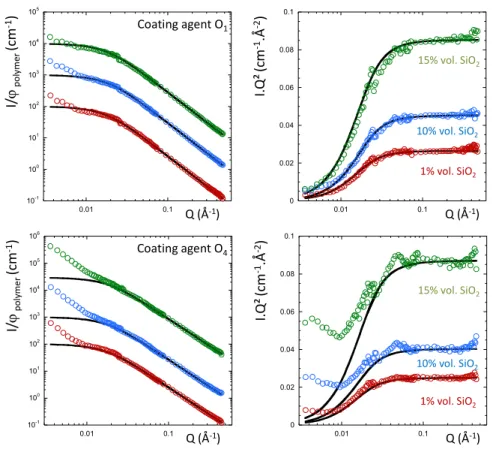
Figure 3: SANS curves for the silica filled h/d SBR chain mixtures at the ZAC composition with (top)
on equivalent of coating agent (O1) for 1% vol. (red dots), 10% vol. (blue dots) and 15% vol. of silica
(green dots), and (bottom) with 4 equivalent of coating agent (O4) for 1% vol. (red dots), 10% vol.
(blue dots) and 15% vol. of silica (green dots) in log-log (left) and Kratky (right) representations. The
black full lines are the best fitted obtained with the RPA function. The curves have been scaled for
clarity. 10-1 100 101 102 103 104 105 0.01 0.1 0 0.02 0.04 0.06 0.08 0.1 0.01 0.1 Q (Å-1) Q (Å-1) I. Q ² (c m -1.Å -2) I/ ϕp o ly m e r (c m -1) Coating agent O1 10-1 100 101 102 103 104 105 106 0.01 0.1 0 0.02 0.04 0.06 0.08 0.1 0.01 0.1 Q (Å-1) Q (Å-1) I. Q ² (c m -1.Å -2) I/ ϕp o ly m e r (c m -1) Coating agent O4 1% vol. SiO2 10% vol. SiO2 15% vol. SiO2 1% vol. SiO2 10% vol. SiO2 15% vol. SiO2
Faraday
Discussions
Accepted
Manuscript
Published on 10 September 2015. Downloaded by University of Pennsylvania Libraries on 12/10/2015 12:59:40.
View Article Online DOI: 10.1039/C5FD00130G
As for the case of silica without additive, the scatterings follow the pure blend up to 0.01 Å-1 and also
reveal an upturn for the low Q region. This effect is especially pronounced when increasing the content
of coating agent (O4) for high filler content 10 and 15% vol. of silica. This is illustrated by a decrease of
the agreement between the experimental data and the RPA calculation, which is particularly visible in
the Kratky representation.
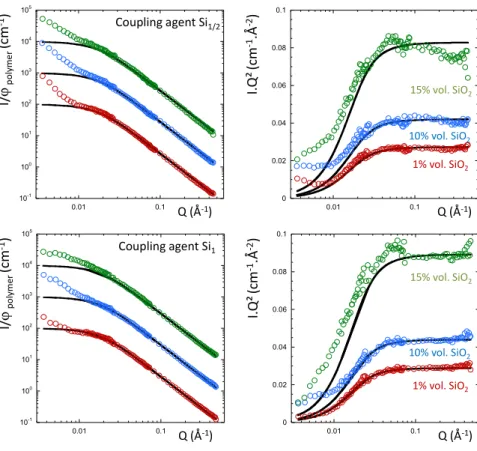
Figure 4: SANS curves for the silica filled h/d SBR chain mixtures at the ZAC composition with (top)
1/2 equivalent of coupling agent (Si1/2) for 1% vol. (red dots), 10% vol. (blue dots) and 15% vol. of
silica (green dots), and with (bottom) 1 equivalent of coupling agent (Si1) for 1% vol. (red dots), 10%
vol. (blue dots) and 15% vol. of silica (green dots) in log-log (left) and Kratky (right) representations.
The full line is the best fitted obtained with the RPA function. The curves have been shifted for clarity.
A similar trend is observed with ½ and 1 equivalent of the coupling agent Si69 that can be covalently
bonded to the particles and the polymer chains. Up to 0.01 Å-1, the scattering again follows the blend
10-1 100 101 102 103 104 105 0.01 0.1 0 0.02 0.04 0.06 0.08 0.1 0.01 0.1 Q (Å-1) Q (Å-1) I. Q ² (c m -1.Å -2) I/ ϕp o ly m e r (c m -1) Coupling agent Si1/2 10-1 100 101 102 103 104 105 0.01 0.1 0 0.02 0.04 0.06 0.08 0.1 0.01 0.1 Q (Å-1) Q (Å-1) I. Q ² (c m -1.Å -2) I/ ϕp o ly m e r (c m -1) Coupling agent Si1 1% vol. SiO2 10% vol. SiO2 15% vol. SiO2 1% vol. SiO2 10% vol. SiO2 15% vol. SiO2
Faraday
Discussions
Accepted
Manuscript
Published on 10 September 2015. Downloaded by University of Pennsylvania Libraries on 12/10/2015 12:59:40.
View Article Online DOI: 10.1039/C5FD00130G
signal but an upturn appears at low Q that disturbs the agreement between the experimental data and the
RPA calculation. We performed the RPA analysis by fixing the Flory parameter to 6 10-4 and fitted the
Rg of the h chains. Results are reported on the table 1 for the different experimental conditions.
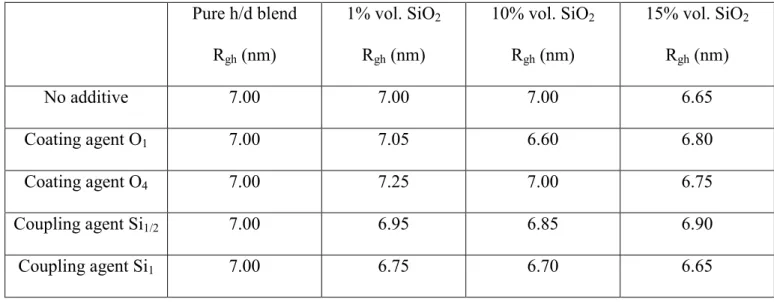
Pure h/d blend Rgh (nm) 1% vol. SiO2 Rgh (nm) 10% vol. SiO2 Rgh (nm) 15% vol. SiO2 Rgh (nm) No additive 7.00 7.00 7.00 6.65 Coating agent O1 7.00 7.05 6.60 6.80 Coating agent O4 7.00 7.25 7.00 6.75 Coupling agent Si1/2 7.00 6.95 6.85 6.90 Coupling agent Si1 7.00 6.75 6.70 6.65
Table 1: Rgh values deduced from the RPA analysis by fixing the χ to the initial blend value 6.10-4. The
uncertainty is ± 5%.
1.2 Cross-linked systems
The Figure 5 presents the SANS curves obtained with the cross-linked samples (batch 2). We can notice
that crosslinking modified the h/d blend with the appearance of a peak visible in the Kratky
representation. This peak is related to an intra-chain correlation induced by the crosslinking process.
The mean distance between two junctions in the Gaussian pathway is reduced with a resulting
modification of the chain form factor. Such a form factor has already been computed by Bastide et al.
[45]. We choose not to use this formula for the present study that is beyond the scope of the paper. In
addition, RPA is still valuable in the Guinier regime to capture the Rg values and it variations as
function of filler content, additive and elongation rates. We get the following parameters with a larger
Faraday
Discussions
Accepted
Manuscript
Published on 10 September 2015. Downloaded by University of Pennsylvania Libraries on 12/10/2015 12:59:40.
View Article Online DOI: 10.1039/C5FD00130G
uncertainty (10%) than for uncross-linked systems (2%): Rgh=6.80 nm, Rgd=10.78 nm and χ=0. The
value for the h chains is a little bit smaller than the one obtained for uncross-linked chains as expected
from the intra-chains correlation effects. For the same reason, we can see a drop of the Flory parameter.
One gets a higher value for the d chains due to the larger dispersion of the molecular masses for the
batch 2. We applied the same analysis in presence of coating and coupling agent for 1% vol. and 5 %
vol. of silica. The best fitted values of the Rgh are reported in Table 2.
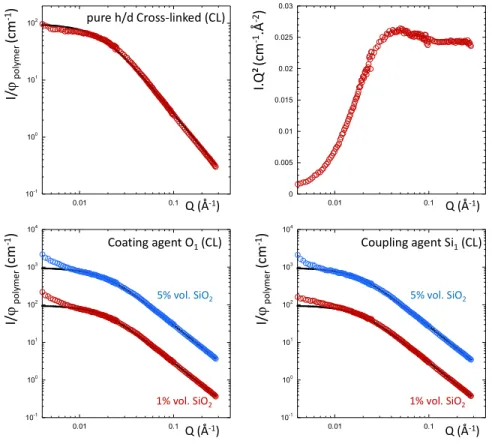
Figure 5: (top) SANS curves for the pure h/d SBR chain cross-linked (CL) mixtures at the ZAC
composition in log-log (left) and Kratky (right) representation. (bottom) SANS curves for silica filled
h/d SBR chains cross-linked (CL) composites with (left) 1 equivalent of coating agent (O1) for 1% vol.
(red dots) and 5% vol. (blue dots), and (right) 1 equivalent of coupling agent (Si1) for 1% vol. (red dots)
and 5% vol. (blue dotes) of silica. The full line is the best fitted obtained with the RPA function. The
curves have been shifted for clarity.
10-1 100 101 102 0.01 0.1 0 0.005 0.01 0.015 0.02 0.025 0.03 0.01 0.1 10-1 100 101 102 103 104 0.01 0.1 10-1 100 101 102 103 104 0.01 0.1 Q (Å-1) Q (Å-1) I/ ϕp o ly m e r (c m -1) Q (Å-1) Q (Å-1) I/ ϕp o ly m e r (c m -1) I/ ϕp o ly m e r (c m -1) I. Q ² (c m -1.Å -2) pure h/d Cross-linked (CL) Coating agent O1(CL) 1% vol. SiO2 5% vol. SiO2 Coupling agent Si1(CL) 1% vol. SiO2 5% vol. SiO2
Faraday
Discussions
Accepted
Manuscript
Published on 10 September 2015. Downloaded by University of Pennsylvania Libraries on 12/10/2015 12:59:40.
View Article Online DOI: 10.1039/C5FD00130G
Beyond the range of the error bars, one can see that at rest for ζ=1, the Rg values of the h chain in
presence of filler and additives do not seem to be different to the uncross-linked situation. That suggests
that cross-linking does not modify significantly the polymer chain conformation in nanocomposites. We
stretched the samples for different elongation rates ζ=1.3, 1.5 and 1.8 and compared the pure chain
deformation with the one in presence of silica (1% and 5% Vol.) and 1 equivalent of coating and
coupling agents. We show only two cases, the pure h/d and the coating O1 at 5% vol. of silica. The
results are reported in Figure 6 for two specific averaging directions, parallel (left) and perpendicular
(right) to the stretching direction in log-log and Kratky representations.
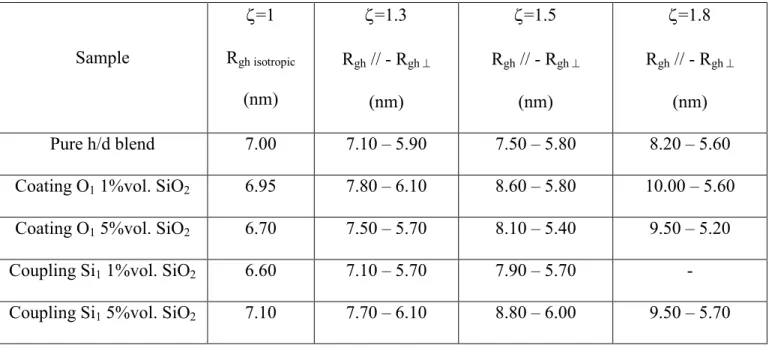
Sample ζ=1 Rgh isotropic (nm) ζ=1.3 Rgh // - Rgh ⊥ (nm) ζ=1.5 Rgh // - Rgh ⊥ (nm) ζ=1.8 Rgh // - Rgh ⊥ (nm) Pure h/d blend 7.00 7.10 – 5.90 7.50 – 5.80 8.20 – 5.60
Coating O1 1%vol. SiO2 6.95 7.80 – 6.10 8.60 – 5.80 10.00 – 5.60
Coating O1 5%vol. SiO2 6.70 7.50 – 5.70 8.10 – 5.40 9.50 – 5.20
Coupling Si1 1%vol. SiO2 6.60 7.10 – 5.70 7.90 – 5.70 -
Coupling Si1 5%vol. SiO2 7.10 7.70 – 6.10 8.80 – 6.00 9.50 – 5.70
Table 2: Rgh values deduced from the RPA analysis by fixing the χ to the initial blend value equal to 0.
The uncertainty is ±(nm) 10%.
Faraday
Discussions
Accepted
Manuscript
Published on 10 September 2015. Downloaded by University of Pennsylvania Libraries on 12/10/2015 12:59:40.
View Article Online DOI: 10.1039/C5FD00130G
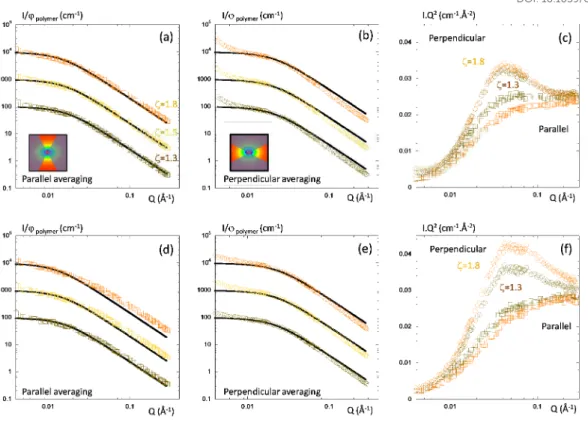
Figure 6: SANS for cross-linked stretched samples at different elongation ratio ζ=1.3 (brown), 1.5
(yellow) and 1.8 (orange), (a) pure matrix averaged in parallel direction, (b) pure matrix averaged in
perpendicular direction, (c) pure matrix average in parallel and perpendicular direction in kratky
representation, (d) Composite filled with coating agent O1 at 5% vol. of silica averaged in parallel
direction, (e) Composite filled with coating agent O1 at 5% vol. of silica averaged in perpendicular
direction, (f) Composite filled with coating agent O1 at 5% vol. of silica average in parallel and
perpendicular direction in kratky representation. The inset pictures illustrate the parallel and
perpendicular averaging of the scattering intensity. The full black lines are RPA calculation. The curves
in log-log representation have been scaled for clarity.
We applied the RPA analysis on elongated samples the same way as the non-elongated ones. The
variations of the Rgh as a function of the elongation rate are reported in Table 2. Under elongation, the
deformation is lost at large angle (loss of affinity), the chains adopted their initial configuration for
Faraday
Discussions
Accepted
Manuscript
Published on 10 September 2015. Downloaded by University of Pennsylvania Libraries on 12/10/2015 12:59:40.
View Article Online DOI: 10.1039/C5FD00130G
small distances, typically for distances smaller than the mean distance between two cross-linking
junctions.
2. Nanoparticles Assembly
We performed SAXS experiments to evaluate the NP dispersion inside the polymer blend. For x-rays
radiation the contrast is mainly between silica particles and the polymer matrix (there is no contribution
of the labelling h/d chains). The experiments have been made on the same samples prepared for SANS.
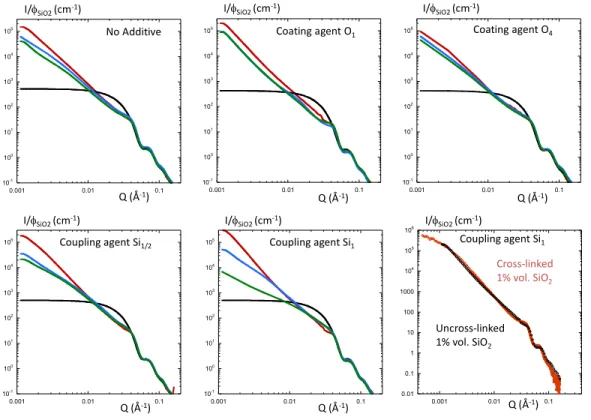
The SAXS curves are presented in Figure 7 for the different conditions (no additive, coating and
coupling agent) as function of the silica loading. For comparison, we reported the spherical form factor
of the primary particles (full black line) previously determined [18].
Figure 7: SAXS curves for the different conditions (top) no additive and coating agent (O1 and O4)
(bottom) coupling agent (Si1/2 and Si1) as function of the silica volume fraction 1% vol. (red line), 10%
vol. (blue line) and 15% vol. (green line). The black line is the form factor of the primary particles
10-1 100 101 102 103 104 105 0.001 0.01 0.1 10-1 100 101 102 103 104 105 0.001 0.01 0.1 10-1 100 101 102 103 104 105 0.001 0.01 0.1 10-1 100 101 102 103 104 105 0.001 0.01 0.1 10-1 100 101 102 103 104 105 0.001 0.01 0.1
I/φSiO2 (cm-1) I/φSiO2 (cm-1) I/φSiO2 (cm-1)
I/φSiO2 (cm-1) I/φSiO2 (cm-1)
Q (Å-1) Q (Å-1) Q (Å-1)
Q (Å-1) Q (Å-1)
No Additive Coating agent O1 Coating agent O4
Coupling agent Si1/2 Coupling agent Si1
0.01 0.1 1 10 100 1000 104 105 106 0.001 0.01 0.1 I/φSiO2 (cm-1) Q (Å-1) Coupling agent Si1 Uncross-linked 1% vol. SiO2 Cross-linked 1% vol. SiO2
Faraday
Discussions
Accepted
Manuscript
Published on 10 September 2015. Downloaded by University of Pennsylvania Libraries on 12/10/2015 12:59:40.
View Article Online DOI: 10.1039/C5FD00130G
calculated using a spherical function convoluted with a log-normal distribution with R0=7.8nm and
σ=0.15. The bottom/right plot illustrates the effect of cross-linking on the NP dispersion. The curves
have been normalized by the silica volume fraction.
We can observe a systematic increase of the low Q scattering suggesting that the primary particles are
aggregated inside the polymer matrix and are forming clusters of NPs. The slope of the decrease of the
intensity in the intermediate Q range, close to 3, indicates the formation of compact aggregates. We can
also observe a diminution of the low Q scattering level when increasing the particle volume fraction
coming from an increase of the interaction between the clusters arising when the clusters are forming a
continuous connected network as a result of a percolation process. The absence of plateau prevents the
determination of a characteristic size of the clusters. The formation of cluster seems to be systematic
and not controlled by the nature and the quantity of the additives. That can be due to the low molecular
weight of the matrix used (40k) that gives rise to a very low viscosity that cannot balanced the cluster
formation during the solvent casting process. To evaluate the influence of the crosslinking on the NP
assembly, we compared the SAXS curves for all the samples uncross-linked and cross-linked. One
example is given in Figure 7 (bottom/right). We can see that the scattering superimposed perfectly
illustrating that cross-linking do not modify the NP assembly inside the polymer matrix. We completed
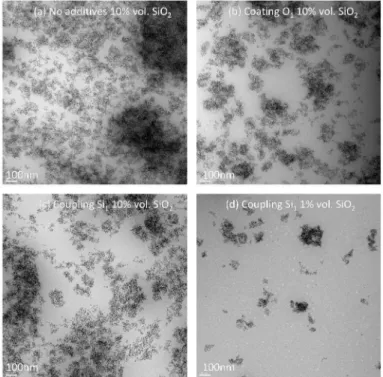
the analysis with TEM pictures presented in Figure 8. TEM pictures confirmed the formation of dense
and compact aggregates that are interacting at shorter distance when increasing the silica volume
fraction. We can see clearly the transition from individual clusters to the formation of a continuous
network visible for 10% vol. of silica. To evaluate the size of the clusters, we calculated the radially
averaged autocorrelation function C(r) using the image processing software ImageJ [46]. C(r) basically
calculates the two-point correlation of the pixels of an image, after applying a binary filter, as a function
of distance and gives information about the typical feature size in an image. The crossing line with zero
gives the cluster sizes as illustrated in Figure 8 which are respectively 170 nm and 115 nm for 1 and
10% vol. of silica which is consistent with the filler network formation.
Faraday
Discussions
Accepted
Manuscript
Published on 10 September 2015. Downloaded by University of Pennsylvania Libraries on 12/10/2015 12:59:40.
View Article Online DOI: 10.1039/C5FD00130G
Figure 8: TEM pictures for h/d blends filled with (a) no additive at 10% vol. of silica, (b) coating agent
at 10% vol. of silica, (c) coupling agent at 1% vol. of silica and (d) coating agent at 10% vol. of silica.
Figure 9: c(r) on TEM pictures for (red) coating agent O1 at 10% vol. of silica and (blue) coupling
agent Si1 at 1% vol. of silica.
Faraday
Discussions
Accepted
Manuscript
Published on 10 September 2015. Downloaded by University of Pennsylvania Libraries on 12/10/2015 12:59:40.
View Article Online DOI: 10.1039/C5FD00130G
IV Discussion
As previously shown through the different results, we can have access to the radius of gyration of the
SBR chains for uncross-linked and cross-linked filled nanocomposites at rest and under uniaxial
elongation. We can manage the NP assembly from individual clusters to a continuous filler network
with the NP loading, coating and coupling additives. We successfully used the RPA function to analyze
the SANS data with most of the time a consistent agreement between the model and the experimental
points for both uncrosslinked and crosslinked systems. However, one can observe for some situations a
discrepancy especially in Figures 3 and 4. The most probable explanation of this discrepancy is an
un-perfect matching of the silica.
Figure 10: Comparison between effective structure factor S(Q) deduced from SAXS and apparent
structure factor deduced from SANS for (top) coating agent O1 series and (bottom) coating agent O4
series. The inset is a zoom to highlight the NP-NP peak interactions.
0.1 1 10 100 1000 0.001 0.01 0.1 0.1 1 10 100 1000 0.001 0.01 0.1 0.1 1 10 100 1000 0.001 0.01 0.1 0.1 1 10 100 1000 0.001 0.01 0.1 0.1 1 10 100 1000 0.001 0.01 0.1 0.1 1 10 100 1000 0.001 0.01 0.1 0 0.5 1 1.5 2 0.01 0.1 0 0.5 1 1.5 2 0.01 0.1 S(Q) S(Q) S(Q) S(Q) S(Q) S(Q) Q (Å-1) Q (Å-1) Q (Å-1) Q (Å-1) Q (Å-1) Q (Å-1) S(Q) Q (Å-1) S(Q) Q (Å-1)
O11% vol. SiO2 O110% vol. SiO2 O115% vol. SiO2
S (q) effective
S (q) apparent
O41% vol. SiO2 O410% vol. SiO2 O415% vol. SiO2
Faraday
Discussions
Accepted
Manuscript
Published on 10 September 2015. Downloaded by University of Pennsylvania Libraries on 12/10/2015 12:59:40.
View Article Online DOI: 10.1039/C5FD00130G
This can be illustrated with the following idea: for un-perfect matching, the SANS curve will be
modified by a contribution of the NP structure factor. We thus divide the SANS scattering intensity by
the chain form factor, calculated with the RPA function, to extract an “apparent” structure factor. We
compared this apparent structure factor deduced from SANS with the “effective” NP structure factor
that can be calculated by dividing the SAXS intensity by the well-known NP form factor. The structure
factors have been determined from intensities in absolute unit and normalized by the x-rays and neutron
contrast terms. We report two examples of such comparison in Figure 10 for the two series containing 1
(top) and 4 equivalent (bottom) of coating agent. For complete silica matching, the SANS signal remain
below the SAXS as can be seen for the O1 series. However, for uncompleted silica matching, the SANS
becomes equal or even larger than the SAXS scattering. In addition, we can see the appearance of a
peak (in the inset) that corresponds exactly to the NP-NP interactions, NP in close contact inside the
cluster that is visible on both apparent and effective structure factors. There is always a low Q
contribution on the SANS scattering, beyond the size of the polymer chain, which is enhanced for
un-perfect matching of the filler. The typical size of this contribution can be evaluated approximatively
using a simple Guinier function that gives Rg=50nm and 40nm for 1% vol. and 10% vol. of silica. One
can evaluate the corresponding sphere equivalent size using the relation Rg²=3/5R² and we obtain typical
diameter of 130 nm and 105 nm for respectively 1% and 10% vol. of silica. These values are similar
whatever the additives used. The interesting feature here is that these values are close to the silica
cluster size determined from the TEM analysis in Figure 9. That means that we can see the large cluster
with SANS even if the contrast matching condition is reached. This effect can be due to specific random
adsorption of h or d chains at the surface of the particles during the sample processing. A recent study
has estimated an average grafting density of 0.01 chains/nm² corresponding to adsorbed bound layer in
similar NP-polymer systems [47]. This amount, around a 1-2 nm adsorbed monolayer, is sufficient to
modify the mean scattering neutron contrast of the cluster that makes them visible even under the ZAC
condition. An alternative explanation should be that NP induced the formation of h/d phase separation
domains of typical sizes close to the silica cluster size (Rg ∼ 30-50 nm). A rapid simulation shows us
Faraday
Discussions
Accepted
Manuscript
Published on 10 September 2015. Downloaded by University of Pennsylvania Libraries on 12/10/2015 12:59:40.
View Article Online DOI: 10.1039/C5FD00130G
that even a very low amount of the domains, typically 0.01% in volume fraction, is enough to create the
low Q additional scattering. However, due to the limited number of data in the low Q regime (5-6
points), this is difficult to going further in the quantitative analysis and to conclude clearly between the
different explanations. One way to check this idea deeply should be to anneal the sample for a longer
time at high temperature to see whether the low Q contribution is decreasing due to chains desorption or
not.
Figure 11: Reduced radius of gyration of h chains (a) uncross-linked samples as function of the silica
volume fraction, (b) for cross-linked stretched samples containing 1 equivalent of coating agent for 0, 1
and 5 % vol. of silica as function of the elongation rate and (c) for cross-linked stretched samples
containing 1 equivalent of coupling agent for 0, 1 and 5 % vol. of silica as function of the elongation
rate. The full black line is the phantom network deformation model.
The question of the low Q contribution and its influence on the determination of the polymer chain
conformation is always a critical point when considering the chain conformation in presence of filler.
Here we demonstrated that whatever the matching condition (perfect or not), the low Q contribution,
certainly related to the silica cluster, can be treated separately from the determination of the radius of
gyration of the polymer chains. As a result, we can follow the evolution of the normalized radius of
0.6 0.8 1 1.2 1.4 1.6 1.8 1 1.2 1.4 1.6 1.8 2 pure h/d para pure h/d perp
Si1 1% vol. para Si1 1% vol. perp Si1 5% vol. para Si1 5% vol. perp
phantom network para phantom network perp
0.6 0.8 1 1.2 1.4 1.6 1.8 1 1.2 1.4 1.6 1.8 2 pure h/d para pure h/d perp O1 1% vol. para O1 1% vol. perp O1 5% vol. para O1 5% vol. perp
phantom network para phantom network perp
0.8 0.85 0.9 0.95 1 1.05 1.1 1.15 1.2 0 0.05 0.1 0.15 0.2 No additives Coating O1 Coating O4 Coupling Si1/2 Coupling Si1 Reduced Rgh ϕSiO2 ζ Reduced Rgh Reduced Rgh ζ (a) (b) (c)
Faraday
Discussions
Accepted
Manuscript
Published on 10 September 2015. Downloaded by University of Pennsylvania Libraries on 12/10/2015 12:59:40.
View Article Online DOI: 10.1039/C5FD00130G
gyration of the uncross-linked h chains from the values reported in Table 1. The normalized Rgh, the
ratio between the filled and unfilled values, are reported in Figure 11a. This representation show clearly
that the polymer chain conformation at rest is not modified within a range of ±5% whatever the degree
of confinement by the filler (managed by the NP loading) and whatever the degree of interaction
between the NP and the matrix (the nature and amount of additives). This is the first conclusion of the
present study which is line with several previous conclusions on model systems [27, 28, 29, 31, 32, 33].
The cross-linking of the samples does not modify the NP assembly and the chain conformation. Then
one can directly compare the pure chain deformation with the one in presence of filler, coating (Figure
11b) and coupling agent (Figure 11c). We also computed the theoretical phantom network model
deformation [48] for a functionality f=4 for comparison. On can see that the pure polymer is less
deformed compared to the theoretical prediction especially in parallel direction. This can be due to the
chain relaxation during the deformation that can occur for low linking, namely only 3
cross-linking junction par chains. Surprisingly this effect is reduced in presence of filler for which the chain
deformation is closer to the theoretical prediction in parallel direction. Silica cluster can then act as
additional cross-linking junctions reducing the chain relaxation and then enhancing the chain
deformation. Such conclusions are of a great interest for further understanding of the macroscopic
mechanical properties of these materials.
Faraday
Discussions
Accepted
Manuscript
Published on 10 September 2015. Downloaded by University of Pennsylvania Libraries on 12/10/2015 12:59:40.
View Article Online DOI: 10.1039/C5FD00130G
V Summary and Conclusion
We report a complete study about the interplay between polymer chain conformations with NP
assembly in model industrial SBR/silica nanocomposites. By mixing d and h chains, we applied the
ZAC method with SANS that enables to extract the polymer chain form factor while matching the silica
filler contribution. SAXS/TEM permits to characterize the NP assembly as function of NP loading and
dispersing agent, coating and coupling additives. NPs are forming individual clusters at low loading that
can connect to form a continuous network at high silica loading. Using RPA analysis, we show that the
radius of gyration of the polymer chain remains unchanged – compared to the pure polymer - within a
range of ±5% whatever the crosslinking, the degree of confinement induced by NP loading and the
degree of interaction between NP and polymer balanced by the nature (coating or coupling) and the
amount of the dispersing additives. The extra scattering at low Q, that do not influenced the Rg
determination, can be attributed to NP cluster whose neutron contrast is enhanced from ZAC condition
by trapped h/d chains due to randomly chain adsorption at the surface of the NPs. Under stretching, NP
acts as additional cross-linked junction preventing the chains relaxations that are deformed of a larger
amplitude than the pure polymer.
Acknowledgments
We thank G. Baeza, A.-C. Genix and J. Oberdisse (LCC, Montpellier) for fruitful discussions. We
acknowledge S. K. Kumar (Columbia University) for critical review of this work.
Faraday
Discussions
Accepted
Manuscript
Published on 10 September 2015. Downloaded by University of Pennsylvania Libraries on 12/10/2015 12:59:40.
View Article Online DOI: 10.1039/C5FD00130G
REFERENCES
[1] Jancar, J.; Douglas, J. F.; Starr, F. W.; Kumar, S. K. ; Cassagnau, P. ; Lesser, A. J. ; Sternstein, S.
S. ; Buehler, M. J. Polymer, 2010, 51(15), 3321-3343.
[2] Tjong, S. C. Materials Science and Engineering, 2006, R 53, 73-197.
[3]Akcora, P.; Liu, H.; Kumar, S. K.; Moll, J.; Li, Y.; Benicewicz, B. C.; Schadler, L. S.; Acehan, D.;
Panagiotopoulos, A. Z.; Pryamitsyn, V.; Ganesan, V.; Ilavsky, J.; Thiyagarajan, P.; Colby, R. H.;
Douglas, J. Nat. Mater. 2009, 8, 354−359.
[4] Chevigny, C.; Jouault, N.; Dalmas, F.; Boué, F.; Jestin, J. Journal of Polymer Science Part B:
Polymer Physics, 2011, 49(11), 781-791.
[6] Sunday, D.; Ilavsky, J.; Green, D. L. Macromolecules 2012, 45, 4007−4011.
[7] Jouault, N.; Vallat, P.; Dalmas, F.; Said, S.; Jestin, J.; Boué, F. Macromolecules, 2009, 42(6),
2031-2040.
[8] Tatou, M. ; Genix, A.-C. ; Imaz, A. ; Forcada, J. ; Banc, A. ; Schweins, R. ; Grillo, I. ; Oberdisse, J.
Macromolecules, 2011, 44(22), 9029-9039.
[11] Robbes, A.-S ; Cousin, F. ; Meneau, F. ; Dalmas, F. ; Boué, F. ; Jestin, J. Macromolecules, 2011,
44 (22), 8858–8865.
[12] Klüppel, M.; Heinrich, G. Rubber Chem. Technol. 1995, 68, 623-651.
[13] Ramier, J.; Gauthier, C.; Chazeau, L.; Stelandre, L.; Guy, L. J. Polym. Sci., Part B: Polym. Phys.
2007, 45 (3), 286−298.
[14] Conzatti, L.; Costa, G.; Castellano, M.; Turturro, A.; Negroni, F.M.; Gerard, J. F. Macromol.
Mater. Eng. 2008, 293 (3), 178−187.
[15] Mele, P.; Marceau, S.; Brown, D.; de Puydt, Y.; Alberola, N. D. Polymer 2002, 43 (20),
5577−5586.
[16] Stockelhuber, K. W.; Svistkov, A. S.; Pelevin, A. G.; Heinrich, G. Macromolecules 2011, 44 (11),
4366−4381.
Faraday
Discussions
Accepted
Manuscript
Published on 10 September 2015. Downloaded by University of Pennsylvania Libraries on 12/10/2015 12:59:40.
View Article Online DOI: 10.1039/C5FD00130G
[17] Baeza, G. ; P.; Genix, A.-C.; Degrandcourt, C.; Petitjean, L.; Gummel, J.; Couty, M.; Oberdisse, J.
Macromolecules 2013, 46 (1), 317–329.
[18] Bouty, A.; Petitjean, L.; Degrandcourt, C.; Gummel, G.; Kwasniewski, P.; Meneau, F. ; Boué, F.;
Couty, M.; Jestin, J.; Macromolecules, 2014, Submitted.
[19] Termonia, Y. Polymer, 2009, 50, 1062–1066.
[20] Sung, B. J.; Chang, R.; Yethiraj, A. J. Chem. Phys., 2009, 130, 124908.
[21] Vacatello, M. Macromol. Theory Simul., 2002, 11, 757–765.
[22] Vacatello, M. Macromolecules, 2002, 35, 8191–8193.
[23] Sharaf, M. A.; Kloczkowski, A.; Sen, T. Z.; Jacob, K. I.; Mark, J. E. Eur. Polym. J., 2006, 42, 796–
806.
[24] Picu, R. C.; Ozmusul, M. S. J. Chem. Phys., 2003, 118, 11239–11248.
[25] Ozmusul, M. S.; Picu, R. C.; Sternstein, S. S.; Kumar, S. K. Macromolecules, 2005, 38, 4495.
[26] Nakatani, A. I.; Chen, W.; Schmidt, R. G.; Gordon, R. V.; Han, G. C. Polymer, 2001, 42, 3713–
3722.
[27] Mackay, M. E.; Tuteja, A.; Duxbury, P. M.; Hawker, C. J.; Van Horn, B.; Guan, Z.; Chen, G.;
Krishnan, R. S.; Science, 2006, 311,1740–1743.
[28] Botti, A.; Pyckhout-Hintzen, W.; Richter, D.; Urban, V.; Straube, E.; Kohlbrecher, J. Polymer,
2003, 44, 7505–7512.
[29] Sen, S.; Xie, Y.; Kumar, S. K.; Yang, H.; Bansal, A.; Ho, D. L.; Hall, L.; Hooper, J. B.; Schweizer,
K. S. Phys. Rev. Lett. 2007, 98, 128302.
[30] Nusser, K.; Neueder, S.; Schneider, G. J.; Meyer, M.; Pyckhout-Hintzen, W.; Willner, L.;
Radulescu, A.; Richter. D. Macromolecules 2010, 43, 98379847.
[31] Genix, A.-C. ; Tatou, M. ; Imaz, A. ; Forcada, J. ; Schweins, R. ; Grillo, I.; Oberdisse, J.
Macromolecules 2012, 45 (3), 1663–1675.
[32] Jouault, N.; Dalmas, F.; Said, S.; Di-Cola, E.; Schweins, R.; Jestin, J.; Boué, F. Macromolecules
2010, 43 (23), 9881-9891.
Faraday
Discussions
Accepted
Manuscript
Published on 10 September 2015. Downloaded by University of Pennsylvania Libraries on 12/10/2015 12:59:40.
View Article Online DOI: 10.1039/C5FD00130G
[33] A. Tuteja, P. M. Duxbury, M. E. Mackay, Phys. Rev. Lett. 2008, 100, 077801.
[34] Sen, S.; Xie, Y.; Bansal, A.; Yang, H.; Cho, K.; Schadler, L. S.; Kumar, S. K. Eur. Phys. J. Spec.
Top. 2007, 141, 161–165.
[35] Crawford, M. K.; Smalley, R. J.; Cohen, G.; Hogan, B.; Wood, B.; Kumar, S. K.; Melnichenko, Y.
B.; He, L.; Guise, W.; Hammouda. B. Phys. Rev. Lett. 2013, 110, 196001.
[36]Long, D.; Sotta, P. Macromolecules 2006, 39, 6282.
[37] Dupres, S.; Long, D.; Albouy, P. A.; Sotta, P. Macromolecules 2009, 42, 2634.
[38]Westermann, S.; Kreitschmann, M.; Pyckhout-Hintzen, W.; Richter, D.; Straube, E.; Farago, B.;
Goerigk, G. Macromolecules 1999, 32, 5793.
[39] Straube, E.; Urban, V.; Pyckhout-Hintzen, W.; Richter, D.; Glinka, C. J. Phys. Rev. Lett. 1995, 74,
4464.
[40] Jouault, N.; Dalmas, F.; Said, S.; Di Cola, E.; Schweins, R.; Jestin, J.; Boué, F. Phys. Rev. E 2010,
82, 031801.
[41] Nierlich, M.; Williams, C. E.; Boue, F.; Cotton, J.-P.; Daoud, M.; Farnoux, B.; Jannink, G.; Picot,
C.; Noan, M.; Wolff, C.; Rinaudo, M.; de Gennes, P. G. J. Phys. (Paris) 1979, 40, 701–704.
[42] Chevigny, C.; Gigmes, D.; Bertin, D.; Jestin, J.; Boué, F. Soft Matter 2009, 5 (19), 3741−3753.
[43] Higgins, J. S.; Benoit, H. Polymers and neutron scattering; Oxford University Press: New York,
1994.
[44] de Gennes, P. G. Scaling Concepts in Polymer Physics. Cornell University Press: Ithaca, NY, 1979.
[45] Bastide, J.; Herz, J.; Boué, F. J. Phys. France 1985, 46 (11), 1967-1979.
[46] Jouault, N.; Moll, J. F.; Meng, D.; Windsor, K.; Ramcharan, S.; Kearney, C.; Kumar, S.K.; ACS
Macro Lett. 2013, 2, 371−374.
[47] Jouault, N.; Lee, D.; Zhao, D.; Kumar, S.K. Advanced Materials 2014, 26 (24), 4031–4036.
[48] James, H. M.; Guth, E. The Journal of Chemical Physique 1943, 11, 455-481.
Faraday
Discussions
Accepted
Manuscript
Published on 10 September 2015. Downloaded by University of Pennsylvania Libraries on 12/10/2015 12:59:40.
View Article Online DOI: 10.1039/C5FD00130G