HAL Id: hal-01223918
https://hal.archives-ouvertes.fr/hal-01223918
Submitted on 10 Nov 2015
HAL is a multi-disciplinary open access archive for the deposit and dissemination of sci-entific research documents, whether they are pub-lished or not. The documents may come from teaching and research institutions in France or
L’archive ouverte pluridisciplinaire HAL, est destinée au dépôt et à la diffusion de documents scientifiques de niveau recherche, publiés ou non, émanant des établissements d’enseignement et de recherche français ou étrangers, des laboratoires
A quality-aware spatial data warehouse for querying
hydroecological data
Soumia Lilia Berrahou, Nathalie Lalande, Eva Serrano, Guilhem Molla, Laure
Berti-Équille, Sandro Bimonte, Sandra Bringay, Flavie Cernesson, Corinne
Grac, Dino Ienco, et al.
To cite this version:
Soumia Lilia Berrahou, Nathalie Lalande, Eva Serrano, Guilhem Molla, Laure Berti-Équille, et al.. A quality-aware spatial data warehouse for querying hydroecological data. Computers & Geosciences, Elsevier, 2015, 85 (part A), pp.126 - 135. �10.1016/j.cageo.2015.09.012�. �hal-01223918�
A quality-aware spatial data warehouse for querying
hydroecological data
L. Berrahou1, N. Lalande1, E. Serrano3, G. Molla1, L. Berti-Équille3, S. Bimonte2, S. Bringay4, F. Cernesson1, C. Grac5, D. Ienco1, F. Le Ber6,
M. Teisseire1,∗ 5
(1) TETIS, IRSTEA, AgroParisTech, F 34000 Montpellier [email protected]
∗Corresponding Author: Tel: (33) 467 548 762 - Fax: (33) 467 548 700
(2) TSCF, IRSTEA, F 63170 Aubière [email protected]
10
(3) ESPACE DEV, IRD, F 34000 Montpellier, France [email protected]
(4) LIRMM, Univ. Paul Valery, F 34000 Montpellier [email protected]
(5) LIVE - Université de Strasbourg/ENGEES, CNRS, F 67000 Strasbourg
15
(6) ICUBE - Université de Strasbourg/ENGEES, CNRS, F 67400 Illkirch [email protected]
Abstract
Addressing data quality issues in information systems remains a challenging task. Many approaches only tackle this issue at the extract, transform and load steps. Here we define a comprehensive method to gain greater insight into data quality characteristics within data warehouse. Our novel archi-tecture was implemented for an hydroecological case study where massive French watercourse sampling data are collected. The method models and makes effective use of spatial, thematic and temporal accuracy, consistency and completeness for multidimensional data in order to offer analysts a "data quality" oriented framework. The results obtained in experiments carried out on the Saône River dataset demonstrated the relevance of our approach. Keywords: Information System, Data Warehouse Modeling and Design,
20
1. Introduction
Currently, the number of available geo-referenced datasets is increas-ing with the advent of new spatial data acquisition technologies. These datasets are usually stored and managed using conventional online
trans-25
actional processing (OLTP) systems, such as spatial database management systems (SDBMS) and geographic information systems (GIS), that combined to spatial analytical tools offer effective decision-making systems. However, these systems present some important limitations when handling huge vol-umes of data, providing interactive visual analysis and executing
aggregation-30
based decisional queries. In order to handle these issues, data warehouses (DW) and online analytical processing (OLAP) systems have been developed. Indeed as detailed in [1, 2], OLTP/GIS systems are optimized for transac-tional processing (response time and managing concurrency), while OLAP systems are tuned for analytical processing (historical and online analysis).
35
Moreover, contrary to OLTP systems, which handle transactional data (ac-cess to hundreds of records), OLAP systems are conceived for analytical data (aggregation and access millions of records). OLAP systems support the decision-making process by allowing users to explore summaries (aggre-gation) of data to confirm their hypothesis or discover hidden knowledge.
40
Data warehouses and OLAP systems are widely recognized as decision support systems for the analysis of huge volumes of alphanumeric data mod-eled using a multidimensional model, which defines the concepts of facts and dimensions [1]. Facts represent the analysis subjects. They are described by numerical measures, which are analyzed at different granularities represented
45
by the hierarchy levels composing the dimensions. The analyst explores ware-housed data (cube) through OLAP operators. Integration of spatial data into data warehouses leads to spatial data warehouse (SDW) and spatial OLAP (SOLAP) concepts. SOLAP systems integrate advanced OLAP and GIS functionalities in a unique and effective framework, where the explicit
repre-50
sentation of spatial data within dimension levels allows visualization of query results within maps, and the use of topological, metrical and directional op-erators when slicing multidimensional data [3]. Integration of spatial data as measures enables aggregation of geometric properties, therefore providing a better global understanding of georeferenced phenomena.
55
For implementing actionable knowledge discovery in Environmental Sci-ence, it is worth considering that low data quality will produce unreliable results of statistical analysis and data mining techniques and therefore
con-duct to misleading conclusions in environmental assessment studies and in-appropriate decisions. In our context, we pay special attention to the quality
60
of water quality measurement data because it has an impact on the quality of the results of knowledge discovery from large quantities of water quality measurement data.
Furthermore, ensuring data quality in decision support systems is a hot research topic [4]. Indeed, data quality assessment in a multi-source context
65
must be systematically considered, especially in decision-support systems. Current studies have addressed data quality issues within extract, transform and load (ETL) processes by repairing imperfect data, and/or allowing the use of imperfect data in the OLAP system by providing ad-hoc conceptual, logical and physical multidimensional data structures and OLAP operators.
70
Some recent studies have investigated using SOLAP for environmental monitoring [5, 6]. They highlighted the interesting analysis capabilities of-fered by SDW and SOLAP technologies regarding complex environmental data, although they propose a classical SOLAP architecture where data qual-ity problems are handled in the ETL phase, while being transparent in the
75
SOLAP architecture tiers.
This paper presents a new SOLAP systems based approach to deal with complex environmental data, namely hydroecological data, in order to mon-itor the ecological status of running waters. Here, we refer to SOLAP tools as for kind of SOLAP solutions called OLAP-based [2]. In this kind of
sys-80
tems spatial data is only stored in the DW tier, and visualized by means of simply cartographic visualization. This study was carried out as part of the Fresqueau project (2011-2015) which aims at developing new methods for studying, comparing and exploiting all available parameters concerning the status of running waters as well as information describing uses and measures
85
taken. However, due to the size and complexity of the French water network, the data obtained is not of the highest quality and, since sampling costs are very high, this imperfect collected data is the only data available.
Such quality problems lead to unreliable analysis and thus reduce the data warehouse advantages. To cope with these problems, and to ensure the
90
data warehouse efficiency, we propose to integrate data quality dimensions within the warehouse, in order to refine the data analysis. We therefore developed a new method to trace data quality. Our focus on hydroecological data is particularly relevant for characterizing geospatial data quality through various dimensions such as spatial, thematic and temporal accuracy, logical
95
combines geospatial data and hydrological parameters measurements. It is designed to address the complexity of heterogeneous hydroecological data sets. Whereas previous approaches are often overly conceptual, our specific solution has already been implemented in collaboration with hydrologists
100
and continuously optimized. This solution is based on a specific quality data warehouse architecture QuiDA. Data quality concepts and indicators are taken into consideration. This step-by-step decision-making approach offers new data analysis prospects for hydroecologists.
The paper is organized as follows. Section 2 describes the aim of our study
105
and the datasets it is based on. Section 3 is a review on data warehouses and data quality issues. In Section 4, the QuiDA architecture is detailed and illustrated. Experiments on the Saône River dataset are reported in Section 5. The paper ends with a general discussion and some prospects.
2. Motivations and Datasets
110
2.1. The Fresqueau Project: Studying hydroecological Data
The aim of the Fresqueau project (2011-2015), funded by the French National Research Agency (ANR), is to develop new data mining methods for studying, comparing and making effective use of all available parameters concerning the status of running waters as well as information describing
115
uses and measures taken. More precisely, the project addresses two specific issues: (1) gaining further insight into running waters functioning through the analysis of taxons (i.e. aquatic animals or plants) which support biolog-ical indices (2) connecting the sources of pressures and the physico-chembiolog-ical and biological quality of running waters. We therefore rely on
physico-120
chemical and biological data produced by French water agencies in north-eastern (Rhine-Meuse watershed) and south-north-eastern (Rhône-Méditerranée watershed) France1.
According to the European Water Framework Directive [8], waterbodies are assessed using biological quality elements, based on macro-invertebrates,
125
oligochaeta, fishes, diatoms or macrophytes. Habitat or chemical anthro-pogenic degradations are also monitored via numerous parameters, generally
1Part of the data was downloaded from the Eau France web portal
(http://www.eaufrance.fr/), while the rest was obtained from regional environmen-tal agencies. These data were supplemented by detailed local measurements, e.g. in Alsace [7].
macropollutants and micropollutants. Therefore, numerous data on the wa-tercourse state are produced yearly from each sampling reach: (i) biological data: faunistic and floristic lists, metrics and indices, (ii) at least six
anal-130
ysis series for each macro-pollutants, (iii) one analysis of different micro-pollutants, and (iv) chemical and ecological states according the expertise of these results. The data are supplemented by data characterizing the sam-pling reaches, and data describing the hydrographic network and habitat degradations.
135
We also collected data estimating human activities (land use and build-ings) and climate and environmental forcing variables, which gave us five major categories of data: (i) data on chemical and ecological states of the watercourses, (ii) data characterizing the sampling reaches, (iii) data describ-ing the hydrographic network, (iv) data estimatdescrib-ing human activities, and (v)
140
climate and environmental forcing variables.
All of these data have spatial characteristics and they are complex to structure and to inter-connect because of their volume and nature. They are characterized by high heterogeneity due to their origin (values derived from measurements or expert assessments), their value that can be
quantita-145
tive, semiquantitative or qualitative, and their structure (point, line, surface polygon), as well as because of their temporal variability (sampling dura-tion and frequency). Furthermore, the obtained data are not of the highest quality because of the size, the complexity of the French water network, the changes in parameters and methods. Due to the cost, time and human
in-150
put required for the sampling campaigns, these imperfect collected data are the only available data. These are general problems for environmental data integrating spatial and temporal aspects from several sources with different spatiotemporal accuracy [9].
2.2. Towards an innovative data quality process
155
The aim of the Fresqueau project is to link all collected data to build a global assessment of waterbodies. We therefore proposed to design a spa-tiotemporal database and warehouse for exploring the data and to support the assessment decision process. Environmental data sets are complex, with spatial and temporal aspects, and various precision levels; they also have
160
intrinsic quality flaws. Our approach thus integrates quality processes from the modeling to the implementation step, based on domain expertise. The integration of data quality processes is currently one of the main priorities to help make appropriate decisions. Instead of evaluating the data quality
with metrics and integrating data according to cleaning rules as is usually
165
done in the ETL process, we decided to tackle data quality issues in a new data-quality aware framework.
The spatiotemporal information-system model proposed here integrates several data-quality aspects in a dedicated package. According to expert advice, the spatial, thematic, and temporal accuracy of data are supported:
170
• Spatial accuracy measures relations that may exist between objects features in order to maintain the relevant spatial relationships between them.
• Thematic accuracy describes the accuracy of the attribute values en-coded in the database. For example, values of physico-chemical
mea-175
surements do not have the same confidence if a valid quantification or detection threshold is included. The hydrological theme is integrated in our approach in order to make more relevant diagnoses of the ecological water status.
• Temporal accuracy measures the extent to which the collected data
180
remains consistent over time.
Based on these definitions of the main quality elements, let us now con-sider the decision-making context where the expert needs both a vast quantity of information over a time couse as well as accurate data to make the right decisions throughout the analysis process. In particular we consider that all
185
data, whether accurate or not must be weighted according to their quality level for each data quality dimension that is being monitored. The quality metrics are not used here for cleaning purposes before being integrated into the data warehouse. Once the dimensions are weighted, the experts can make multiple and more accurate interpretations of the analysis results depending
190
on the data quality level as as discussed hereafter.
3. Related work
Data warehousing and OLAP systems allow multidimensional online anal-ysis of huge volumes of data according to the multidimensional model which defines the concepts of facts and dimensions. The facts of a data warehouse
195
are the values of the indicators to be analyzed [10]. An example of a data warehouse is described in [11], where facts are the product sales of a company
in dollars. The following example is an excerpt from the data warehouse de-scribed below. DW facts are measurements of physico-chemical parameters over time (e.g. pH, temperature, dissolved oxygen) obtained at sample sites
200
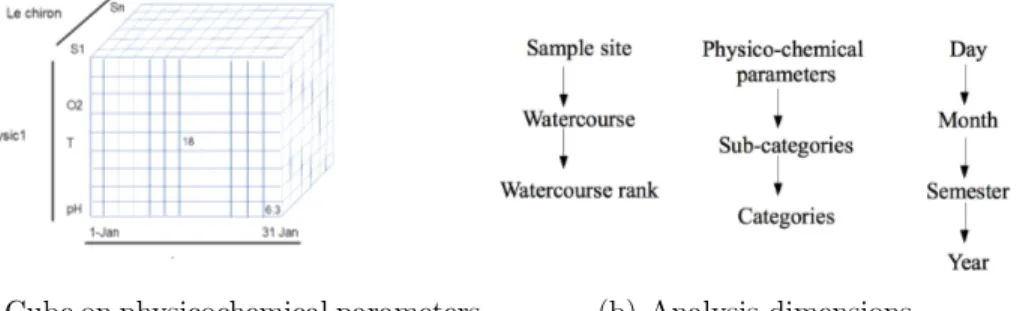
on several watercourses. In a data warehouse, an analysis is performed using an aggregation operation (e.g. sum or average) on the facts. In the example, a possible analysis is the average of measurements calculated per physico-chemical parameter, sample site and month. The results of this analysis are represented in a cube (see Figure 1(a)). Each dimension of the cube
corre-205
sponds to a analysis criterion: type of parameter, sample site and month. The cube cells are called measures which store the average measurements for each tuple <parameter, sample site, month>. For instance, in Figure 1(a), the average measurements for the tuple <pH, Site 1, December> is 6.3. In data warehouses, the analysis criteria are structured in hierarchies called
210
dimensions. Figure 1(b) shows the three dimensions, for parameters, sample sites and time. A data warehouse can produce many analyses by combining different dimension levels. For example, other cubes could be calculated:
• average measurements per watercourse, year,
• average measurements per parameter category, watercourse rank, semester,
215
etc.
Data warehouses generally support n-dimensional cubes. Data can be com-bined to provide previously unknown causal links. Data cubes are explored with OLAP operators that allow navigation within dimension hierarchies and aggregate data, and selection of a subset of warehoused data.
220
Introducing spatial data into DWs leads to a spatio-multidimensional model where measures can be geometric values and dimension levels can have geometric attributes, thus allowing cartographic visualization of SOLAP queries. A typical spatial relational OLAP (Spatial ROLAP) architecture has three tiers (Figure 2): spatial DW tier, SOLAP server tier and SOLAP
225
client tier [3]. The spatial DW tier integrates (spatial) data from multiple data sources and manages them using a spatial relational DBMS (e.g. Oracle Spatial) granting scalability and good performance. Before being loaded in the SDW, warehoused data are transformed and cleaned using ETL tools. The SOLAP server implements SOLAP operators that compute and handle
230
spatial data cubes. Finally, the SOLAP client tier provide decision-makers with interactive visual displays (crosstabs, histograms and maps) that trigger SOLAP operators and allow visualization of query results [3].
(a) Cube on physicochemical parameters (b) Analysis dimensions
Figure 1: A simple example of a data warehouse on physicochemical parameters measured in watercourses
Spatial OLAP has been successfully applied in several application do-mains such as marketing, health monitoring, agriculture, etc. [12]. Some
235
recent studies have investigated using (S)OLAP for hydrological pollutants analysis. The authors of [5] presents a multidimensional model for the anal-ysis of natural pollution risks where the pollution value is described per pollutant and group of pollutants, in the same way as [6] defines a SOLAP system for the analysis of agricultural pollutants.
240
However, in spatial and classical data warehousing systems, data quality has mainly been studied in the context of data cleaning techniques [13, 14]. The main objective is to detect and correct errors using declarative ETL operators (e.g., for detection of illegal formats and value replacement). A wide range of techniques are available for detecting and correcting specific
245
value errors, which are often dedicated to specific domains [15, 16]. In the last decade, numerous cleaning tools have been proposed in the literature and often commercialized. A comparative overview of tools and underlying techniques can be found in [17]. However, cleaning techniques cannot be used to define data quality dimensions specific to data warehousing systems
250
or to report them to users.
Only a few studies involve multidimensional modeling of data warehouse quality and focus on reporting real data quality to users. In [18], the quality of external data sources is evaluated in order to select the most appropri-ate ones. They studied and compared different methods used for building
255
the syntactic correctness ratio is one of the proposed quality metrics. In [19], the authors build multidimensional cubes to show aggregations of data warehouse quality. In [20, 21], a multidimensional data model is used for the analysis of data quality measures. The authors describe two case studies
260
based on customer relationship management (CRM) and health care data warehousing systems where the meta-model is instantiated for data quality analysis and reporting. Syntactic correctness, completeness and record in-tegrity along with other quality metrics have been defined and measured in these contexts based on the goal-question-metric (GQM) paradigm.
265
4. Quality inside the data warehouse: the QuiDA Architecture Our proposal focuses on a new architecture that fits the quality require-ments within an environmental information system. The proposed architec-ture can be used to transfer data quality indicators from input databases to the spatial data warehouse. The queries are now not only designed from,
270
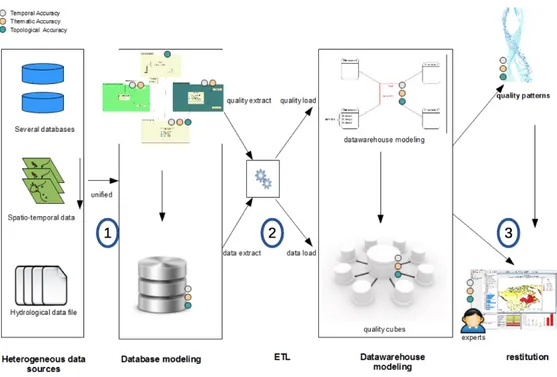
and submitted to, the different hierarchies, as is usually the case in a mul-tidimensional context, but they can also take the required data quality level into account. The details of the QuiDA architecture are illustrated in Fig-ure 2, from left to right: 1) several databases and various files are unified within an integrated database including a data quality model; 2) data and
275
quality data are extracted and loaded within quality cubes; 3) data from the warehouse can be explored with data mining methods or can be restituted to the experts with quality informations.
Firstly, we propose a modeling step completely tailored for environmen-tal purposes as it pools heterogeneous spatiotemporal data within a unified
280
model (i.e, it can reconcile data from a semantic standpoint). Once the model is unified, data can be properly structured and integrated to improve quality control in the data warehouse. Quality dimensions required by do-main experts can be monitored during this step. Secondly, we integrate the data into the spatial data warehouse without using any cleaning rules. ETL
285
processes handle data integration as well as data quality propagation within the spatial data warehouse according to aggregative rules and a weighting function. Finally, we propose a novel way to query cubes using data quality as a query filter. This allows experts to navigate within the different dimen-sion hierarchies but also within the different data quality levels according to
290
Figure 2: Data processing within QUIDA global architecture (steps 1 to 3)
4.1. Modeling and Data Integration in the Database
In the modeling step, data are compiled within different packages to con-serve their original semantics and respect the different viewpoints in the unified model. The main packages are (Figure 3):
295
1. The spatial data package links the French water system to the French administrative territorial system which is made up of Regions, Depart-ments... Each watercourse is divided into reaches so that the whole French water system forms a network on which each sample site can be referenced based on its coordinates.
300
2. The hydrobiological sampling package describes, over a time course, biological indices based on surveys of different species living within the sites.
3. The physicochemical sampling package describes, over a time course, measurements of various physicochemical parameters observed at the
sample sites.
Figure 3: Simplified data quality model: the three main packages and the quality package
The data quality package is based on spatial data quality literature [22, 23], and, in particular, the ISO 19115 standard [24], that recommends mon-itoring spatial data quality according to the topological and temporal accu-racy. The ISO 19115 standard stipulates that each measure of data quality
310
should be stored in a DQ_Result class, allowing monitoring of data quality changes over time. Data can be traced according to the different data quality elements noted as DQ_Elements classes that represent the data quality di-mensions of interest, e.g. completeness, freshness, consistency and accuracy. Furthermore, each package described in Figure 3 is tagged with data
315
quality dimensions according to the studied field. We report here on three specific dimensions focused on environmental data quality issues.
• The spatial data package can be used to monitor topological accuracy. We decided to monitor each spatial object using its coordinates to control the topological and positional accuracy.
320
• The thematic packages (the hydrobiological and physicochemical pack-ages are both tagged with the temporal and thematic labels). Business rules of the studied field are given by experts and then used to define the thematic accuracy.
• Spatial objects and measurements are interdependent and change over
325
time. The temporal quality dimension is monitored systematically in order to analyze their interdependencies correctly,
In a package, each record can be traced using a data quality threshold. Later, the record is given a weight between 0 and 1 according to its corresponding threshold within the process of integration into the quality-aware data
ware-330
house. It is clearly mentioned here that this weight is only used as a quality indicator in order to build a kind of quality, i.e., for each data item on the different quality dimensions.
4.2. Quality Cube
The Fact table provides the parameter values according to the different
335
dimension hierarchies. There are three main dimensions surrounding the Fact table (see Figure 4).
• Spatial Dimension: the hierarchies are based on the French water sys-tem network, a sample site belongs to a watercourse, which in turn belongs to a watercourse rank. Sample sites are weighted according to
340
topological accuracy;
• Temporal Dimension: Each sample is time stamped with the day, month, and year. The hierarchies on the temporal dimension are structed according to the different analyses over the time course con-sidered by the experts;
345
• Parameter Dimension: This refers to the thematic classification of the different physicochemical parameters in the hydrological field.
Other spatial and thematic dimensions have been developed, e.g. the admin-istrative dimension (a sample station is located in a town or village territory,
which is included in a department, etc.). Each record in the Fact table can be
350
queried on various dimensions of the cube to be spatiotemporally analyzed. The value is weighted with the three quality dimensions and the quality weight is considered as a measure directly recorded in the Fact table.
Figure 4: Spatial quality data warehouse star schema: a measure is a tuple <parameter, unit, value, date, sample site>
The quality indicators, namely the temporal, topological and thematic quality weights are computed by functions weighting and combining several
355
logical and domain-dependent constraints for consistency and completeness checking. More specifically, temporal accuracy constraints will check if the date and time of the measurement data are non null values and if they are valid, e.g., not during the week-end or national day or in the middle of the night. As illustrative examples, temporal accuracy of a measurement value
360
on (date=14JULY2014, time=NULL) equals 0, whereas the temporal accu-racy of (date=1SEPT2014, time=12am) is 0.5. The thematic dimension of data quality is evaluated with respect to a set of domain-specific constraints checking the consistency of multiple physicochemical parameters of the mea-surement. For instance, the percentage of O2 saturation should satisfy the 365
following equation:
SaturationPerc(O2) = (O2× 100)/
(14.631(0.4112 × T ) +(0.008536 × T2) + (0.00009 × T3))
with T , the water temperature. Various rules have been defined by the domain experts to check the consistency and detect outlying measurement values.
Topological accuracy is computed as the distance between the
consid-370
ered measurement point and the French water network reference, BD Topo2.
Topological accuracy is proportional to the distance and corresponds to one of the following levels: High topological accuracy in [.75,1] represented by a green cell for less than 1 meter apart from the reference network; medium high for topological accuracy in [.5,.75] represented in yellow when the
dis-375
tance is between 1 and 10 meters; medium low for topological accuracy in [.25,.5] represented in orange when the distance is between 10 and 50 meters and low topological accuracy in [0,.25] represented in red when the distance is beyond 50 meters. This indicates if the measuring point does coincide spatially with a river stretch.
380
As an example regarding the topological accuracy, the value of a param-eter recorded in the Fact table is related to a sample site. If this site has a low topological accuracy level in the water network, it directly impacts the parameter measurement used for the spatial analysis. Indeed, experts attempt to discover how sample sites are interconnected to each others
ac-385
cording to the different parameter measurements. The spatial impact that a site can have on another one can only be correctly revealed if its topological accuracy is as precise as possible. Our approach allows experts to consider this viewpoint and analyze data more accurately.
Moreover, experts might be interested in obtaining a better level of
topo-390
logical accuracy in order to gather information that will help them reveal such impacts between different sites. The approach allows them to query data according to a better topological accuracy level when rolling up on the hierarchy, at various aggregation level. The topological weight is used here as a filter when querying the data cube. Other examples are given in the
395
following section.
5. Results
The global architecture was entirely deployed in an open-source tech-nology using PostgreSQL DBMS which is perfectly suited for spatial data, and the Mondrian server to query the cubes. The current cube focuses on
400
physicochemical data. Its size is about 4 Go.
Experiments were performed on a set of 49 sample sites from the Fresqueau dataset. 712 samples from these 49 sites were integrated within the spatial
quality data warehouse in order to foster discussion on our results. Those samples concern 4517 physicochemical measurements obtained at different
405
dates and for different physicochemical parameters. These parameters are divided into two sections according to their role:
• Evaluation of the chemical state based on micropollutants: atrazine, nitrates, diuron, mercury, cadmium, trichlorethylene;
• Evaluation of the physicochemical state based on macropollutants: NH+ 4, 410
NO−2, NO−3, PO3−4 , total phosphorus, pH, dissolved oxygen (DO), dis-solved oxygen percent saturation, biological oxygen demand (BOD5).
The first example aims to show how data quality weights can help decide which section of a watercourse has to be inspected. Table 1 gives an overview of such data. The section of the watercourse under study is located in an
section information watershed name Saône waterbody name Ruisseau la Colombine
main Stream Rhône linear length studied 11 km station number 10 studied parameter Nitrates
Table 1: A spatial case study
415
agricultural environment where there is intensive chemical fertilizers use. We tried to determine the possible impact of nitrate pollution in an upstream section of the waterbody according to the results of the different stations monitored. Each station reveals the state of a section. If nitrates measured at a station reveal an abnormal increase, the monitoring network could decide
420
to inspect the section upstream in order to understand the causes. Since these inspections are very costly, it is important to know the topological accuracy along the water network in order to make the right decision concerning the choice of section to be inspected.
In traditional data warehouses, when asking for the nitrate parameter
425
values according to the spatial dimension, the conventional Figure 5 is ob-tained: nitrates show different possible impacts from upstream stations, but it is hard to make any relevant decision other than to inspect the nearest upstream station, with the high risk of having to reconduct another costly inspection. In the spatial quality data warehouse, we can differently
ana-430
Figure 5: Cube without quality weights
is given in Figure 6 with colored cells used to facilitate the analysis. The thematic weight shows that nitrate concentrations for each station of the studied waterbody belongs to the valid threshold.
In the following, other examples of quality weight queries and results
435
are given. In Figure 7, the expert is looking for a spatial trend at different stations based on a parameter measurement (“What are the stations with a topological weight above 0.75 for the Atrazine parameter results?”). The quality data warehouse can be used to query the spatial data accuracy and strengthen the robustness of the analysis. The analysis remains robust even
440
if, as in this case, the temporal accuracy is not high.
Figure 7: Filters on the topological weight. Question: “What are the stations with a topological weight above 0.75 for the Atrazine parameter results?”
Now (Figure 8), if the expert is interested in showing a temporal rather than spatial trend in the data and no longer over space, he/she can query in the same way the quality data warehouse by using the temporal weight filter: “What are the years for which the dissolved oxygen results are related to a
445
temporal weight above 0.75?”. And lastly (Figure 9), spatiotemporal trend may be highlighted using topological and temporal weights: “What are the stations for which the topological and temporal weight is above 0.75 for the nitrate parameter results?”.
Figure 8: Filters on the temporal weight. Question: “What are the years for which the dissolved oxygen results are related to a temporal weight above 0.75?”
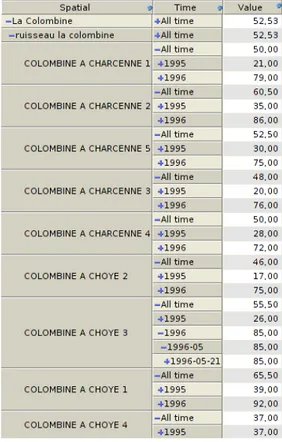
We can also request results according to the different hierarchies and
450
Figure 9: Filters on topological and temporal weights. Question: “What are the stations for which the topological and temporal weight is above 0.75 for the nitrate parameter results?”
data warehouse “What are the quality weights for the nitrate results on the different hierarchies of the spatial dimension ?” (Figure 10).
Figure 10: Accuracy trends in hierarchies. Question: “What are the quality weights for the nitrate results on the different spatial dimension hierarchies?”
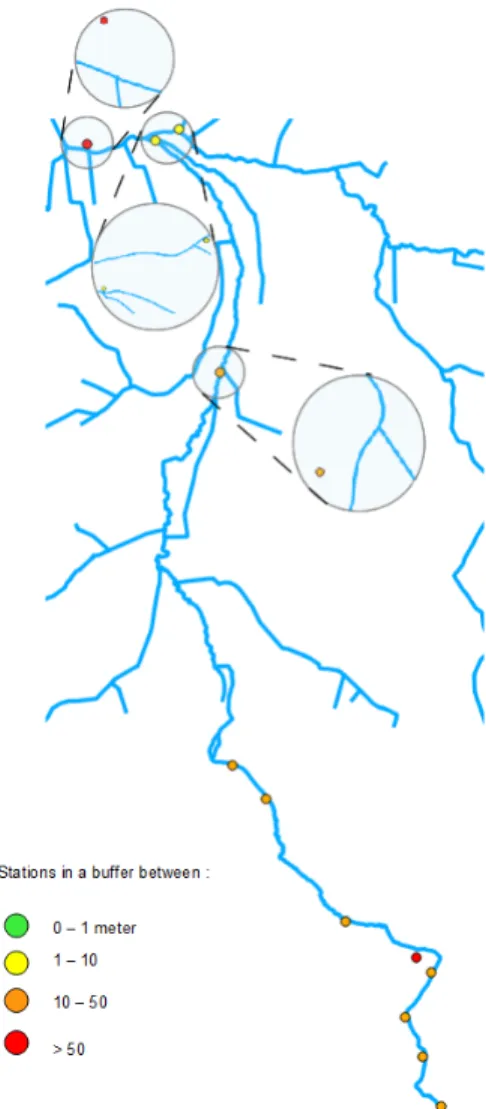
In the following, we show the advantages of the spatial quality data ware-house using the topological accuracy weight. Figure 11(a) shows the
distri-455
bution of different stations from which we extracted the set to be monitored. The colors in Figure 11(a) and 11(b) represent the spatial restitution of the topological accuracy according to the defined thresholds in the watersheds
(a) Set of stations (b) Topological thresholds Figure 11: Topological accuracy restitution
as: Green stations in a buffer between the perfect intersection and 1m; Yel-low between 1 and 10 m; Orange between 10 and 50 m and Red beyond 50 m.
460
The specific color code explains the data reliability and helps decisionmakers for quick analysis.
The topological weight highlights different levels of accuracy in the station locations. The topological weight here is really helpful because it clearly shows the difficult choices of section to be inspected since one of the stations
465
is colored in red. Indeed, in Figure 12, the spatial restitution circles different cases where it is hard to choose which sections of river to inspect. The red case at the top of the figure emphasizes three potential sections of river to be inspected. This allows the operator to decide either to to conduct further investigation at that position or to inspect an upstream section with a better
470
topological weight.
6. Discussion and Conclusion
Here we have described a novel approach to address data quality issues in the environmental application framework. The originality of this approach
resides in the fact it uses data quality, not for cleaning, but rather for
query-475
ing data according to their quality level. First, we described the QuiDA architecture to transfer these data quality indicators from the database to the data warehouse. Second, we paid particular attention to the modeling and integration steps according to the data quality dimensions and defined the quality weights as authentic data indicators. Third, we monitored the
480
data quality weights for each record in the data warehouse fact table. And lastly, we implemented our approach on a large dataset concerning French running waters and conducted multiple data warehouse queries using these quality indicators as data cube filters.
Our approach assumes that all data are integrated even though they have
485
a low quality level. As long as it is possible to define and measure the data quality with the indicators, then all the data may be used in a decision-making context. This information is directly entered as a measurement in the fact table for each record and according to different quality dimensions. However, we could have analyzed data quality within the data warehouse in a
490
different manner. A discrete data quality dimension could have been added, with three or more data quality levels, e.g. imprecise, precise and confident levels.
In our model, the aggregative rules to roll-up or drill-down regarding the quality dimension could not be consistently defined because these hierarchies
495
are not present in our data structures. Moreover, each quality dimension has its own quality level definition, so it was impossible to consider them all within the same dimension. The only way to transfer the data quality and compare different queries on cubes is to directly measure quality weights in the Fact table. Indeed, beyond the data quality reporting discussed
previ-500
ously, experts need to discover relevant rules between the physicochemical parameters and the biological measures in order to better assess the quality of hydroecosystems.
To the best of our knowledge, this is the first study to develop a global solution that considers the data quality level inside the system in the
hy-505
droecological field. By proposing this solution, we aim to facilitate the spa-tiotemporal analysis and help to define efficient and reliable conclusions on data that are often scare and imprecise. The principles of our solution can thus be widely adapted to environmental issues, e.g. in the agriculture do-main to spatiotemporally monitor agricultural practices and their measured
510
impacts on ecological processes. Furthermore, we could improve our model and develop a procedure designed to recommend accuracy weights (or part
of them) to experts. This step could shorten time-consuming activities for analysts. Finally, starting from the last layer of our architecture, we could propagate and integrate the data quality concept into a further data-mining
515
step, as considered in the Fresqueau project (e.g. [25, 26]). Acknowledgements
This work was funded by the French National Research Agency (ANR_11 MONU 14 Fresqueau).
References
520
[1] R. Kimball, The Data Warehouse Toolkit: Practical Techniques for Building Dimensional Data Warehouses, John Wiley & Sons, New York, 1996, 374 p.
[2] Y. Bédard, T. Merrett, J. Han, Fundamentals of spatial data warehous-ing for geographic knowledge discovery, Geographic data minwarehous-ing and
525
knowledge discovery 2 (2001) 53–73.
[3] S. Bimonte, M. Miquel, When Spatial Analysis Meets OLAP: Multidi-mensional Model and Operators, International Journal of Data Ware-housing and Mining 6 (4) (2010) 33–60.
[4] B. Laure, C.-W. Isabelle, C. Mireille, K. Zoubida, N. Sylvaine,
530
P. Veronika, C. S. SiSad, T.-G. Virginie, Assessment and analysis of information quality: a multidimensional model and case studies, Inter-national Journal of Information Quality 2 (4) (2011) 300–323.
[5] A. Alexandru, G. Gorghiu, C. L. Nicolescu, C.-A. Alexandru, Using OLAP Systems to Manage Environmental Risks in Dambovita County,
535
Bulletin UASVM Horticulture.
[6] F. Vernier, A. Miralles, F. Pinet, N. Carluer, V. Gouy, G. Molla, K. Pe-tit, EIS Pesticides: An environmental information system to character-ize agricultural activities and calculate agro-environmental indicators at embedded watershed scales, Agricultural Systems 122 (2013) 11–21.
540
[7] C. Grac, A. Braud, F. Le Ber, M. Trémolières, Un système d’information pour le suivi et l’évaluation de la qualité des cours d’eau – Application à l’hydro-écorégion de la plaine d’Alsace, RSTI - Ingénierie des Systèmes d’Information 16 (2011) 9–30.
[8] The European Parliament and the Council, Framework for Community
545
action in the field of water policy, Directive 2000/60/EC (23 October 2000).
[9] C. Suteanul, A Scale-Space Information Flux Approach to Natural Ir-regular Patterns: Methods and Applications, Journal of Environmental Informatics 16 (2) (2010) 57–69.
550
[10] E. Malinowski, E. Zimanyi, Advanced Data Warehouse Design: From Conventional to Spatial and Temporal Applications, Springer, 2008, 435 p.
[11] J.-N. Mazón, J. Trujillo, An MDA approach for the development of data warehouses, Decision Support Systems 45 (1) (2008) 41–58.
555
[12] S. Nilakanta, K. Scheibe, A. Rai, Dimensional issues in agricultural data warehouse designs, Computers and Electronics in Agriculture 60 (3) (2008) 263–278.
[13] M. Bouzeghoub, Z. Kedad, Quality in Data Warehousing, in: Informa-tion and Database Quality, 2002, pp. 163–198.
560
[14] M. Jarke, M. A. Jeusfeld, C. Quix, P. Vassiliadis, Architecture and Qual-ity in Data Warehouses: An Extended Repository Approach, Inf. Syst. 24 (3) (1999) 229–253.
[15] E. Rahm, H. H. Do, Data Cleaning: Problems and Current Approaches, IEEE Data Eng. Bull. 23 (4) (2000) 3–13.
565
[16] M. L. Lee, H. Lu, T. W. Ling, Y. T. Ko, Cleansing data for mining and warehousing, in: Database and Expert Systems Applications. 10th International Conference, DEXA’99 Florence, Italy, Vol. LNCS 1677, 1999, pp. 751–760.
[17] H. Muller, J. Freytag, Problems, Methods, and Challenges in
Compre-570
hensive Data Cleansing, Tech. Rep. HUB-IB-164, Humboldt University Berlin, Germany (2003).
[18] Y. Zhu, A. Buchmann, Evaluating and Selecting Web Sources as Exter-nal Information Resources of a Data Warehouse, in: 3rd InternatioExter-nal Conference on Web Information Systems Engineering (WISE), 2002, pp.
575
[19] G. C. M. Amaral, M. L. M. Campos, AQUAWARE: A Data Quality Support Environment for Data Warehousing, in: SBBD, 2004, pp. 121– 133.
[20] L. Berti-Equille, I. Comyn-Wattiau, M. Cosquer, Z. Kedad, S. Nugier,
580
V. Peralta, S. S.-S. Cherfi, V. Thion-Goasdoué, Assessment and analysis of information quality: a multidimensional model and case studies, IJIQ 2 (4) (2011) 300–323.
[21] V. Peralta, V. Thion-Goasdoué, Z. Kedad, L. Berti-Equille, I. Comyn-Wattiau, S. Nugier, S. Si-Said Cherfi, Multidimensional Management
585
and Analysis of Quality Measures for CRM Applications in an Electricity Company, in: ICIQ, 2009, pp. 202–215.
[22] S. C. Guptill, Fundamentals of Spatial Data Quality, Transaction in GIS 12 (1) (2008) 161–162.
[23] V. Parmar, P. Goyal, Analysis On Axioms Of Spatial Data Quality, in:
590
IJCA Proceedings on National Workshop-Cum-Conference on Recent Trends in Mathematics and Computing 2011, Vol. RTMC 1, 2012. [24] D. Danko, ISO 19115 Geographic Information - Metadata, ISO/TC211
Geographic information/Geomatics, Tech. rep., ISO (2000).
[25] A. Bertaux, F. Le Ber, A. Braud, M. Trémolières, Identifying ecological
595
traits: a concrete fca-based approach, in: S. Ferré, S. Rudolph (Eds.), 7th International Conference on Formal Concept Analysis, ICFCA 2009, Darmstadt, LNAI 5548, Springer-Verlag, 2009, pp. 224–236.
[26] M. Fabrègue, A. Braud, S. Bringay, F. Le Ber, M. Teisseire, OrderSpan: Mining Closed Partially Ordered Patterns, in: The Twelfth International
600
Symposium on Intelligent Data Analysis (IDA 2013), London, United Kingdom, Vol. LNCS 8207, Springer, 2013, pp. 186–197.