Protein Composition under Sulfur De
ficiency
1[OPEN]
Titouan Bonnot,
a,2Pierre Martre,
a,3Victor Hatte,
aMireille Dardevet,
a,4Philippe Leroy,
a,4Camille Bénard,
b,4Natalia Falagán,
b,4Marie-Laure Martin-Magniette ,
d,eCatherine Deborde,
bAnnick Moing,
bYves Gibon,
bMarie Pailloux,
cEmmanuelle Bancel ,
aand Catherine Ravel
a,5,6a
Genetics Diversity and Ecophysiology of Cereals, Institut National de l’Agriculture, de l’Alimentation et de
l’Environnement (INRAE), Université Clermont-Auvergne, 63000 Clermont-Ferrand, France
b
Biologie du Fruit et Pathologie, INRAE, Université de Bordeaux, Plateforme Métabolome Bordeaux,
MetaboHUB-PHENOME, 33140 Villenave d’Ornon, France
c
Laboratoire d’Informatique, de Modélisation et d’Optimisation des Systèmes, Centre National de la Recherche
Scientifique (CNRS), Université Clermont-Auvergne, 63000 Clermont-Ferrand, France
d
L’Institut des Sciences des Plantes (IPS2), CNRS, INRAE, Université Paris-Sud, Université Evry, Université
Paris-Saclay, 91400 Orsay, France
e
Mathématiques et informatique appliqués (MIA)-Paris, AgroParisTech, INRAE, Université Paris-Saclay, 75231
Paris, France
ORCID IDs: 0000-0001-9560-535X (T.B.); 0000-0002-7419-6558 (P.M.); 0000-0002-7672-9565 (N.F.); 0000-0003-4000-9600 (M.-L.M.-M.); 0000-0001-5687-9059 (C.D.); 0000-0003-1144-3600 (A.M.); 0000-0002-4311-9269 (M.P.).
Understanding the molecular mechanisms controlling the accumulation of grain storage proteins in response to nitrogen (N) and
sulfur (S) nutrition is essential to improve cereal grain nutritional and functional properties. Here, we studied the grain
transcriptome and metabolome responses to postanthesis N and S supply for the diploid wheat einkorn (Triticum monococcum).
During grain
filling, 848 transcripts and 24 metabolites were differentially accumulated in response to N and S availability.
The accumulation of total free amino acids per grain and the expression levels of 241 genes showed significant modifications
during most of the grain
filling period and were upregulated in response to S deficiency. Among them, 24 transcripts strongly
responded to S deficiency and were identified in coexpression network analyses as potential coordinators of the grain response
to N and S supply. Sulfate transporters and genes involved in sulfate and Met metabolism were upregulated, suggesting
regulation of the pool of free amino acids and of the grain N-to-S ratio. Several genes highlighted in this study might limit
the impact of S deficiency on the accumulation of grain storage proteins.
Improvement of the grain yield potential of wheat
(Triticum monococcum), the main staple crop in many
regions of the world (Shiferaw et al., 2013), is needed to
ensure food security. In this context, grain end-use
value must be controlled, as it is primarily
deter-mined by protein concentration, which shows a strong
genetic antagonism with grain yield (Bogard et al.,
2010; Aguirrezábal et al., 2015). The grain storage
pro-teins (GSPs) account for 60% to 80% of the total protein
in mature grains, and their relative amount determines
the end-use value for food processing (Shewry and
Halford, 2002). Therefore, understanding the
molecu-lar mechanisms that regulate GSP synthesis is essential.
The main GSP fractions in wheat grains are gliadins
and glutenins, which confer the rheological properties
of dough during the bread-making process (Branlard
et al., 2001). GSPs are commonly categorized as sulfur
(S)-rich (a/b-gliadins, g-gliadins, and low molecular
weight glutenin [LMW-GS]), and S-poor (v1,2-gliadins,
v5-gliadins, and high molecular weight glutenins
[HMW-GS]) GSPs according to Shewry et al. (2001).
During S deficiency, the quantity of S-containing amino
acids (Cys and Met) in mature wheat grains is
de-creased (Wrigley et al., 1980), resulting in a decrease in
the amount of S-rich GSPs, which is compensated by an
increase in the amount of S-poor GSPs (Zhao et al., 1999;
Wieser et al., 2004; Zörb et al., 2010). High levels of
nitrogen (N) supply increase the concentration of GSPs
(Pechanek et al., 1997; Triboï et al., 2003; Chope et al.,
2014). However, an excessive N supply leads to a high
N-to-S ratio and results similar to those obtained in
S-deficient conditions (Wieser and Seilmeier, 1998; Zörb
et al., 2010). Therefore, the availability of both N and S in
soils plays a major role in controlling GSP composition
and grain N-to-S ratio, which generally varies from 12:1 to
25:1 (Randall et al., 1981). The effect of N and S supplies on
GSP composition in mature grains can be explained by
changes in their rate and duration of accumulation during
grain
filling (Dai et al., 2015; Bonnot et al., 2017).
In cereals, changes in GSP composition in response to
nutrient availability result from alterations in
trans-porters and metabolism. For instance, an increase in
the accumulation of free Asn is observed in response to
S deprivation (Granvogl et al., 2007) and is partly
Ò, June 2020, Vol. 183, pp. 501–516, www.plantphysiol.org Ó 2020 American Society of Plant Biologists. All Rights Reserved.
explained by an upregulation of Asn synthetases ASN1
and ASN2 during grain development (Gao et al., 2016;
Postles et al., 2016). In Arabidopsis (Arabidopsis thaliana),
several metabolic changes happen in S-deprivation
con-ditions (Nikiforova et al., 2005) and the transcriptional
regulator SULFUR LIMITATION1 (SLIM1) plays a
cen-tral role in controlling both the activation of sulfate
ac-quisition and the degradation of glucosinolates under
S starvation (Maruyama-Nakashita et al., 2006, 2008).
SLIM1 also regulates miR395, which is induced under
low S supply (Kawashima et al., 2009), and epigenetic
regulation plays a role in the response to nutrient
defi-ciencies via the action of microRNAs (Liang et al., 2015;
Paul et al., 2015; Sirohi et al., 2016). In the Brassicaceae
family, the SULFUR DEFICIENCY INDUCED1 (SDI1)
gene inhibits glucosinolate biosynthesis under S
defi-ciency, leading to the prioritization of sulfate utilization
for primary metabolites (Aarabi et al., 2016).
Plants have strategies to adjust their metabolism and
maintain proper development in response to nutrient
imbalance; however, the underlying molecular
mech-anisms remain poorly understood. In a previous article,
we studied the responses of GSPs, nuclear proteomes,
and albumin-globulin proteomes in einkorn (Triticum
monococcum) grains in response to N and S supply
(Bonnot et al., 2017). The objective of this work was to
analyze the grain transcriptome and metabolome under
the same four previously applied nutritional treatments
at different time points during grain development,
with the objective of identifying regulatory
mecha-nisms that may control grain composition under S and
N availability/unavailability. We hypothesized that an
imbalance of the grain N-to-S ratio results in activation
of mechanisms involved in responses to nutritional
deficiencies. We assumed that genes acting in these
processes and strongly upregulated during grain
filling
might be important regulators of grain composition
and thus play roles in maintaining grain quality under
N- and/or S-deficient conditions. Our results reveal a
putative mechanism of S-deficiency response caused by
an increase in the grain N-to-S ratio. This mechanism
includes genes acting in sulfate transport and amino
acid and S metabolism, which function to adjust the
amino acid pool in grains.
RESULTS
Transcriptome and Metabolome Changes Highlight the
Importance of S in the Grain Response to N Supply
This part of the study focused on the transcriptome
and metabolome responses of developing einkorn
grains to N and S supply. Four treatments were applied
to einkorn plants from 200°Cd after anthesis to grain
maturity: N2S2, N1S2, N2S1, and N1S1,
accord-ing to whether N and/or S was applied (Fig. 1A).
Ein-korn plants were grown in a greenhouse with a spatial
arrangement similar to
field conditions. To analyze the
transcriptome, RNA sequencing (RNA-Seq) was
per-formed on grain samples from 300°Cd to 600°Cd after
anthesis (Supplemental Table S1). For differential
ex-pression analysis, 12,327 expressed genes were
con-sidered. Our metabolome analysis comprised the
quantification of 33 metabolites and compounds during
the effective grain
filling and maturation periods (from
300°Cd to 950°Cd after anthesis), including 11 amino
acids,
five soluble sugars, five organic acids, starch, and
the S-containing tripeptide glutathione (Supplemental Fig.
S1; Supplemental Table S1). Statistical analyses revealed a
significant effect (false discovery rate [FDR] , 0.05) of the
treatments on the accumulation of 848 transcripts and 24
metabolites (Fig. 1B; Supplemental Fig. S2; Supplemental
Table S2). Grain development showed significant effects in
9,653 transcripts and 30 metabolites; the accumulation of
131 transcripts and 15 metabolites was significantly
af-fected by treatments, grain development, and
interac-tion between the two factors (Fig. 1B). In this study, we
focused on all metabolites and transcripts differentially
accumulated in response to N and S treatments (24 and
848, respectively). We integrated our transcriptomic and
metabolomic data obtained from 300°Cd to 600°Cd after
anthesis to analyze the effects of the N and S treatments on
grain metabolism during the effective grain-filling period.
Based on data from the 848 transcripts and 24
me-tabolites, we
first assessed the overall effect of the N and
S treatments on their accumulation profile (Fig. 1C).
Whereas all treatments were grouped at 300°Cd after
anthesis, the N1S2 treatment showed a distinct effect
from 400°Cd after anthesis (Fig. 1C). Consistent with
this observation, principal component analysis (PCA)
separated the grain developmental stages on the
first
1This work was supported by the French Ministry for Higher
Education and Research (PhD grant to T.B.), the French National Research Agency (ANR; grant nos. ANR–10–BTBR–03
BREED-WHEAT, ANR–11–INBS–0010 MetaboHUB, and ANR–10–
LABX–0040–SPS), France AgriMer, the French Fund Supporting Plant Breeding (FSOV), and the European Union’s Seventh Frame-work Programme (FP7/2007–2013, under grant no FP7–613556).
2
Present address: Department of Botany and Plant Sciences, Uni-versity of California, Riverside, CA 92507.
3Present address: Laboratoire d’Ecophysiologie des Plantes sous
Stress Environnementeaux (LEPSE), Université de Montpellier, Insti-tut National de la Recherche Agronomique, Montpellier SupAgro, 34000 Montpellier, France.
4These authors contributed equally to the article.
5Senior author.
6Author for contact: catherine.ravel@inrae.fr.
The author responsible for distribution of materials integral to the findings presented in this article in accordance with the policy de-scribed in the Instructions for Authors (www.plantphysiol.org) is: Catherine Ravel (catherine.ravel@inrae.fr).
P.M. and C.R. conceived the research plan; T.B., P.M., E.B., and C.R. coordinated the study; T.B., V.H., M.D., P.L., C.B., N.F, M.-L.M.-M., C.D., A.M.-L.M.-M., Y.G., M.P., and E.B. performed the research; T.B., V.
H., M.-L.M.-M., E.B., and C.R. analyzed the data; T.B. wrote thefirst
draft of the manuscript; P.M., P.L, C.B, N.F, A.M., Y.G., E.B., and C.R.
revised the manuscript; and all authors approved thefinal version of
the article.
[OPEN]Articles can be viewed without a subscription. www.plantphysiol.org/cgi/doi/10.1104/pp.19.00842
Figure 1. Differential effects of N and S treatments on the grain transcriptome and metabolome. A, Photograph of grains and
accumulation of the grain dry mass during the three grain developmental phases. N and S treatments were applied from 200°Cd to
700°Cd after anthesis. B, Venn diagram depicting the overlapping transcripts (black) and metabolites (gray) with a significant
(FDR, 0.05) treatment, grain development, and/or treatment 3 grain development interaction effect. C, Heatmap showing
accumulation patterns for the 848 transcripts and 24 metabolites with a significant treatment effect in each N and S treatment and grain developmental stage. D and E, PCA (D) and hierarchical clustering on principal components (E) of the 848 transcripts and 24 metabolites with a significant treatment effect. In C and E, data are scaled (for each variable, the mean was subtracted, and the
result was divided by theSD) and are means of n 5 3 and 4 independent replicates for transcriptomic and metabolomic data,
respectively. In each cluster, lines represent the average abundance of all cluster members in the corresponding treatment, and the
shaded area represents theSE. F, Enriched Gene Ontology terms in the sets of DEGs, by cluster.
principal component, whereas the second principal
component clearly separated the N1S2 treatment from
the other three treatments (Fig. 1D). These two axes
explained about 67% of the total variance. The two S1
treatments (N2S1 and N1S1) were closely projected
on PCA, indicating that the second principal
compo-nent is rather influenced by S availability (Fig. 1D).
Transcripts and metabolites significantly affected by N
and S supply were grouped into three clusters by
hi-erarchical clustering of PCA results (Fig. 1E, Supplemental
Table S3). Transcripts and metabolites in clusters 1 and 3
had almost identical accumulation profiles in the four
nutritional conditions, with increased accumulation
dur-ing grain
filling for transcripts and metabolites in cluster
1 and the opposite pattern for those in cluster 3 (Fig. 1E).
These results highlight the strong effect of grain
develop-ment on the transcriptome and metabolome. Clusters
1 and 3 comprised 31% (261) and 41% (346), respectively,
of the differentially expressed genes (DEGs). These two
clusters also contained most of the significant metabolites
(23 of 24), including eight free amino acids, glutathione,
raffinose, and Suc. Interestingly, 241 transcripts and the
total free amino acids in cluster 2 showed strongly
in-creased accumulation during grain
filling in the N1S2
treatment (Fig. 1E). This result showed that a high N
supply without S perturbed the expression of these genes
and the free amino acid pool. Conversely, these transcripts
and metabolites did not respond to high S supply or to
high N when combined with high S supply.
To identify the biological role of genes grouped in
these three clusters, a Gene Ontology (GO) enrichment
was performed for each cluster (Fig. 1F; Supplemental
Table S4). Cluster 1 was enriched in terms associated
with metabolism (e.g. carbohydrate metabolic process,
cellular amino acid biosynthetic process, and lipid
metabolic process) and plant defense (e.g. chitin
bind-ing and chitinase activity; Fig. 1F), suggestbind-ing that N
and S treatments disturbed grain metabolism and that
grains could have perceived these treatments as stress.
The molecular function
“transaminase activity” was the
only GO term overrepresented in cluster 3 (Fig. 1F).
Interestingly, cluster 2 was enriched in the GO term
“chromatin binding” and terms related to sulfate and
amino acid metabolism (e.g. sulfate assimilation,
sul-fate adenylyltransferase (ATP) activity, amino acid
binding, and transaminase activity; Fig. 1F). Therefore,
transcripts and total free amino acids grouped in cluster
2 might have a role in the activation of S-related
pro-cesses in response to S deficiency caused by the N1S2
treatment.
Multiomics Coexpression Network Reveals the
Coordination of Different Groups of Responses to N and S
Supply during Grain Filling
To identify genes that could coordinate the grain
re-sponse to N and S supply, data for transcripts and
me-tabolites with a significant treatment effect were
combined with 132 proteomic variables (eight GSPs and
124 albumin-globulin variables) and other grain
varia-bles (N and S contents, N-to-S ratio, and dry mass per
grain) previously reported in Bonnot et al. (2017).
Coexpression and coaccumulation between the different
variables were analyzed using a semantic rule-based
network analysis (Fig. 2; Supplemental Table S5).
Validated rules resulted in a network composed of
484 variables (nodes) and 7,882 linkages (edges),
dis-tributed into three distinct modules (Fig. 2). Module A
consisted of 220 nodes highly interconnected (16 edges
per node on average), including grain N and S contents;
grain dry weight; GSPs; genes and proteins involved in
carbohydrate metabolism, defense, and degradation
inhibition processes; and metabolites including
gluta-thione, Suc, and raffinose (Supplemental Table S5).
Module B was the largest module, with 237 nodes (19
edges per node on average). Many nodes in this module
were genes and proteins that play a role in DNA
me-tabolism, RNA processing, or protein modification.
This network analysis allowed the identification of
similar groups compared to those revealed by
cluster-ing analysis (Figs. 1E and 2; Supplemental Table S5).
Module A grouped nodes showing increased
accumu-lation during grain
filling, whereas nodes in module B
had the opposite profile, as observed in clusters 1 and 3,
respectively (Figs. 1E and 2). Thus, transcripts and
me-tabolites within modules A and B strongly overlapped
with cluster 1 (96%) and cluster 3 (93%), respectively
(Supplemental Fig. S3). In these two modules,
coex-pressed transcripts, metabolites, and proteins were
mostly connected because of a grain development effect.
Nonetheless, several connected nodes might act together
in response to N and S supply. For example, a highly
connected WD-repeat-containing protein (144
connec-tions, TmLoc036574) in module B and a glutathione
S-transferase (TmLoc039307) connected to GSPs in
mod-ule A could be main regulators of grain protein
compo-sition in response to nutrient availability.
In contrast to modules A and B, module C consisted
of 27 nodes (three edges per node on average) with
strong changes in their accumulation in response to N
and S treatments (Fig. 2). These nodes were moderately
accumulated in the two S1 treatments, highly
accu-mulated in the N1S2 treatment, and intermediately
accumulated in the N2S2 treatment, corresponding to
the profile observed in cluster 2 (Figs. 1E and 2).
Sur-prisingly, most of the cluster 2 transcripts were not
grouped in module C. This result can be explained by a
stronger effect of the grain development compared to
the treatment effect and/or by a specific accumulation
profile for many of these transcripts. Consequently,
most of them were grouped in modules A and B or were
absent from the network. Nonetheless, this reduced list of
transcripts in module C, which were all grouped in cluster
2 (Supplemental Fig. S3), might play a significant role in
the grain response to N and S availability. Particularly, a
sulfate transporter (TmLoc029593) and a phosphate/
phosphoenolpyruvate translocator (TmLoc010460) were
the most connected within this module (18 and 17
connections, respectively; Fig. 2). Two proteins were
also connected in module C, namely a NmrA
domain-containing protein (M7Z7R6) and a glutathione
S-transferase C-terminal domain-containing protein
(M7ZKE7). Interestingly, module C is connected to
module A by a gene coding for the protein SDI2
(TmLoc042692). We hypothesized that genes
con-nected in module C could regulate grain protein
ac-cumulation under S-deficient conditions.
S Deficiency Strongly Upregulates 24 Genes during
Grain Filling
To identify transcripts and metabolites that respond
strongly to N and S treatments during grain
filling at
multiple time points, we performed statistical analyses
at each grain developmental stage from 300°Cd to
600°Cd after anthesis. We
filtered the resulting datasets
Figure 2. Coexpression network of transcripts, metabolites, and proteins impacted by N and S supply during einkorn grain filling.Node shape and color reflect attribute category, as indicated in the key, where the yellow rectangles represent the N and S masses per grain (GNC and GSC, respectively) and dry weight (GDW). Edges between nodes represent coaccumulation links. For each module, the plot shows average abundance of the module nodes versus thermal time after anthesis for the four N and S treatments. Transcripts described in Figure 4B are encircled in red. For each module, examples of transcript nodes described in the manuscript are encircled with a dashed red line and the gene description is indicated.
for transcripts and metabolites with a significant
treat-ment effect as described above (Fig. 1) and with a log
2fold change (LFC)
.j1j and FDR , 0.05 for at least one
treatment comparison and at least one time point. This
analysis revealed that more transcripts and metabolites
were differentially accumulated at 500°Cd and 600°Cd
after anthesis compared to 300°Cd and 400°Cd after
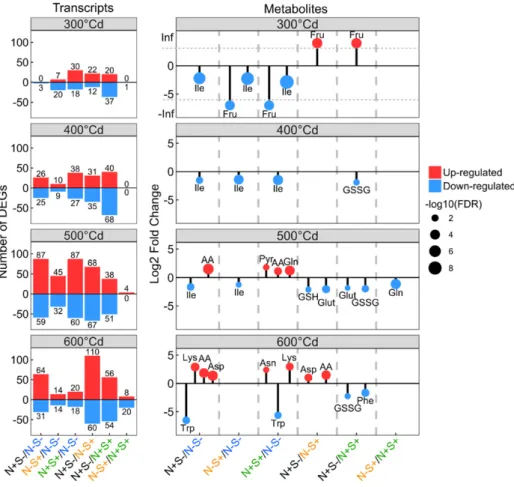
anthesis (Fig. 3). At the transcriptome level, many
transcripts were differentially accumulated in the
N1S2 treatment compared to the S1 treatments. This
is particularly relevant at 600°Cd after anthesis with
170 and 110 (20% and 13%, respectively, of the 848
DEGs) significantly altered transcripts for the
com-parisons N1S2/N2S1 and N1S2/N1S1 (Fig. 3). At
the metabolome level, treatments altered the pool of
free amino acids, whereby they increased in the N1
treatments compared to the N2 treatments (Fig. 3;
Supplemental Figs. S1 and S2). Major effects were
found for Asp, Asn, Lys, and Gln, which accumulated
substantially in the N1 treatments compared to the
N2 treatments. Conversely, N1 treatments strongly
downregulated Trp accumulation from 500°Cd after
anthesis to grain maturity (Fig. 3; Supplemental Figs. S1
and S2). Overaccumulation of Ile was observed in the
N2S2 treatment compared to the three other
treat-ments, especially at the beginning of grain
filling (Fig. 3;
Supplemental Figs. S1 and S2). The N1S2 treatment is
characterized by a low accumulation of oxidized and
reduced forms of glutathione (Fig. 3; Supplemental
Figs. S1 and S2). Interestingly, the most contrasting
treatments (N2S2 and N1S1) did not have the
strongest effect on the grain transcriptome (Fig. 3),
ex-cept at 500°Cd after anthesis. In addition, only Gln and
a few transcripts (1, 4, and 28 at 300°Cd, 500°Cd, and
600°Cd after anthesis, respectively) showed differential
abundances between N2S1 and N1S1 (Fig. 3). Taken
together, these results showed that high N and S supply
(N1S1) did not greatly perturb the grain
tran-scriptome and metabolome compared to low-N
condi-tions. However, high N supply without S (N1S2) had
a strong effect.
To identify genes strongly upregulated in response to
N1S2 treatment, which could play a role in the grain
response to S deficiency, we compared the lists of
upregulated transcripts obtained at the different time
points for the treatment comparisons N1S2/N2S1
and N1S2/N1S1. We identified 26 and 24 transcripts
upregulated at three or four grain developmental stages
for the comparisons N1S2/N2S1 and N1S2/
N1S1, respectively (Fig. 4A). All the 24 transcripts
identified in the N1S2/N1S1 comparison overlap
with the 26 transcripts in the N1S2/N2S1
compari-son. We defined these 24 transcripts as strongly
upre-gulated under S deficiency (Fig. 4B). Interestingly, these
Figure 3. Effects of nitrogen and sulfuron the differentially accumulated tran-scripts and metabolites by grain devel-opmental stage. On the left, histograms show the number of DEGs, and on the right, lollipop charts represent the LFC of significant metabolites, by treatment comparison and by grain developmental stage. Upregulation and downregulation of transcripts and metabolites was based on a comparison between the first and second treatments and reflect a signifi-cant higher (up-regulated) or lower (down-regulated) accumulation in the first compared to the second treatment. In the lollipop charts, dot size represents 2log10 of the FDR values. AA, total free amino acids; GSH, reduced glutathione; GSSG, oxidized glutathione; Glut, glu-tathione; Pyr, pyrroline-5 carboxylate.
transcripts were all grouped in cluster 2 (Fig. 1E), and
19 were connected in module C in the coexpression
network (Fig. 2). Three corresponded to transporters,
including two sulfate transporters and an amino acid
transporter (Fig. 4B). Other transcripts corresponded to
genes involved in sulfate and Met metabolisms (e.g.
phosphoadenosine phosphosulfate reductase,
adenylyl-sulfate kinase, methythioribose kinase, and homo-Cys
s-methyltransferase; Fig. 4B). Two ATP sulfurylases
and two glutathione-S-transferases were also identified
(Fig. 4B). Interestingly, the protein SDI2 coding gene,
described above as the connector between modules A
and C in the network analysis, showed high LFC values
between N1S2 and the S1 treatments (Fig. 4B). To
validate the RNA-Seq results, transcript accumulation
of two of these 24 DEGs, a sulfate transporter 1;1
(TmLoc011088) and an isoflavone reductase-like protein
(TmLoc014099), were analyzed by reverse transcription
quantitative PCR (RT-qPCR; Fig. 4C). Similar
tran-script responses were observed with both techniques
(Fig. 4C). In contrast to the 24 transcripts strongly
upregulated under S deficiency, 22 DEGs mainly
in-volved in defense processes and storage
accumula-tion, including genes encoding gliadins, showed an
opposite response and were strongly downregulated
by N1S2 (Supplemental Fig. S4).
To investigate the putative role of the 24 S
deficiency-responsive genes in the regulation of grain protein
composition in response to N and S supply, we
ana-lyzed the effect of the N and S treatments on the
coex-pression of these genes with the significant metabolites,
the GSPs, and variables related to N and S masses per
grain (Fig. 5). Connections in the N2S2 network
sug-gest that glutenin accumulation (LMW-GS and
HMW-GS) throughout grain
filling was associated in this
treatment with changes in grain N mass and in three
metabolites, including Suc and raffinose (Fig. 5). When
S was supplied (N2S1 network), changes in gliadins
and HMW-GS were highly associated with variations
in grain S and Suc content (Fig. 5). In the N1S1 network,
g-gliadins and HMW-GS were connected to grain N and
S contents, as well as Suc and raffinose contents (Fig. 5).
In the latter two networks, an amino acid transporter
was also connected (TmLoc031468), suggesting that this
gene might regulate GSP accumulation under S1
con-ditions (Fig. 5). Remarkably, in the N1S2 network, 11 of
the 24 S deficiency-responsive transcripts were
nected to HMW-GS. Total free amino acids, N
con-tent, and N-to-S ratio were also connected to
HMW-GS. Taken together, these results suggest that under S
deficiency, changes in GSP composition can be
con-trolled by the pool of total free amino acids, the grain
N-to-S ratio, and the S deficiency-responsive genes.
DISCUSSION
Plant nutrition represents a major factor determining
wheat grain yield and quality, with a well-known effect
of N and S supply on GSP composition (e.g. Dupont
et al., 2006; Dai et al., 2015) and consequently on
flour
functionality and bread-making quality (Zhao et al.,
1999). To identify regulatory mechanisms that may
control the grain composition under S and N
avail-ability/unavailability, we compared the impact of four
postanthesis N and/or S treatments on the
tran-scriptome and metabolome of developing grains of
the diploid wheat einkorn and combined them with
previously reported proteomic data (Bonnot et al.,
2017). Several transcripts were strongly and durably
differentially accumulated during grain
filling,
par-ticularly when high N was supplied without S (that is
in conditions of high N-to-S ratio and thus severe S
deficiency), which could have a major role in
control-ling the amino acid pool in response to S deficiency.
A Putative Mechanism of Grain Response to S deficiency
Our results highlighted an important effect of S
de-ficiency on the grain transcriptome and metabolome. S
deprivation with a high N supply resulted in a high
N-to-S ratio, exceeding 25 g N g
21S at the end of grain
filling (Bonnot et al., 2017) and therefore well above the
critical value for S deficiency of 17 g N g
21S (Zhao et al.,
1999). Total free amino acids and 241 transcripts were
upregulated during grain
filling in this nutritional
condition compared with the three other treatments,
including 24 transcripts defined as strongly responsive
to high-N supply without S (Figs. 1E and 4B). These 24
transcripts were upregulated by high N supply but not
by high N combined with high S. We hypothesized that
these genes might be activated by a high N-to-S ratio.
Our network analyses suggested that in the N1S2
condition, the changes in grain protein composition
were associated with changes in grain N-to-S ratio
(Fig. 5). This is based on the principle of
“guilt by
as-sociation,” which can be applied to coexpression
net-works (Oliver, 2000; Wolfe et al., 2005). Grain N-to-S
ratio was probably the main factor controlling the
ac-cumulation of GSPs in the N1S2 condition. Therefore,
we proposed a putative mechanism of grain response to
S deficiency, governed by genes identified in the 24
selected transcripts, and that could limit the disruption
of GSP accumulation (Fig. 6).
In response to a high postanthesis N supply without
additional S, the amino acid pool was increased in the
grain, consistent with previous reports (Howarth et al.,
2008; Dai et al., 2015). This pool mainly contained non-S
amino acids, which, with the decrease of glutathione
(Fig. 3; Supplemental Fig. S1), caused an increase in
the grain N-to-S ratio. Consequently, genes coding for
S-rich GSPs like g-gliadins were strongly repressed at
the transcriptional level (Supplemental Fig. S4), leading
to a drastic decrease in the rate and duration of
accu-mulation of the corresponding proteins (Dai et al.,
2015; Bonnot et al., 2017). In response to this dramatic
effect on the GSP composition, sulfate transporters
(TmLoc011088 and TmLoc029593) and several genes
in-volved in sulfate and Met metabolisms were upregulated
in order to activate both S transport and metabolism,
Figure 4. Identification of sulfur-deficiency-induced genes. A, Unique and overlapping DEGs between grain developmental stages. Bar plots represent the number of DEGs that are unique to a developmental stage or common across different stages. DEGs
upregulated in response to N1S2 compared to N2S1 and N1S1 are represented on the left and the right, respectively. DEGs
common across at least three grain developmental stages are represented in orange. B, Heatmap showing differential expression
therefore compensating for the S deficiency (Fig. 6). S
deficiency also led to the downregulation of genes
coding for S-containing proteins involved in defense
processes (Fig. 6; Supplemental Fig. S4). In addition,
our results highlighted a gene encoding SDI2 as one of
the most upregulated DEGs in response to S deficiency
(Figs. 2 and 4B). In Arabidopsis, SDI1 and SDI2 act as
major repressors of glucosinolate biosynthesis under S
deprivation; homologs exist in important crop species such
as wheat, maize (Zea mays), and rice (Oryza sativa; Aarabi
et al., 2016). Thus, a mechanism to prioritize S usage for
primary metabolism probably occurred under S-deprived
conditions, as previously reported (Aarabi et al., 2016).
Proteomics data, previously analyzed in Bonnot et al.
(2017) and used in network analyses, revealed a NmrA
domain-containing protein in module C (M7Z7R6;
Fig. 2), described as a S deficiency-responsive module.
In Aspergillus nidulans, transcription of genes encoding
N permeases and catabolic enzymes of N metabolism
re-quires the AreA transcription factor (TF; Marzluf, 1993).
During N sufficiency, AreA is negatively regulated by
NmrA (Wong et al., 2008). Thus, the NmrA
domain-containing protein might repress N transport and
metab-olism in einkorn grain in response to a high N-to-S ratio.
Glutathione, which scavenges reactive oxygen
spe-cies (Banerjee and Roychoudhury, 2019), had a lower
quantity per grain in the N1S2 treatment compared
with the other three treatments (Supplemental Fig. S1).
However, two glutathione S-transferases (TmLoc013296
and TmLoc035976) were highly upregulated in response
to S deficiency, suggesting an activation of the processes
of detoxification and redox buffering (Edwards et al.,
2000; Nianiou-Obeidat et al., 2017). The strong S
defi-ciency in the N1S2 treatment was likely perceived as an
abiotic stress and could have involved central regulators
of the redox state (Gupta et al., 2016). Similar results with
upregulation of genes acting in oxidation-reduction, S
transport, and S metabolism processes were observed in
pea (Pisum sativum) seeds under S-deficient conditions
(Henriet et al., 2019).
Changes in the Quantity of Free Amino Acids per Grain
Pinpoint Their Specific Sensing Role in Response to N and
S Deprivation
Despite the clear role of several genes and
metabo-lites in the grain response to S deficiency, molecular
mechanisms involved in the sensing of nutrient
depri-vation remain unclear. A number of studies suggest
that the levels of free amino acids may act as metabolic
signals of grain nutritional status and directly or
indi-rectly control the expression of several TF and kinase
genes (e.g. Hernández-Sebastià et al., 2005;
Ohkama-Ohtsu et al., 2008; Pandurangan et al., 2012; Cohen
et al., 2016). Signals derived from overall N status
play a major role in the regulation of N-responsive genes;
however, some genes are differentially induced by
differ-ent N sources (Kan et al., 2015), and selective sensing of
amino acid precursors has been recently discovered (Dong
et al., 2017). In the high-N treatments, several genes
in-volved in amino acid transport and metabolism were
upregulated and the quantity per grain of total free amino
acids was increased mainly because of the higher quantity
of Gln, Asn, Asp, and Lys. By contrast, the quantity of Trp
was several fold higher in the low-N than in the high-N
treatments. In the high-S treatments, the quantity per grain
of glutathione was higher and that of Asp was lower than
in the other treatments. All together, these results strongly
support a role of free amino acids in the regulation of grain
response to N and S availability.
In the N-to-S treatment, the quantities of branched
amino acids (Ile and Val) and Thr (a precursor of Ile) per
grain were much higher than in the other treatments
between 300°Cd and 550°Cd after anthesis. In animals,
these amino acids activate the Ser/Thr sensor-kinase
TOR (Target Of Rapamycin) signaling pathway that
couples amino acid availability to cell growth and
au-tophagy (Jewell et al., 2013). In the case of Ile, it
en-hances Glc consumption to balance N and C
metabolism (Zhang et al., 2017). TOR also controls a
large diversity of physiological pathways and processes
in plants (Dobrenel et al., 2016; Ryabova et al., 2019). In
Arabidopsis, S availability regulates the Glc-TOR
sig-naling pathway, whereas a decrease in amino acid
pro-duction by limitation of the C/N supply is achieved by
GCN2 and SnRK1 kinases (Dong et al., 2017). This
mechanism allows plants to distinguish between C/N
deprivation and S deprivation for amino acid biosynthesis
(Dong et al., 2017). In yeast (Saccharomyces cerevisiae),
GCN4 up-regulation through the activation of GCN2
protein kinase is induced by both Glc and amino acid
starvation (Yang et al., 2000). Our results did not reveal a
GCN4 homolog in treatment-responsive DEGs. However,
a putative Ser Thr-protein kinase, GCN2 (TmLoc029081),
was grouped in cluster 2 and showed higher transcript
abundance in response to high N availability when S was
limited. The N1S2 condition also led to a lower Glc mass
per grain during grain
filling (Supplemental Fig. S1). Thus,
in grain, the Glc-TOR signaling pathway might function in
activating S-deficiency response mechanisms by sensing
an excessive N-to-S ratio.
A Transient Transcriptional Reprogramming in the Early
Grain Response to S deficiency?
In wheat, GSP synthesis is mainly regulated at the
transcriptional level in response to N and S supply (Dai
Figure 4. (Continued.)patterns of the 24 DEGs upregulated in at least three grain developmental stages in response to N1S2 compared to both N2S1
and N1S1. The color scale depicts LFC values. C, Transcript levels quantified by RNA-Seq and RT-qPCR for two of the 24 selected
DEGs identified in A. Data are means6SDfor n 5 3 independent replicates.
et al., 2015). Eight conserved TFs are known to be
ac-tivators of GSP synthesis in cereals (Rubio-Somoza
et al., 2006; Verdier and Thompson, 2008). In
bar-ley (Hordeum vulgare), the GCN4 box of C-hordein
promoter, recognized by the b-ZIP TF BLZ1, is a
positive or negative motif depending on N
avail-ability (Müller and Knudsen, 1993). Although these
TFs are conserved in wheat, their function may be
different than in barley and other cereals. In wheat,
SHP, an ortholog of BLZ1 in barley and OHP in
maize, has been shown to be a negative regulator of
glutenin gene expression independent of N
avail-ability (Boudet et al., 2019), and results suggest that
SPA, an ortholog of BLZ2 in barley and Opaque-2 in
maize, is a negative regulator of gliadin gene
ex-pression (Ravel et al., 2009).
The nutritional conditions used in our study
modi-fied the level of expression of none of the known
Figure 5. Effects of N and S treatments onthe coaccumulation of GSPs, metabolites, and sulfur-deficiency-responsive transcripts. Data for the 24 transcripts upregulated in response to S deficiency, as highlighted in Figure 4B, the 24 significant metabolites, the mass per grain of N (GNC) and S (GSC), GSPs, and the grain N-to-S ratio (N:S) were used to analyze their coaccumulation by treatment, from 300°Cd to 600°Cd after anthesis. Edges between nodes represent coaccumulation links. GSH, re-duced glutathione.
Figure 6. Hypothetical mechanism of the grain response to S deficiency. The S-responsive mech-anism was caused by an increased N-to-S ratio in the grain cell. Examples of genes involved in this mechanism are indicated in bold. They are part of the 24 genes strongly upregulated (or down-regulated in the case of those involved in defense processes) in response to N1S2 compared to the two S1 conditions (Fig. 4B; Supplemental Fig. S3B).
transcriptional regulators of GSP genes. However, their
activity may have been regulated at the
posttransla-tional level. For instance, phosphorylation has been
shown to modulate the DNA binding capacity of
Opaque2 (Ciceri et al., 1997). In addition, grains were
collected from 300°Cd after anthesis, which is
;5 d after
the beginning of N and S treatment application (200°Cd)
if considering a mean daily temperature of 20°C. Thus, a
transcriptional regulation of these TFs may have
oc-curred in the early grain response to N and S, specifically
at the transition between the cellularization and effective
grain
filling stages. In this study, to identify genes and
metabolites strongly influenced by nutrient deficiencies
throughout grain
filling, we did not focus our results on
the interactions between treatment and grain
develop-ment effects. Studying the temporal effect of nutrient
availability would give more insights into the
mecha-nisms regulating grain developmental processes.
Our results did not reveal TFs in DEGs strongly
upregulated in response to S deprivation. However, we
identified 21 (2.5% of the 848 DEGs)
TFs/transcrip-tional regulators with a significant treatment effect
(Supplemental Fig. S5). Five of these corresponded to
genes encoding NAC-domain-containing proteins. This
large TF family plays a role in multiple plant abiotic
stress responses and includes members acting in N
signaling and N-deficiency responses (He et al., 2015;
Shao et al., 2015; Hsieh et al., 2018; Brooks et al., 2019).
In wheat, the NAC TraesCS3A01G077900.1 has been
described as a grain-specific transcript, downregulated
in response to drought (Guérin et al., 2019). In our data,
this transcript showed a higher accumulation in
con-ditions lacking N and/or S (Supplemental Fig. S5). This
gene showing different response profiles depending on
the perceived stress might have a specific role in certain
conditions including nutrient deficiencies. In addition,
one NAC (TmLoc031311) was upregulated in response
to N1S2 compared to S1 treatments and could be a
major regulator of the grain protein composition under
S deficiency (Supplemental Fig. S5). Other TF families
were represented in treatment-responsive TFs,
includ-ing MYB, BHLH, bZIP, WRKY, and AP2/ERF, which
are known to be involved in multiple abiotic stress
re-sponses (Chen et al., 2012; Roy, 2016; Das et al., 2019;
Wang et al., 2019; Xie et al., 2019).
Our data also revealed
five members of the RING/
FYVE/PHD zinc
finger protein superfamily as
re-sponsive to the experimental treatments (Supplemental
Fig. S5). PHD zinc
finger proteins act as epigenome
readers controlling chromatin-mediated transcriptional
regulation (Bienz, 2006; Sanchez and Zhou, 2011).
In-terestingly, two of them were upregulated in response
to N1S2 compared to S1 treatments (Supplemental
Fig. S5). These results suggested a potential role of
epi-genetic mechanisms in the grain response to S deficiency.
In barley, the incidence of epigenetic mechanisms in GSP
synthesis and control of grain development was
previ-ously reported and suggested to play an important role in
the regulation of grain composition (Sørensen et al., 1996;
Radchuk et al., 2005).
CONCLUSIONS
Our results demonstrate the high impact of S
defi-ciency on the transcriptome and metabolome of
de-veloping einkorn grains. During grain
filling, high
postanthesis N supply without S led to an increased
pool of free amino acids, necessary for GSP synthesis. In
response to the increase in the grain N-to-S ratio and the
resulting grain S deficiency, sulfate transporters and
genes involved in S metabolism were activated,
prob-ably to limit the impact of S deficiency on the
accu-mulation of S-rich GSPs. Several genes identified in this
study have a clear role in grain adaptation to nutritional
deficiencies and could play additional key roles in
controlling the grain protein composition, which is
deserving of further investigation.
MATERIALS AND METHODS
Plant Material
Analyses were performed on grains collected from the same biological material used in Bonnot et al. (2017). Briefly, seeds of Triticum monococcum ssp. monococcum (accession ERGE 35821) were germinated onfilter paper in petri dishes moistened with demineralized water, then seedlings were transplanted on February 4, 2014, to 50-mL PVC columns (7.5-cm i.d.3 50 cm deep; two seedlings per column)filled with a 2:1 (v/v) mixture of washed perlite:river sand. Columns were placed in a greenhouse to obtain a homogenous plant stand with a density of 512 plants m22. The four N and S treatments were arranged in a complete randomized block design with four replicates (Supplemental Fig. S6). Air temperature, relative humidity, and photosynthetic photonflux density were measured at the height of the ears in the center of each block using a temperature and relative humidity CS215-Lsensor (Campbell Sci-entific) and a JYP 1000 hemispherical photosynthetic photon flux density sensor (SDEC) mounted on miniature air-forcedflues connected to a CR1000 data logger (Campbell Scientific). Weather variables were recorded every minute and aver-ages over 15 min were stored. Air temperature in the greenhouse was controlled at 20°C/15°C (day/night) and air relative humidity was controlled at 55%/75% (day/night) at the top of the plant stand, with a 16-h photoperiod. During light periods plants received a mean total daily PPF of 9.68 mol m22d21. Main stems were tagged when the anthers of the centralflorets emerged (anthesis date). Thermal time was calculated by summing average daily air temperature after anthesis (base temperature 0°C) and was expressed in degree-days (°Cd).
From seedling transplantation to anthesis, each PVC column received 167 mL d21of a modified Hoagland’s nutrient solution (Castle and Randall, 1987) prepared with demineralized water and containing 3 mMof N and 0.1 mMof S
[1 mMKH2PO4, 1 mMKNO3, 0.5 mMCa(NO3)2, 0.5 mMNH4NO3, 0.1 mMMgSO4, 1.9 mMMgCl2, 3.5 mMCaCl2, 4 mMKCl, 10 mMH3BO3, 0.7 mMZnCl2, 0.4 mM
CuCl2, 4.5 mMMnCl2, 0.22 mMMoO3, and 50 mMEDFS-Fe]. From anthesis to 200°Cd after anthesis, the nutrient solution was replaced by demineralized water to avoid any overaccumulation of N and S compounds in the plant or in the potting substrate. Then four treatments that contained different combina-tions of N and S supply were applied from 200°Cd to 700°Cd after anthesis: a treatment corresponding to a nutrient solution with no N and S (N2S2); a high-N and low-S treatment (6 mMN and no S [N1S2]); a low-N and high-S
treatment (0.5 mMN and 2 mMS [N2S1]); and a high-N and high-S
treat-ment (6 mMN and 2 mMS [N1S1]). Grains were collected every 100°Cd after
anthesis from 300°Cd after anthesis to ripeness maturity (950°Cd after anthesis) for metabolite analysis, and from 100°Cd to 600°Cd after anthesis for tran-scriptome analysis. Grains were immediately snap-frozen in liquid N2after harvesting, then stored at280°C until RNA extraction, or freeze-dried and then milled to wholemealflour in liquid N2using a custom-made ball mill and then stored at280°C for metabolite analyses.
RNA Extraction and RNA-Seq
RNA was extracted from developing grains according to Pont et al. (2011). Three biological replicates were used. The 54 grain samples (three replicates at
100°Cd and 200°Cd after anthesis and three replicates for each of the four treatments [N2S2, N1S2, N2S1, at N1S1] at 300°Cd, 400°Cd, 500°Cd, and 600°Cd after anthesis) were ground in liquid N2. Flour (0.5 g) was suspended in 4.5 mL of a buffer containing 10 mMTris-HCl (pH 7.4), 1 mMEDTA, 0.1MNaCl, 1% (w/v) SDS and 3 mL of 25:24:1 (v/v/v) phenol:chloroform:isoamyl alcohol mixture. After centrifugation at 4,420g for 20 min at 15°C, the supernatant was collected, and 3 mL of the same phenol solution was added to eliminate starch and proteins. After centrifugation in the same conditions, the aqueous phase was collected, and nucleic acids were precipitated by adding 0.1 volume of 3M
AcNA (pH 5.2) and 2 volumes of 100% (v/v) ethanol. The pellet was dried under ambient condition for 1 h and dissolved in RNase-free water. A purifi-cation was then performed using a RNase-Free DNase set (Qiagen) and then a RNeasy MinElute Cleanup kit (Qiagen). The amount and integrity of RNA were checked by agarose gel electrophoresis before library construction. The same RNA extracts were used for RNA-Seq and RT-qPCR.
RNA-Seq was done at Eurofins MWG Operon (www.eurofinsgenomics.eu). RNA strand-specific libraries were created using commercially available kits according to the manufacturer’s instructions. In brief, polyA-RNA was extracted from total RNA using an oligodT-bead based method. After mRNA fragmentation,first and deoxy-UTP-based second strand synthesis was carried out, followed by end-repair, A-tailing, ligation of the indexed Illumina Adapter, and digestion of the deoxy-UTP-strand. Size selection was done using a bead-based method targeting an average insert size of 150 to 400 bp. After PCR amplification, the resulting fragments were cleaned up, pooled, quantified and used for cluster generation. For sequencing, pooled libraries were loaded on the cBot (Illumina) and cluster generation was performed according to the manu-facturer’s instructions. Paired-end sequencing using a 125-bp read length was performed on a HiSeq2500 machine (HiSeq Control Software v2.2.38) using HiSeq Flow Cell and TruSeq SBS Kit. For processing of raw data, RTA v1.18.61 and CASAVA v1.8.4 (Illumina) were used to generate FASTQ-files.
Read Alignment and Counting
Reads were mapped to the T. monococcum reference genome v1 available at the Unité de Recherche Génomique Info database (urgi.versailles.inra.fr/ download/iwgsc/), using a BWA-MEM (v0.7.12-r103;, http://bio-bwa. sourceforge.net/) tool. Number of reads and percentages of mapped reads per sample are given in Supplemental Fig. S7. Only reads with a unique mapping position and a mapping quality score of at least 10 were considered for read counting. Read counting was realized using the software featureCounts from the Subread package (v1.4.6). Paired-end reads that were mapped to the same reference with the expected insert size were counted as one read. Paired-end reads that were mapped to different references or those with an unexpected insert size were counted as two reads. If only one read of a pair was mapped, it was counted as one read. Single-end reads were used straightforwardly. Only reads overlapping exon features were counted. All reads mapping to features with the same grouping tag were summed.
1
H-NMR Metabolomic Profiling
Polar metabolites were extracted from 50 mg of wholemealflour with an ethanol-water series at 80°C (adapted from Moing et al., 2004; Allwood et al., 2011). The supernatants were combined, dried under vacuum, and freeze-dried. Each freeze-dried extract was solubilized in 500 mL of 200 mMdeuterated potassium phosphate buffer solution (apparent pH 6.0) containing 3 mMEDTA to chelate paramagnetic cations and improve spectrum resolution (especially in the citrate region), pH-adjusted with 1MKOD or 0.1MDCL solution by means of BTpH (Bruker BioSpin GmbH) to apparent pH 6.06 0.02, and freeze-dried again. The freeze-dried titrated extracts were stored in darkness under vacuum at room temperature until1H-NMR analysis was completed within 1 week.
For1H-NMR analysis, 500 mL of D
2O with sodium trimethylsilyl [2,2,3,3-d4] propionate (0.01% [w/v]final concentration for chemical shift calibration) was added to each freeze-dried titrated extract. The mixture was centrifuged at 17,700g for 5 min at room temperature. The supernatant was then transferred into a 5 mm NMR tube for acquisition. Quantitative1H-NMR spectra were recorded at 500.162 MHz and 300 K on an Avance III spectrometer (Bruker Biospin) using a 5-mm ATMA broadband inverse probeflushed with N2gas and an electronic reference for quantification (Digital ERETIC, Bruker TopSpin 3.0). Sixty-four scans of 32,000 data points each were acquired with a 90° pulse angle, a 6-MHz spectral width, a 2.73-s acquisition time, and a 20-s recycle delay. The assignments of metabolites in the NMR spectra were made by comparing the proton chemical shifts with literature (Likes et al., 2007) or
database values from MeRy-B (a database of plant 1H-NMR metabolomic profiles), the Human Metabolome Database, the Biological Magnetic Resonance Bank, and the Madison Metabolomic Consortium Database by comparing spectra of authentic compounds and by spiking the samples. An example of an annotated NMR spectrum is given in Supplemental Figure S8. For assignment purposes,1H-1H correlation spectra and1H-13C heteronuclear single quantum coherence spectra were acquired for a selected sample. For absolute quantifi-cation, four calibration curves (Glc and Fru, 2.5–100 mM; Glu and Gln, 2.5–30 mM) were prepared and analyzed under the same conditions. The Glc
calibration was used, for the quantification of all compounds, as a function of the number of protons of selected resonances, except for Fru, Glu, and Gln, which were quantified using their own calibration curve. The concentration of each organic or amino acid was expressed as grams of the acid form per gram of dry mass (Supplemental Table S1). The metabolite concentrations were calcu-lated using AMIX (v3.9.14, Bruker) and Excel (Microsoft) software programs.
Targeted Analyses of Metabolites
Starch and total free amino acid assays were performed as previously de-scribed (Biais et al., 2014; Bénard et al., 2015). Four biological replicates were used. Aliquots of;20 mg of wholemeal flour were fractionated with ethanol/ water at 95°C for 15 min, twice with 250 and 150 mL, respectively, of 80% (v/v) ethanol, and once with 250 mL of 50% (v/v) ethanol. Starch was determined on the pellet by resuspension in 100 mMNaOH and heating at 95°C for 30 min (Hendriks et al., 2003). The sum of free amino acids was determined in the ethanolic supernatant (Bantan-Polak et al., 2001; Nunes-Nesi et al., 2007). Ox-idized (GSSG) and reduced (GSH) glutathione were extracted and assayed enzymatically with glutathione reductase and 5,59-dithiobis-2-nitrobenzoic acid, as described by Griffith (1980). Extractions and assays were performed in 1.1 mL Micronic tubes (Lelystad) and 96-well polystyrene microplates (Sar-stedt), respectively, using a robotized Starlet platform (Hamilton). Absorbance was read at 340 (starch) or 405 nm (glutathione assay) using a MP96 reader (SAFAS). Fluorescaminefluorescence for amino acids was determined using a Xenius reader (SAFAS) with excitation at 405 nm and detection at 485 nm.
Statistical and Data Analysis
All statistical analyses were performed using the statistical software program R v3.6.1 (R Core Team, 2018). The edgeR package v3.28 (Robinson et al., 2010) was used for differential expression analysis. The Counts Per Million method was used with a threshold offive reads per million in a third of the samples. Libraries were normalized using the trimmed mean of M-values method (Robinson and Oshlack, 2010; Dillies et al., 2013). The differential expression analysis was performed with generalized linear models. To analyze the main effects of the grain developmental stage, the treatment, and the interaction between stage and treatment, and to identify genes differentially expressed between any of the groups, an ANOVA-like test was performed by specifying multiple coefficients to the glmLRT function of the EdgeR package. Significant effects were judged at P, 0.05 after FDR correction using the Benjamini and Hochberg (1995) procedure. To identify genes differentially expressed between two different types of nutrition at each stage of development, 24 likelihood ratio tests were used (six questions per stage). The log of the average gene expression is an additive function of a replicate effect (3 modalities), a stage of development effect (4 modalities), a treatment effect (4 modalities), and an interaction be-tween the stage and the treatment (16 modalities). The probability of signifi-cance (P-value) per contrast was adjusted using the Benjamini-Hochberg procedure. Genes with FDR, 0.05 and LFC . j1j were considered as differ-entially expressed in the corresponding contrast. This analysis was performed using the workspace DiCoExpress (https://www.researchsquare.com/article/ 84521cdd-9046-44ac-8f52-906dc21cf1a4/v1). The data, the R script, and the results are available at https://forgemia.inra.fr/GNet/einkorn_grain_tran-scriptome. The results of the differential analysis are in the folder /Results/ Einkorn_grain/DiffAnalysis, where a subfolder is dedicated to each question. The folder /Results/Einkorn_grain/Quality_Control contains a pdffile with exploratory plots to investigate the data quality. For further explanation, we refer readers to the DiCoExpress user manual.
Differences in mass of metabolites per grain were analyzed using a two-way ANOVA with treatments and grain developmental stages (from 300°Cd to 950°Cd after anthesis) defined as factors. Effects of the grain developmental stage, the treatment, and the interaction between stage and treatment were judged to be significant at P , 0.05 after FDR correction. To identify metabolites differentially accumulated between two different types of nutrition at each
stage of development, Tukey’s honestly significant difference (HSD) mean-separation tests were performed (Supplemental Table S2). For each com-parison, metabolites with FDR , 0.05 and LFC . j1j were considered significant.
Transcripts and metabolites with a significant treatment effect (FDR , 0.05) were analyzed using PCA performed with the“ade4” R package (Thioulouse et al., 1997), and a hierarchical clustering on principal components was com-puted with the“FactomineR” package for R and the Ward’s criterion applied on thefirst five principal components (Husson et al., 2015; Supplemental Table S3). The number of clusters was determined with the suggested partition, that is, the one with the highest relative loss of inertia. The heatmap of significant tran-scripts and metabolites presented in Figure 1C was generated using the R package“pheatmap” (Kolde, 2019). Bar plots depicting overlapping transcripts between grain developmental stages were generated using the“UpSet” R package (Conway et al., 2017). All other plots were generated using the “ggplot2” R package (Wickham, 2016).
Functional Annotation and GO Enrichment Analysis
All the 12,327 transcripts considered in differential expression analyses were functionally annotated using the gene annotation pipeline TriAnnot (Leroy et al., 2012) and a custom made perl script (TriAnnotpost.pl, not published). Briefly, protein-derived gene models are reconstructed (only proteins starting with a Met and avoiding pseudogenes) based on fasta and gfffiles of scaffolds from the T. monococcum reference genome v 1 available at the URGI database (urgi.-versailles.inra.fr/download/iwgsc/). The best alignment against a plant Poa-ceae protein database and the Triticum aestivum IWGSC RefSeq v1.0 annotated peptides (Appels et al., 2018) is given by TriAnnotpost.pl, as is the functional annotation including the related GO terms (molecular function, biological process, and cellular component; Supplemental Table S4). For pseudogenes, gene models with no start codon, genes corresponding to short scaffolds (,1 Kb), and genes with an unknown function, we extracted the pseudogene transcripts and performed a BLASTx against the IWGSC RefSeq v1.0 annotated peptides (Supplemental Table S4; Appels et al., 2018).
A GO enrichment analysis was performed by cluster (Fig. 1F) using all GO terms identified in the T. aestivum IWGSC RefSeq v1.0 as the reference set for comparison against GO terms associated with DEGs identified in each cluster. To identify enriched GO terms, Fisher’s exact tests were performed, and statistical differences were considered to be significant at adjusted P-value ,0.05 after FDR correction (Supplemental Table S4; Benjamini and Hochberg, 1995). Enriched GO terms were visually represented as described in Bonnot et al. (2019).
Network Analysis
Coexpression/coaccumulation of genes, metabolites, and proteins that were significantly impacted by N and S treatments was investigated using the RulNet platform for network inference (http://rulnet.isima.fr; Vincent et al., 2015). Data were scaled and a semantic was written tofind rules between coex-pressed/coaccumulated genes, metabolites, and proteins (Supplemental Table S5; Supplemental Method S1). Three quality measures (that is support, confi-dence, and lift) were used to select the best rules. Threshold values for support, confidence, and lift were set at 0.3, 0.9, and 1.5, respectively, for the network presented in Figure 2. These thresholds were increased to 0.4, 1, and 2 for the networks presented in Figure 5 because of the lower number of conditions used. Validated rules were used to visualize networks using CYTOSCAPE software v3.3.0 (Smoot et al., 2011).
RT-qPCR
Samples of 5 mg of total RNA extracts were reverse transcribed with 5 mMof random hexamers (ThermoFisher Scientific) and 200 U of RevertAid Reverse Transcriptase (ThermoFisher Scientific) in a final volume of 20 mL per reaction. Transcript levels were quantified by qPCR with a Lightcycler 480 SYBR Green I Master (Roche) using 5 mL of 503 diluted complementary DNA and 0.5 mMof each primer in afinal volume of 15 mL. The primer sequences used are listed in Supplemental Table S6. The mRNA expression levels relative (R) to the housekeeping genes HIST3, ACT1, and ADPRF were calculated as R5 «Cp2Cp*, where« is the primer efficiency, Cp is the crossing point for the measured gene, and Cp* is the geometric mean of the crossing point for the housekeeping genes.
Accession Numbers
The RNA-Seq data analyzed in this study were deposited in the Gene Ex-pression Omnibus (GEO) database, https://www.ncbi.nlm.nih.gov/geo (ac-cession no. GSE107807). Quantitative data of the described transcripts and metabolites are provided in Supplemental Table S1, and functional annotation of transcripts is provided in Supplemental Table S4.
Supplemental Data
The following supplemental materials are available.
Supplemental Figure S1.Profiles of quantified metabolites in einkorn grains grown under four combinations of N and S supply.
Supplemental Figure S2.Map of the metabolites differentially accumu-lated during einkorn grain development in response to N and S supply. Supplemental Figure S3.Overlap between network modules and clusters. Supplemental Figure S4.Identification of sulfur-deficiency-repressed genes. Supplemental Figure S5.Effects of N and S treatments on transcriptional
regulator expression.
Supplemental Figure S6.Randomized block design used for T. monococ-cum plant cultivation.
Supplemental Figure S7.Percentage of reads sequenced and mapped in the transcriptome analysis.
Supplemental Figure S8.Representative 1D1H 500 MHz NMR spectrum of a polar extract of T. monococcum grain at 300°Cd after anthesis and grown under N2S2 treatment.
Supplemental Table S1.Quantification results. Supplemental Table S2.Statistical analysis results.
Supplemental Table S3.Clustering analysis of the differentially accumu-lated transcripts and metabolites.
Supplemental Table S4. Functional annotation of the T. monococcum transcriptome.
Supplemental Table S5.RulNet rules for -omics network inference. Supplemental Table S6.Primer sequences used in RT-qPCR.
Supplemental Method S1.Semantic used to infer regulatory networks from -omics data.
ACKNOWLEDGMENTS
We thank Richard Blanc for his help with plant cultivation; David Alvarez and Annie Faye for organizing plant culture and planning grain sampling; Marielle Merlino, Sibille Perrochon, Julie Boudet, and Isabelle Nadaud for help with grain sampling; Mickaël Maucourt for the metabolome analysis; Florent Murat for help in supervising the read mapping step during RNA-Seq data analysis; Morgane B. Gillard for her help with statistical analyses; and Selver Babi and Romain De Oliveira for their help with data analysis.
Received July 26, 2019; accepted March 27, 2020; published April 15, 2020.
LITERATURE CITED
Aarabi F, Kusajima M, Tohge T, Konishi T, Gigolashvili T, Takamune M, Sasazaki Y, Watanabe M, Nakashita H, Fernie AR, et al(2016) Sulfur deficiency-induced repressor proteins optimize glucosinolate biosyn-thesis in plants. Sci Adv 2: e1601087
Aguirrezábal L, Martre P, Pereyra-Irujo G, Echarte MM, Izquierdo N (2015) Improving grain quality: Ecophysiological and modeling tools to develop management and breeding strategies. In VO Sadras, DF Calderini, eds, Crop Physiology: Applications for Genetic Improvement and Agronomy, Ed 2. Academic Press, Amsterdam, pp 423–465 Allwood JW, De Vos RCH, Moing A, Deborde C, Erban A, Kopka J,
Goodacre R, Hall RD(2011) Plant metabolomics and its potential for systems biology research: Background concepts, technology, and