Publisher’s version / Version de l'éditeur:
Vous avez des questions? Nous pouvons vous aider. Pour communiquer directement avec un auteur, consultez la Questions? Contact the NRC Publications Archive team at
[email protected]. If you wish to email the authors directly, please see the first page of the publication for their contact information.
https://publications-cnrc.canada.ca/fra/droits
L’accès à ce site Web et l’utilisation de son contenu sont assujettis aux conditions présentées dans le site
LISEZ CES CONDITIONS ATTENTIVEMENT AVANT D’UTILISER CE SITE WEB.
AIP Advances, 11, 1, 2021-01-08
READ THESE TERMS AND CONDITIONS CAREFULLY BEFORE USING THIS WEBSITE. https://nrc-publications.canada.ca/eng/copyright
NRC Publications Archive Record / Notice des Archives des publications du CNRC :
https://nrc-publications.canada.ca/eng/view/object/?id=835d7d50-5e47-41c5-bb88-e9e500163881
https://publications-cnrc.canada.ca/fra/voir/objet/?id=835d7d50-5e47-41c5-bb88-e9e500163881
This publication could be one of several versions: author’s original, accepted manuscript or the publisher’s version. / La version de cette publication peut être l’une des suivantes : la version prépublication de l’auteur, la version acceptée du manuscrit ou la version de l’éditeur.
For the publisher’s version, please access the DOI link below./ Pour consulter la version de l’éditeur, utilisez le lien DOI ci-dessous.
https://doi.org/10.1063/9.0000106
Access and use of this website and the material on it are subject to the Terms and Conditions set forth at
Simultaneous three-axis torque measurements of micromagnetism
Fast, K. R.; Thibault, J. A.; Sauer, V. T. K.; Dunsmore, M. G.; Kav, A.; Losby,
J. E.; Diao, Z.; Luber, E. J.; Belov, M.; Freeman, M. R.
Simultaneous three-axis torque measurements
of micromagnetism
Cite as: AIP Advances 11, 015119 (2021);doi: 10.1063/9.0000106
Presented: 4 November 2019 • Submitted: 15 October 2020 • Accepted: 16 November 2020 • Published Online: 8 January 2021
K. R. Fast,1J. A. Thibault,1V. T. K. Sauer,1M. G. Dunsmore,1 A. Kav,1J. E. Losby,1,2,3Z. Diao,1,4E. J. Luber,5
M. Belov,3 and M. R. Freeman1,a)
AFFILIATIONS
1Department of Physics, University of Alberta, Edmonton, Alberta 26G 2R3, Canada
2Department of Physics and Astronomy, University of Calgary, Calgary, Alberta T2N 1N4, Canada
3Nanotechnology Research Centre (NANO), National Research Council Canada (NRC), Edmonton, Alberta T6G 2M9, Canada 4Department of Physics, Florida Agricultural and Mechanical University, Tallahassee, Florida 32307, USA
5Department of Chemistry, University of Alberta, Edmonton, Alberta 26G 2R3, Canada
Note:This paper was presented at the 65th Annual Conference on Magnetism and Magnetic Materials.
a)Author to whom correspondence should be addressed:[email protected]
ABSTRACT
Measurements of magnetic torque are most commonly preformed about a single axis or component of torque. Such measurements are very useful for hysteresis measurements of thin film structures in particular, where high shape anisotropy yields a near-proportionality of in-plane magnetic moment and the magnetic torque along the perpendicular in-in-plane axis. A technique to measure the full magnetic torque vector (three orthogonal torque components) on micro- and nano-scale magnetic materials is introduced. The method is demonstrated using a modified, single-paddle silicon-on-insulator resonant torque sensor. The mechanical compliances to all three orthogonal torque components are maximized by clamping the sensor at a single point. Mechanically-resonant AC torques are driven by an RF field containing a frequency component for each fundamental torsional mode of the device, and the resulting displacements read out through optical position-sensitive detection. Measurements are compared against micromagnetic simulations of mechanical torque to augment the interpretation of the signals. As an application example, simultaneous observations of hysteresis in the net magnetization along with the field-dependent in-plane anisotropy is highly beneficial for studies of exchange bias.
© 2021 Author(s). All article content, except where otherwise noted, is licensed under a Creative Commons Attribution (CC BY) license (http://creativecommons.org/licenses/by/4.0/). https://doi.org/10.1063/9.0000106
I. INTRODUCTION
Torque magnetometers1 have returned as a popular tool in
micromagnetism over recent decades, developing from microme-chanical cantilevers for atomic force microscope tips.2These
can-tilevers were adopted as the basis of torque magnetometers,3,4owing
to their high sensitivity to low-mass magnetic materials and their ability to measure magnetic anisotropies.5
Versatility is a distinct advantage of torque magnetometers compared to other methods of magnetometry. Readout of mechani-cal deflection can be accomplished in a number of ways, most com-monly with capacitive or piezoresistive methods,5–7which have been
developed to allow measurement of torque about two orthogonal axes of the cantilevers. Advancement of such measurement tech-niques have allowed for maximized sensitivity to both measurable
axes,6measurement of force on nanomechanical resonators,8as well
as development of sensitivity to all three orthogonal torque axes.9
To date however, only two orthogonal torque modes have been measured concurrently. Torque measurements are most commonly performed on in-plane modes although measurements of the out-of-plane torque, as accomplished by Hajisalemet al.,10allow for the
study of in-plane magnetic anisotropy of thin-film structures. Pair-ing the out-of-plane torque with both in-plane modes will enable more detailed characterization of magnetic samples, as seen in other forms of magnetometry (e.g. MOKE microscopy11). We introduce
here a method of concurrent measurement of the full magnetic torque vector.
A micromechanical torque magnetometer consists of a mag-netic specimen mounted on a flexible support structure, typically a cantilever. The magnetometer measures the deflection of the
support due to a torque applied on the magnetic sample through the interaction of its moment with an external field,
τ = m ×μ0H. (1)
Torque magnetometers are typically capable of making DC or AC measurements. The technique presented here studies AC magnetic torques, achieved through the application of an alternating field perpendicular to a DC magnetizing field. When the AC field is driven at a frequency corresponding to the support’s mechani-cal resonance, the sensitivity of the sensor to applied torque is maximized.
To measure the torque about three orthogonal axes, a device susceptible to resonance about each axis is required as a support-ing structure. Such a device and the technique used to simultane-ously extract each torque component is presented, with emphasis on interpretation of the resulting signals.
II. EXPERIMENTAL DETAILS
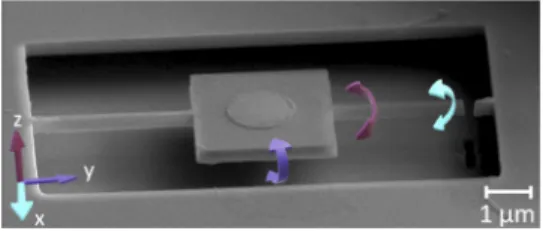
To demonstrate our method of measuring the complete torque vector, we use single-paddle, silicon-on-insulator devices. A typ-ical device is shown in Figure 1. Details of the fabrication pro-cess are given in the supplementary material S1. Each torque mode supported by a device corresponds to a unique mechani-cal resonance. A simple modification of a standard device recipe12
makes the sensitivity to x- and z-torques comparable to that for y-torque.
An RF field is applied to the sensor by driving a wound coil with a current containing components of each of the sensor’s reso-nant frequencies. This coil is placed asymmetrically atop the device to produce in-plane field components at the sample in addition to the primary out-of-plane field produced by the coil. The position-ing of the coil produces RF field primarily along thex- and z-axes. A torque is applied to the sample by the application of a DC mag-netizing field in conjunction with the applied RF field. This DC field is produced by a permanent neodymium iron boron magnet. Hys-teresis measurements of torque are collected via translation of this magnet along the system’sx-axis.
Signal readout is accomplished with a free-space optical inter-ferometer using a helium neon laser (λ = 633 nm). The three frequency components in the interferometer signal are separated with a Zurich Instruments multi-channel lock-in amplifier, per-mitting measurement of signal magnitude and phase for each
FIG. 1. Electron micrograph of a micromechanical device used for demonstration of the three-axis torque measurement technique. The arrows indicate the three orthogonal torsional displacements. A cut in the torsion arm located beside the blue arrow allows susceptibility about three orthogonal axes.
torque mode. The amplitude of the recorded signal is converted to physical units through thermomechanical calibration, following the procedure described by Haueret al.13Thermomechanical
calibra-tion data and the corresponding torque sensitivities are presented in thesupplementary materialS2.
The use of optical interferometry to read out torque signal addi-tionally allows a method with which to characterize the mechanical motion of the sensors. This is done through scanning the laser spot across an area encompassing the device to measure the reflectance, signal strength, and signal phase. Details on mapping the sensor’s displacement through interferometry is given in thesupplementary materialS3.
III. RESULTS A. Hysteresis
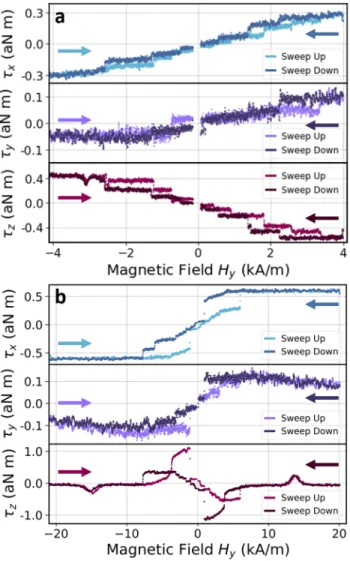
Measurements to illustrate the effectiveness of our three-axis measurement technique are shown inFigure 2, where torque about the three orthogonal axes of our sensor was measured simultane-ously. A typical hysteresis measurement on this apparatus is taken with the DC field oriented along thex-axis of the coordinate system defined inFigure 1. Such a configuration maximizes they-torque and minimizes thez-torque to the point where it is indistinguish-able from noise. This is due in large part to the small magnitude of in-plane RF field produced by the off-axis coil, as well as a neg-ligible in-plane shape anisotropy throughout the permalloy disk. An out-of-plane magnetic torque relies on the contributions of in-plane field and magnetization. These are produced by the off-axis RF coil, as well as a small out-of-plane DC field caused by an asym-metry between the height of the magnet and sample. These contribu-tions are typically of similar magnitude and dwarfed by out-of-plane torque contributions in τxand τy. Cancellation of the two in-plane
contributions from the cross product typically negates the out-of-plane torque. It has been experimentally determined that in low field, the cancellation of the contribution terms is minimized for a DC field rotated 104.4○
from the positivex-axis. At this angle, the magnetization state in low-fields produces a strong z-torque contribution.
The data shown inFigure 2was collected in ambient condi-tions with the laser spot located at the position noted by a red circle in Figure S1a and the permanent magnet rotated 104.4○from the
positivex-axis.
The low-field behaviour, presented as a minor hysteresis loop inFigure 2a, is indicative of the Barkhausen effect, which has been thoroughly described in previous works.15–17The Barkhausen
fea-tures ofFigure 2aare also clearly seen inFigure 2bbetween -1 and +5 kA/m (Sweep Up) and between +1 and -5 kA/m (Sweep Down). The characteristics of this low-field state are indicative of a vortex magnetization state, where the magnetization in the permalloy disk is circularly oriented in-plane around an out-of-plane magnetized vortex core. As the field applied to the sample is adjusted, the vortex core translates along the disk, interacting with defects on the permal-loy layer. This interaction results in the pinning of the vortex core within the defect. As such, the magnetization of the disk becomes trapped in this pinning site, resulting in the plateaus seen throughout
Figure 2a. Notably, the slopes of the plateaus in thex- and z-torques ofFigure 2do not agree. Thex-torque plateaus possess a small slope, while those of thez-torque remain flat. This difference in behaviour
FIG. 2. Simultaneous hysteresis measurements of orthogonal AC torques from a cobalt oxide/permalloy bilayer disk at room temperature at (top to bottom) fmechanical=1.886, 4.194, 0.953 MHz. The in-plane bias field direction here is rotated 104.4○from ˆx towards ˆy. Solid arrows indicate the direction of changing
field for each branch of the hysteresis loop. (a) A minor hysteresis loop, throughout which the magnetization in the permalloy layer remains in a vortex configuration. (b) A major hysteresis loop, representing the behaviour of the torque as the permal-loy layer switches between the saturated and vortex magnetization states. The magnitude of torque was determined through thermomechanical calibration.14
is indicative of a deformable vortex with a pinned core, as described by Burgesset al. in their deformable vortex pinning model.17
The behaviour of the torques throughout the major hysteresis loop ofFigure 2bprovides key insight into the change in magnetiza-tion throughout the loop. This loop was initialized in negative field at a 104.4○magnet angle. The behaviour of thex- and z-torques in
this major loop are particularly descriptive of the system’s magneti-zation. At -4 kA/m as the field is swept up, the slope of thex-torque abruptly changes. This slope is constant until −1 kA/m, where the magnetization jumps significantly into a new magnetization state (the low-field vortex state depicted inFigure 2a). From this state, the vortex annihilates at 6 kA/m, resulting in a saturated magnetization.
A similar trend is seen on the sweep-down in field. Thez-torque shows similarly distinct magnetization changes at the same transi-tion fields. At the first transitransi-tion, thez-torque abruptly changes from a zero to non-zero (approximately 1 aN m) magnitude, which lin-early increases until the magnetization drops into the vortex state where Barkhausen effects are evident. When the vortex state is anni-hilated, thez-torque is once again negligible. These distinct changes in magnetization and corresponding torque behaviour can be char-acterized and described through comparison with micromagnetic simulation. The small bumps inz-torque seen at ± 14 kA/m are a result of thermally-assisted dynamics of small closure domains in the spin texture. Magnetic edge roughness results in pinning sites, between which these closure domains jump, giving rise to a shift in signal phase. The phase corresponding to thez-torque reveals 180 degree peaks corresponding to these features, indicating that these thermal dynamics are at play. These peaks are found to have a strongly field-angle dependent fingerprint, consistent with edge roughness.
B. Simulation
Micromagnetic simulations using Mumax18are a vitally
use-ful tool to investigate the magnetization of the sample throughout the hysteresis loops of Figure 2. Torques are calculated in post-processing to directly compare simulations with data. To correctly interpret the mechanisms behind specific features in the data, sim-ulations which isolate specific physical parameters are performed. Through this method, the key features of the minor hysteresis loop ofFigure 2a and the major hysteresis loop ofFigure 2bcan be isolated. The simulations discussed here employed an applied field rotated 104.4○ to mimic the DC field applied throughout
the loops ofFigure 2 with no edge smoothing applied to investi-gate the effects of edge roughness. The magnetic area was defined as a permalloy cylinder with 20 nm depth and 1.44 μm diame-ter. At ambient temperatures, the cobalt oxide layer is assumed to contribute negligibly and is as such neglected. At each DC field value (stepped in increments of 0.08 kA/m), the field was dithered along the (111) direction to mimic an RF driving field. The ampli-tude of the driving field was assumed to be 0.02 kA/m in post-processing of the torques. This magnitude was chosen to match the x-torque simulation and data magnitudes, under the assumption that the calibrated RF field magnitude should agree with simulation values.
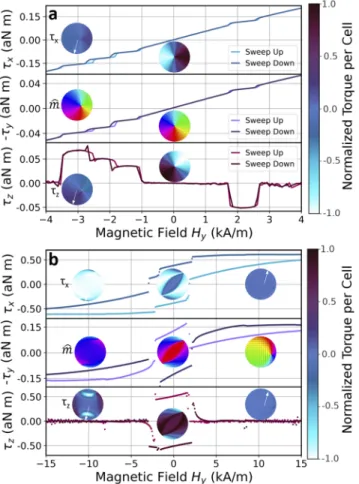
For the simulation presented inFigure 3a, a vortex was initial-ized, and the field swept over a small range. This simulation used 2.8 nm cells over a 512 pixel wide grid. Four artificial defects were implanted in the permalloy cylinder along the path of the vortex core to produce pinning sites. These defects were designed as small square regions (20 nm wide) with a saturation magnetization 85% that of permalloy. The artificially implanted defects produced in-plane torque behaviour (τx and τy) corresponding to Barkhausen
jumps, as seen inFigure 2and as described in previous works.15,16
The out-of-plane torque behaviour shows a dependence on defect position for the torque amplitude. Evidence of hysteresis due to pin-ning is found in all three torque modes. However, this hysteresis only appears for jumps between neighbouring pinning sites, and does not affect the behaviour as the vortex core jumps from a pristine platform into a defect, or vice versa.
FIG. 3. Simulations to explain behaviours seen inFigure 3. a) The simulation is constrained to a vortex state, with artificial defects implanted along the vor-tex core’s path. b) A simulation to probe the torque and magnetization states by extending the fields to achieve saturation in the permalloy magnetization. The cir-cular insets in theτxandτzsectors represent spatial maps of the torque at a) -3,
0 kA/m b) -10, 0, +10 kA/m. The white arrow in the torque spatial maps indi-cates the direction of the DC field. The insets in theτysector show spatial maps
of the magnetization at the same fields. The colour wheel associated with the magnetization spatial maps is the standard CMYK colour wheel.
The corresponding normalized spatial maps of the x- and z-torque components supplement the simulations ofFigure 3. The normalized torque magnitude in each cell is indicated by the colour bar on the right hand side of the figure. White arrows in the maps indicate the direction of the DC field. They-torque mode sectors contain spatial maps of the net magnetization in the permalloy disk, utilizing the standard CMYK colour wheel. The torque maps at zero field inFigure 3aindicate the expected integration to zero torque. Contrarily, the torque maps at -3 kA/m (corresponding to a pinned vortex core) cannot be integrated to zero. The out-of-plane torque at the vortex core is significantly larger than that of the unpinned core. Correspondingly, the net out-of-plane torque in the pinning site has a significant non-zero value, as expected.
These torque and magnetization maps are helpful in visu-alizing the magnetization state throughout the major and minor hysteresis loops, particularly with respect to the more complex magnetization states seen inFigure 2b. The simulation inFigure 3b
involves a pure permalloy disk (i.e. no artificial defects) on a 256 cell wide grid with 5.6 nm cells, initialized in a negatively saturated mag-netization state. The corresponding magmag-netization and torque maps reveal a “transition” magnetization state between the saturation and vortex states. This transition state takes the form of a “cat’s eye,” with two cores located on opposite corners of the disk, between which an oblong region of constant magnetization occurs. The magnetization stays in this configuration over a narrow field range before transi-tioning into the vortex state. This state develops as the magnetization gets trapped on rough pixellated edges of the disk, disallowing the sample from evolving directly into the vortex state from saturation. This transition state causes hysteresis in the vortex state as a result of the difference in magnetization prior to vortex nucleation. This hys-teresis appears as an “opening” of the low-field vortex configuration between the sweep-up and sweep-down in field. This opening is in contrast with the expected vortex behaviour exhibited inFigures 2a
and 3a, where no opening is observed, and is in agreement with behaviour near zero-field inFigure 2b.
The features corresponding to each magnetization state in
Figure 3bshare characteristics with the features noted inFigure 2b. In particular, the slopes in torque during the transition magneti-zation state appear in stark contrast to the saturation behaviour of the sample. The vortex nucleation and annihilation fields are not expected to align between simulation and measurement, due in large part to the absence of thermal contributions in simulation. The similarities noted strongly indicate the existence of the cat’s-eye magnetization state between -4 and -1 kA/m inFigure 2b.
IV. CONCLUSIONS
Measurement of three orthogonal torque axes provides a par-ticularly useful tool to describe the properties of magnetic sam-ples. Comparison with micromagnetic simulation provides a distinct platform with which to confidently describe these properties and their effect on hysteresis loops of the sample.
The technique to simultaneously measure three orthogonal torque components will be put to use as a tool to further inves-tigate behaviours of these sensors. Particularly, the sensor will be studied at low temperatures. The ferromagnetic/antiferromagnetic interface between the permalloy and cobalt oxide layers have exhib-ited exchange bias at low temperatures. Work to investigate this effect is underway, utilizing the measurement of the complete torque vector. Comparison between the behaviours of the sample at the ambient conditions presented here and those at low tem-peratures will be of particular use in the investigation of exchange bias.
SUPPLEMENTARY MATERIAL
See supplementary material for sample fabrication details, scanned signal maps, and thermomechanical calibration data.
ACKNOWLEDGMENTS
The authors gratefully acknowledge support from the Natu-ral Sciences and Engineering Research Council of Canada (RGPIN 04239), the Canada Foundation for Innovation (34028), and the
Canada Research Chairs (230377). The nanomechanical torque devices were created using fabrication tools of the University of Alberta nanoFAB and the National Research Council Nanotechnol-ogy Research Centre.
DATA AVAILABILITY
The data that support the findings of this study are available from the corresponding author upon reasonable request.
REFERENCES
1
K. Beck, “Das magnetische Verhalten von Eisenkristallen bei gewöhnlicher Temperatur,”Zürich Naturforschende Gesellschaft63, 116–186 (1918).
2T. R. Albrecht, S. Akamine, T. E. Carver, and C. F. Quate, “Microfabrication of
cantilever styli for the atomic force microscope,”Journal of Vacuum Science and Technology A: Vacuum, Surfaces, and Films8, 3386–3396 (1990).
3C. Rossel, P. Bauer, D. Zech, J. Hofer, M. Willemin, and H. Keller, “Active
microlevers as miniature torque magnetometers,”Journal of Applied Physics79, 8166–8173 (1996).
4G. P. Heydon, A. N. Farley, S. R. Hoon, M. S. Valera, and S. L. Tomlinson,
“Resonant torque magnetometry: A new in-situ technique for determining the magnetic properties of thin film MFM tips,”IEEE Transactions on Magnetics33, 4059–4061 (1997).
5
J. Brugger, M. Despont, C. Rossel, H. Rothuizen, P. Vettiger, and M. Willemin, “Microfabricated ultrasensitive piezoresistive cantilevers for torque magnetometry,” Sensors and Actuators, A: Physical 73, 235–242 (1999).
6S. Kohout, J. Roos, and H. Keller, “Novel sensor design for torque
magnetometry,”Review of Scientific Instruments78, 1–6 (2007).
7
C. Rossel, M. Willemin, A. Gasser, H. Bothuizen, G. I. Meijer, and H. Keller, “Torsion cantilever as magnetic torque sensor,”Review of Scientific Instruments 69, 3199–3203 (1998).
8
N. Rossi, F. R. Braakman, D. Cadeddu, D. Vasyukov, G. Tütüncüoglu, I. M. A. Fontcuberta, and M. Poggio, “Vectorial scanning force microscopy using a nanowire sensor,”Nature Nanotechnology12, 150–155 (2017);arXiv:1604.01073.
9
S. R. Hoon and A. N. Farley, Torque magnetometric apparatus and method for determining the magnetic moment of a specimen, 2000.
10
G. Hajisalem, J. E. Losby, G. De Oliveira Luiz, V. T. Sauer, P. E. Barclay, and M. R. Freeman, “Two-Axis cavity optomechanical torque characterization of magnetic microstructures,”New Journal of Physics21, 095005 (2019).
11M. Mehrnia, J. Trimble, and J. Berezovsky, “Three-dimensional
frequency-and phase-multiplexed magneto-optical microscopy,”Optics Express27, 33942 (2019).
12
Z. Diao, J. E. Losby, J. A. J. Burgess, V. T. K. Sauer, W. K. Hiebert, and M. R. Freeman, “Stiction-free fabrication of lithographic nanostructures on resist-supported nanomechanical resonators,”Journal of Vacuum Science and Technology B31, 051805 (2013).
13
B. D. Hauer, C. Doolin, K. S. Beach, and J. P. Davis, “A general procedure for thermomechanical calibration of nano/micro-mechanical resonators,” Technical Report,arXiv:1305.0557, 2013.
14J. Losby, J. A. Burgess, Z. Diao, D. C. Fortin, W. K. Hiebert, and M. R. Freeman,
“Thermo-mechanical sensitivity calibration of nanotorsional magnetometers,” Journal of Applied Physics111, 07D305–305 (2012);arXiv:1203.0998.
15
F. Fani Sani, J. E. Losby, Z. Diao, L. C. Parsons, J. A. Burgess, D. Vick, W. K. Hiebert, and M. R. Freeman, “Strong vortex core pinning and Barkhausen-free magnetization response in thin Permalloy disks induced by implantation of 1 ×10⁴ Ga + ions,”Journal of Applied Physics115, 17D131 (2014).
16J. A. Burgess, A. E. Fraser, F. F. Sani, D. Vick, B. D. Hauer, J. P. Davis, and
M. R. Freeman, “Quantitative magneto-mechanical detection and control of the Barkhausen effect,”Science339, 1051–1054 (2013).
17J. A. Burgess, J. E. Losby, and M. R. Freeman, “An analytical model for
vor-tex core pinning in a micromagnetic disk,”Journal of Magnetism and Magnetic Materials361, 140–149 (2014).
18
A. Vansteenkiste, J. Leliaert, M. Dvornik, M. Helsen, F. Garcia-Sanchez, and B. Van Waeyenberge, “The design and verification of MuMax3,”AIP Advances4, 107133 (2014);arXiv:1406.7635.