Supporting Information
Table S1. Collection localities of Ambrosia artemisiifolia in the introduced range (East China: CN-1 ~ CN-10) and the native range (United States:
US-11~US-20).
Region Pop code Populations
Latitude
Longitude
Altitude (m) Biocontrol history
China
CN-1
Tangqiao
29.356
113.419
80
Yes
CN-2
Fulin
28.502
115.968
19
Yes
CN-3
Jingkou
30.299
114.129
61
Yes
CN-4
Yongjiahe
31.115
114.725
56
Yes
CN-5
Wuhan
30.540
114.419
27
Yes
CN-6
Tubuhe
31.255
114.638
49
Yes
CN-7
Yitang
31.138
113.715
55
Yes
CN-8
Chengguan
31.276
114.589
48
Yes
CN-9
Miyun
40.375
116.839
76
No
CN-10
Shenyang
41.813
123.557
51
No
United
States
US-11
Minnesota
46.217
-96.050
364
US-12
Alabama
30.675
-87.591
27
US-13
Arkansas
33.976
-91.413
51
US-14
Florida
30.406
-83.140
20
US-15
Kansas
38.686
-96.493
404
US-16
Maine
44.771
-68.971
109
US-17
Nebraska
40.044
-96.331
428
Table S2. Heritability estimation (h
2) of phenotypic trait and plasticity index of Ambrosia artemisiifolia populations; bold indicates those significant at
P < 0.05. H
e and FIS of each populations from both China and the United States is given in the bottom of the table; bold indicates those significant FISvalues larger than zero.
Source
China United States
CN-1 CN-2 CN-3 CN-4 CN-5 CN-6 CN-7 CN-8 CN-9 CN-10 US-11 US-12 US-13 US-14 US-15 US-16 US-17 US-18 US-19 US-20
Phenotypic trait Growth trait Height 0.36 0.00 0.69 0.11 0.20 0.00 0.00 0.06 0.00 0.42 0.62 0.52 0.51 0.15 0.60 0.47 0.68 0.71 0.74 0.01 Total biomass 0.55 0.16 0.60 0.00 0.24 0.31 0.37 0.00 0.38 0.00 0.58 0.29 0.69 0.00 0.56 0.10 0.63 0.51 0.46 0.60 Stem biomass 0.56 0.24 0.60 0.00 0.20 0.30 0.34 0.06 0.39 0.00 0.61 0.32 0.69 0.00 0.52 0.09 0.56 0.53 0.44 0.57 Reproduction trait Flower biomass 0.25 0.00 0.40 0.23 0.21 0.10 0.19 0.00 0.20 0.45 0.00 0.00 0.32 0.00 0.00 0.19 0.63 0.29 0.36 0.16 Flower density 0.45 0.07 0.64 0.15 0.35 0.00 0.00 0.00 0.05 0.25 0.42 0.00 0.00 0.00 0.31 0.00 0.50 0.00 0.37 0.72 Flower shoot number 0.23 0.17 0.52 0.01 0.18 0.33 0.40 0.00 0.23 0.48 0.30 0.16 0.00 0.00 0.26 0.50 0.69 0.43 0.38 0.40 Seed status 0.00 0.00 0.95 0.83 0.83 0.00 0.20 0.44 0.00 0.87 0.00 0.00 0.00 0.00 0.57 0.00 0.37 0.00 0.93 0.00
China vs. US 0.25 ± 0.03 vs. 0.33 ± 0.03; χ2 = 2.92, P = 0.09
Phenotypic Plasticity Index
PI-height 0.91 0.57 0.70 0.79 0.85 0.69 0.83 0.88 0.90 0.94 0.00 0.77 0.83 0.82 0.95 0.00 0.00 0.66 0.66 0.98 PI-Total biomass 0.88 0.85 0.82 0.97 0.88 0.85 0.83 0.82 0.97 0.77 0.00 0.00 0.96 0.94 0.90 0.29 0.29 0.79 0.89 0.98 PI-Flower biomass 0.98 0.84 0.54 0.74 0.47 0.00 0.99 0.97 0.23 0.64 0.00 0.00 0.00 0.34 0.98 0.92 0.35 0.00 0.00 0.87 PI-stem biomass 0.88 0.88 0.84 0.66 0.89 0.67 0.72 0.92 0.97 0.72 0.19 0.11 0.42 0.94 0.90 0.00 0.35 0.83 0.90 0.99 PI-Flower density 0.17 0.99 0.77 0.00 0.92 0.94 0.87 0.99 0.99 0.61 0.99 0.99 0.00 0.99 0.95 0.99 0.88 0.91 0.93 0.98 PI-flower shoot number 0.26 0.00 0.40 0.83 0.48 0.00 0.73 0.54 0.83 0.74 0.29 0.00 0.99 0.99 0.99 0.79 0.97 0.04 0.45 0.77
China vs. US 0.72 ± 0.04 vs. 0.58 ± 0.05; χ2 = 5.22, P = 0.02
H
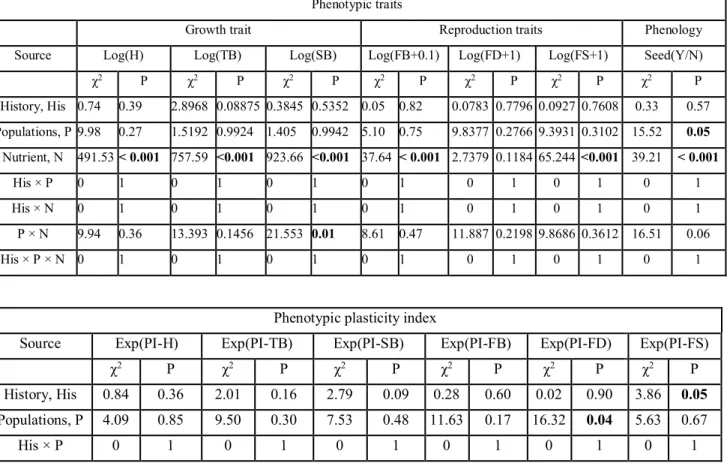
e 0.794 0.717 0.718 0.797 0.626 0.748 0.688 0.777 0.688 0.755 0.694 0.754 0.753 0.693 0.794 0.69 0.743 0.721 0.777 0.798Table S3. Chi-square and P-value of the ML fitted LMMs/GLMMs of the effects of region, populat
ion, nutrient treatments and their interactions on eight phenotypic traits and seven phenotypic plasti
city indices of Ambrosia artemisiifolia.
H: height (cm), TB: total biomass (g), SB: stem biomass (g), FB: flower biomass (g), FD: flower de
nsity, FS: flowering shoot number, Seed: seeds status, PI: plasticity index.
Phenotypic traits
Growth traits Reproduction traits Phenology
Source Log(H) Log(TB) Log(SB) Log(FB+0.1) Log(FD+1) Log(FS+1) Seed(Y/N)
χ2 P χ2 P χ2 P χ2 P χ2 P χ2 P χ2 P Range, R 4.21 0.04 5.68 0.02 5.99 0.01 0.3 0.58 0.08 0.79 2.06 0.15 < 0.001 0.1 Populations, P 62.56 < 0.001 16.27 0.57 21.28 0.27 45.12 < 0.001 37.35 0.005 37.78 0.004 52.98 < 0.001 Nutrient, N 536.35 < 0.001 1326.4 < 0.001 1382.6 < 0.001 79.56 < 0.001 2.09 0.15 122.9 < 0.001 34.77 < 0.001 R × P 0 1 0 1 0 1 0 1 0 1 0 1 0 1 R × N 0 1 0 < 0.001 0 1 0 1 0 < 0.001 0 1 0 1 P × N 51.95 < 0.001 63.68 < 0.001 60.49 < 0.001 31.78 0.03 31.91 0.03 34.06 0.02 34.93 0.014 R × P × N 0 1 0 1 0 1 0 1 0 1 0 1 0 1
Phenotypic plasticity index
Source
Exp(PI-H)
Exp(PI-TB)
Exp(PI-SB)
Exp(PI-FB)
Exp(PI-FD) Exp(PI-FS)
χ
2P
χ
2P
χ
2P
χ
2P
χ
2P
χ
2P
Range, R
2.72
0.1
5.83
0.02
4.32
0.04
0.30
0.58
0.004
0.95
0.02
0.90
Populations, P
29.2
0.05
22.42
0.21
19.85
0.34
22.17
0.23
43.07 < 0.001 17.81 0.47
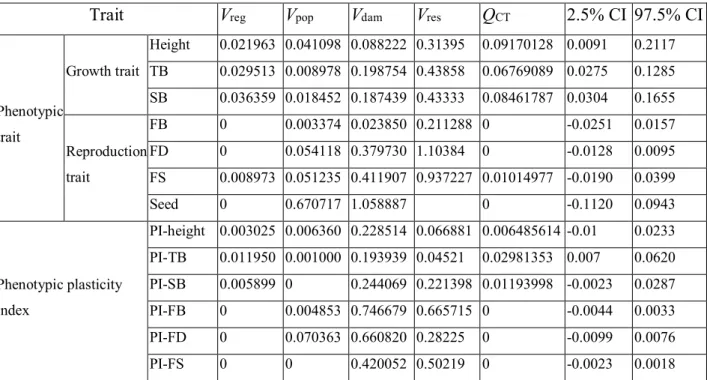
Table S4. Variance components and Q
CT values for eight phenotypic traits and seven phenotypicplasticity indices calculated for 10 invasive (China) and 10 native (United States) populations of
Ambrosia artemisiifolia.
Trait
V
regV
popV
damV
resQ
CT2.5% CI 97.5% CI
Phenotypic
trait
Growth trait
Height
0.021963 0.041098 0.088222 0.31395 0.09170128 0.0091
0.2117
TB
0.029513 0.008978 0.198754 0.43858 0.06769089 0.0275
0.1285
SB
0.036359 0.018452 0.187439 0.43333 0.08461787 0.0304
0.1655
Reproduction
trait
FB
0
0.003374 0.023850 0.211288 0
-0.0251
0.0157
FD
0
0.054118 0.379730 1.10384 0
-0.0128
0.0095
FS
0.008973 0.051235 0.411907 0.937227 0.01014977 -0.0190
0.0399
Seed
0
0.670717 1.058887
0
-0.1120
0.0943
Phenotypic plasticity
index
PI-height 0.003025 0.006360 0.228514 0.066881 0.006485614 -0.01
0.0233
PI-TB
0.011950 0.001000 0.193939 0.04521 0.02981353 0.007
0.0620
PI-SB
0.005899 0
0.244069 0.221398 0.01193998 -0.0023
0.0287
PI-FB
0
0.004853 0.746679 0.665715 0
-0.0044
0.0033
PI-FD
0
0.070363 0.660820 0.28225 0
-0.0099
0.0076
PI-FS
0
0
0.420052 0.50219 0
-0.0023
0.0018
V
reg, variance between regions (China and United States); V
pop, variance among populations within regions; V
dam, four
Table S5. Chi-square and P-value of the ML fitted LMMs/GLMMs of the effects of population,
nutrient treatments and their interactions on eight phenotypic traits and seven phenotypic plasticity
indices of Ambrosia artemisiifolia in the United States. H: height (cm), TB: total biomass (g), SB:
stem biomass (g), FB: flower biomass (g), FD: flower density, FS: flowering shoot number, Seed:
seeds status, PI: phenotypic plasticity index.
Phenotypic traits
Growth traits Reproduction traits Phenology
Source Log(H) Log(TB) Log(SB) Log(FB+0.1) Log(FD+1) Log(FS+1) Seed(Y/N)
χ2 P χ2 P χ2 P χ2 P χ2 P χ2 P χ2 P
Populations, P 31.90 < 0.001 16.71 0.05 21.25 0.01 27.72 0.001 24.10 0.004 22.85 0.007 32 < 0.001 Nutrient, N 163.47 < 0.001 501.65 < 0.001 524.66 < 0.001 42.08 < 0.001 2.41 0.12 57.91 < 0.001 4.82 0.03
P × N 27.37 0.001 27.96 < 0.001 26.54 0.002 23.11 0.006 20.21 0.02 23.45 0.005 11.04 0.27
Phenotypic plasticity index
Source
Exp(PI-H)
Exp(PI-TB)
Exp(PI-SB)
Exp(PI-FB)
Exp(PI-FD) Exp(PI-FS)
χ
2P
χ
2P
χ
2P
χ
2P
χ
2P
χ
2P
Table S6. Chi-square and P-value of the ML fitted LMMs/GLMMs of the effects of population,
nutrient treatments and their interactions on eight phenotypic traits and seven phenotypic plasticity
indices of Ambrosia artemisiifolia in China. H: height (cm), TB: total biomass (g), SB: stem biomass
(g), FB: flower biomass (g), FD: flower density, FS: flowering shoot number, Seed: seeds status, PI:
phenotypic plasticity index.
Phenotypic traits
Growth traits Reproduction traits Phenology
Source Log(H) Log(TB) Log(SB) Log(FB+0.1) Log(FD+1) Log(FS+1) Seed(Y/N)
χ2 P χ2 P χ2 P χ2 P χ2 P χ2 P χ2 P
Populations, P 18.034 0.03 9.20 0.42 8.57 0.48 5.11 0.82 7.48 0.59 9.77 0.37 15.83 0.07 Nutrient, N 484.21 < 0.001 887.14 < 0.001 916.88 < 0.001 37.57 < 0.001 0.36 0.55 64.96 < 0.001 39.21 < 0.001
P × N 9.94 0.36 22.52 0.007 21.55 0.01 8.61 0.47 11.18 0.26 9.87 0.36 16.51 0.06
Phenotypic plasticity index
Source
Exp(PI-H)
Exp(PI-TB)
Exp(PI-SB)
Exp(PI-FB)
Exp(PI-FD) Exp(PI-FS)
χ
2P
χ
2P
χ
2P
χ
2P
χ
2P
χ
2P
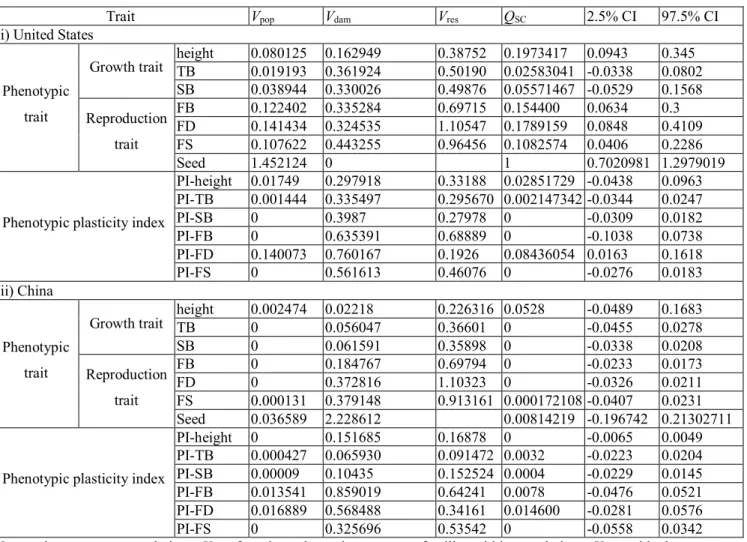
Table S7. Variance components and Q
SC values for eight phenotypic traits and seven phenotypicplasticity indices calculated for 10 populations in each of the native (United States) and invasive
(China) ranges of Ambrosia artemisiifolia.
Trait
V
popV
damV
resQ
SC2.5% CI
97.5% CI
(i) United States
Phenotypic
trait
Growth trait
height
TB
0.080125
0.019193
0.162949
0.361924
0.38752 0.1973417
0.50190 0.02583041 -0.0338
0.0943
0.345
0.0802
SB
0.038944
0.330026
0.49876 0.05571467 -0.0529
0.1568
Reproduction
trait
FB
0.122402
0.335284
0.69715 0.154400
0.0634
0.3
FD
0.141434
0.324535
1.10547 0.1789159
0.0848
0.4109
FS
0.107622
0.443255
0.96456 0.1082574
0.0406
0.2286
Seed
1.452124
0
1
0.7020981
1.2979019
Phenotypic plasticity index
PI-height
0.01749
0.297918
0.33188 0.02851729 -0.0438
0.0963
PI-TB
0.001444
0.335497
0.295670 0.002147342 -0.0344
0.0247
PI-SB
0
0.3987
0.27978 0
-0.0309
0.0182
PI-FB
0
0.635391
0.68889 0
-0.1038
0.0738
PI-FD
0.140073
0.760167
0.1926
0.08436054 0.0163
0.1618
PI-FS
0
0.561613
0.46076 0
-0.0276
0.0183
(ii) China
Phenotypic
trait
Growth trait
height
0.002474
0.02218
0.226316 0.0528
-0.0489
0.1683
TB
0
0.056047
0.36601 0
-0.0455
0.0278
SB
0
0.061591
0.35898 0
-0.0338
0.0208
Reproduction
trait
FB
0
0.184767
0.69794 0
-0.0233
0.0173
FD
0
0.372816
1.10323 0
-0.0326
0.0211
FS
0.000131
0.379148
0.913161 0.000172108 -0.0407
0.0231
Seed
0.036589
2.228612
0.00814219 -0.196742 0.21302711
Phenotypic plasticity index
PI-height
0
0.151685
0.16878 0
-0.0065
0.0049
PI-TB
0.000427
0.065930
0.091472 0.0032
-0.0223
0.0204
PI-SB
0.00009
0.10435
0.152524 0.0004
-0.0229
0.0145
PI-FB
0.013541
0.859019
0.64241 0.0078
-0.0476
0.0521
PI-FD
0.016889
0.568488
0.34161 0.014600
-0.0281
0.0576
PI-FS
0
0.325696
0.53542 0
-0.0558
0.0342
V
pop, variance among populations; V
dam, four times the variance among families within populations; V
res, residual
Table S8. Chi-square and P-value of the ML fitted LMMs/GLMMs of the effects of biological control
history, population, nutrient treatments and their interactions on eight phenotypic traits and seven
phenotypic plasticity indices of invasive Chinese Ambrosia artemisiifolia populations. H: height
(cm), TB: total biomass (g), SB: stem biomass (g), FB: flower biomass (g), FD: flower density, FS:
flowering shoot number, RA: reproductive allocation, Seed: seeds status, PI: phenotypic plasticity
index.
Phenotypic traits
Growth trait Reproduction traits Phenology
Source Log(H) Log(TB) Log(SB) Log(FB+0.1) Log(FD+1) Log(FS+1) Seed(Y/N)
χ2 P χ2 P χ2 P χ2 P χ2 P χ2 P χ2 P History, His 0.74 0.39 2.8968 0.08875 0.3845 0.5352 0.05 0.82 0.0783 0.7796 0.0927 0.7608 0.33 0.57 Populations, P 9.98 0.27 1.5192 0.9924 1.405 0.9942 5.10 0.75 9.8377 0.2766 9.3931 0.3102 15.52 0.05 Nutrient, N 491.53 < 0.001 757.59 <0.001 923.66 <0.001 37.64 < 0.001 2.7379 0.1184 65.244 <0.001 39.21 < 0.001 His × P 0 1 0 1 0 1 0 1 0 1 0 1 0 1 His × N 0 1 0 1 0 1 0 1 0 1 0 1 0 1 P × N 9.94 0.36 13.393 0.1456 21.553 0.01 8.61 0.47 11.887 0.2198 9.8686 0.3612 16.51 0.06 His × P × N 0 1 0 1 0 1 0 1 0 1 0 1 0 1
Phenotypic plasticity index
Source
Exp(PI-H)
Exp(PI-TB)
Exp(PI-SB)
Exp(PI-FB)
Exp(PI-FD) Exp(PI-FS)
χ
2P
χ
2P
χ
2P
χ
2P
χ
2P
χ
2P
History, His
0.84
0.36
2.01
0.16
2.79
0.09
0.28
0.60
0.02
0.90
3.86
0.05
Populations, P
4.09
0.85
9.50
0.30
7.53
0.48
11.63
0.17
16.32
0.04
5.63
0.67
Table S9. Variance components and Q
SC-h values for eight phenotypic traits and seven phenotypicplasticity indices calculated for invasive Chinese Ambrosia artemisiifolia populations with vs.
without biological control history.
Trait Vhis Vpop Vdam Vres QSC-h 2.5% CI 97.5% CI
Phenotypic trait Growth trait Height 0 0.002474 0.022188 0.226316 0 -0.02132 0.021319 TB 0.005041 0 0.038489 0.424797 0.0614598 0.0439 0.09386 SB 0.000633 0 0.060777 0.358985 0.0052 0.0029 0.015 Reproduction trait FB 0 0 0.184767 0.69794 0 -0.0627 0.0518416 FD 0 0.000888 0.217401 0.810011 0 -0.028 0.0154 FS 0 0.000131 0.379148 0.913161 0 -0.005 0.004 Seed 0 0.043847 3.712457 0 0 -0.0882 0.0811
Phenotypic plasticity index
PI-height 0 0 0.151685 0.16876 0 -0.009 0.005 PI-TB 0.000804 0.000140 0.65930 0.091484 0.0061 0.0019 0.0172 PI-SB 0.00259 0 0.10131 0.152565 0.0126196 0.0029 0.0274 PI-FB 0 0.013541 0.859019 0.64241 0 -0.0073 0.0035 PI-FD 0 0.016889 0.568488 0.34161 0 -0.0541 0.0016 PI-FS 0.030845 0 0.28456 0.53622 0.0514119 0.0258 0.0788