Applying Factory Physics to Manual Assembly at an Aerospace Fabrication Site by
Joseph G. Konefal
Bachelor of Science in Mechanical Engineering, Duke University, 2005
Submitted to the MIT Sloan School of Management and the Institute for Data, Systems, and Society in Partial Fulfillment of the Requirements for the Degrees of
MASTER OF BUSINESS ADMINISTRATION AND
MASTER OF SCIENCE IN ENGINEERING SYSTEMS
S
C
In conjunction with the Leaders for Global Operations Program at the Massachusetts Institute of Technology
JUNE 2017
2017 Joseph G. Konefal. All rights reserved.
The author hereby grants MIT permission to reproduce and to distribute publicly copies of this thesis document in whole or in part in any medium now know or hereafter created.
ignature of Author
Signature redacted
MIT Sloan 'School of Management Institute for Data, Systems, and Society
ySignature
redacted
May 12,2017Certified by
Accepted by
Accepted by
I
Dr. Daniel E. Whitney/fhesis Supervisor Senior Lecturer, MIT Leaders for Global Operations
Signature redacted
Dr. Yanchong (karen) Zheng, Thesis Supervisor Assistant Professor of Operations Management, MIT Sloan School of Management
____Signature redacted_______
Dr. John N. Tsitsiklis Clarence J. Lebel Professor of Electrical Engineering, IDSS Graduate Officer
___________Signature redacted__
tMaura Herson Director, MBA Program, MIT Sloan School of Management
MASSACHUSETTS INSTITUTE
OF TECHNOLOGY Cl)
LU
JUN 2
0
2017
Applying Factory Physics to Manual Assembly at an Aerospace Fabrication Site by
Joseph G. Konefal
Submitted to the MIT Sloan School of Management and the Institute for Data, Systems, and Society on May 12, 2017 in Partial Fulfillment of the Requirements for the Degrees of
Master of Business Administration and
Master of Science in Engineering Systems
Abstract
The assembly of welded reservoirs at the Boeing Tube Duct, and Reservoir Center (TDRC) is a traditional batch and queue operation that relies heavily on manual craftsmanship. The
production system experiences high variability in cycle times, high use of overtime, and poor on-time performance. The value provided by the system to Boeing and its customers is characterized by considering the associated costs of late delivery, inventory, labor, and opportunity cost. To understand the system's performance, the system's processes are mapped and modeled using discrete event simulation. The simulation is used to evaluate the benefits of changes to staffing, overtime implementation, and shop floor control. Based on the results of the simulation, lead times are increased to stabilize delivery and a CONWIP system is implemented to improve productivity and reduce overtime costs. Subsequent production data show that these changes are effective and that this framework provides successful strategies for value characterization,
system stabilization, cost reduction, and increases in value creation.
Thesis Supervisor: Daniel E. Whitney
Title: Senior Lecturer, MIT Leaders for Global Operations Thesis Supervisor: Yanchong (Karen) Zheng
Title: Assistant Professor of Operations Management, MIT Sloan School of Management
Acknowledgements
I would like to thank everyone at the Boeing TDRC, particularly Jeff Conway and Paul Larson, for helping me execute a successful internship project.
Thank you to my two academic advisors, Karen Zheng and Dan Whitney, for their guidance and support throughout this experience.
Thanks to my LGO classmates and the LGO community at large for making these my time at MIT a fantastic and fulfilling experience.
Finally, I would like to thank my wife, Kate, for providing unconditional support,
Table of Contents
Abstract ... 3 Acknowledgem ents ... 5 Table of Contents ... 7 List of Figures ... 9 List of Tables ... 10 Glossary of Term s ... I I 1.0 Introduction ... 121.1 Problem Statem ent ... 12
1.2 M otivation ... 12
1.3 M ethodology ... 13
2.0 Background ... 14
2.1 Boeing ... 14
2.2 Tube, Duct and Reservoir Center ... 14
2.3 Hydraulic Reservoirs ... 14
2.4 Sum m ary ... 16
3.0 Key Concepts and Literature Review ... 17
3.1 Theory of Constraints ... 17 3.2 Factory Physics ... 18 3.3 Sum m ary ... 21 4.0 Value Characterization ... 22 4.1 Delivery ... 22 4.2 Labor ... 23 4.3 Inventory ... 23 4.4 Opportunity ... 24 4.5 Sum m ary ... 26
5.0 W elded Reservoir Value Stream - Current State ... 27
5.1 Key M anufacturing Operations ... 27
5. 1.1 W ork Center Operations ... 31
5.1.2 Shared W ork Center Operations ... 32
5.2 M anufacturing Personnel ... 33
5.3 Key Sources of Variability ... 34
5.4 Current Perform ance Characteristics ... 35
6.0 Production System Sim ulation ... 37
6.1 Approach ... 37
6.2 Inputs ... 40
6.2.1 Operation Details ... 40
6.2.2 Absenteeism ... 42
6.2.3 Quality Defects and Rework ... 44
6.2.4 Overtim e Implem entation ... 45
6.3 Benchm arking ... 45
6.3.1 Cycle Tim e Com parison ... 46
6.3.2 Service Level vs. Order Lead Tim e ... 49
6.4 Summ ary ... 49
7.0 Shop Floor Im provem ents ... 50
7.1 Baseline with Increase Lead Tim es ... 50
7.2 Fully Balanced Staffi ng ... 52
7.3 Staffi ng Changes ... 53 7.4 Cross Training ... 54 7.5 CON W IP ... 55 7.6 Sum m ary ... 57 8.0 Implem entation ... 58 9.0 Sum m ary ... 61 9.1 Thesis Conclusions ... 61
9.2 Suggestions for Future W ork ... 62
List of Figures
Figure 2-1. Hydraulic Reservoir Cross-Section... 15
Figure 3-1. Drum-Buffer-Rope... 18
Figure 3-2. Cycle Time vs. Utilization in a System with Variability [8]... 19
Figure 3-3. C O N W IP ... 20
Figure 5-1. Upper Weld Assembly Flow of Operations... 28
Figure 5-2. Lower Weld Assembly Flow of Operations... 29
Figure 5-3. Final Reservoir Assembly (Closeout) Flow of Operations ... 30
Figure 5-4. Cycle Time Cumulative Distribution... 35
Figure 6-1. TDRC Hydraulic Reservoir Production Simulation ... 38
Figure 6-2. Weld Inspection Rework Loops... 45
Figure 6-3. Cycle Time Cumulative Distribution for Large 777 Reservoir ... 47
Figure 6-4. Cycle Time Cumulative Distribution for Small 777 Reservoir ... 48
Figure 6-5. Cycle Time Cumulative Distribution for 777 Reservoirs ... 48
Figure 7-1. Worker Utilization - Case 1 -Baseline... 51
Figure 7-2. Annualized Cost - Case 1 - Baseline Case... 52
Figure 7-3. Case 1 vs Case 2 Cost Comparison... 53
Figure 7-4. Cases 1 through 4 Cost Comparison... 54
Figure 7-5. Cases 1 through 5 Cost Comparison ... 55
Figure 7-6. Application of CONWIP to Welded Reservoir Production System ... 56
Figure 7-7. Cases 1 through 6 Cost Comparison ... 57
List of Tables
Table 2-1. Reservoirs and Part Numbers ... Table 5-1. Manufacturing Personnel Task Priority... Table 5-2. Product Cycle Time Statistics and Service Level... Table 6-1. Reservoir Work Center Operation Details ... Table 6-2. Support Operation Details... T able 6-3. M T T A V alues... Table 6-4. Benchmarking -Average Cycle Time... Table 6-5. Benchmarking - Standard Deviation and Coefficient of Variation ... Table 6-6. Benchmarking - Standard Deviation and Coefficient of Variation ... Table 7-1. Sim ulation C ases ... Table 8-1. Cycle Time Prior to and After Implementation of Shop Floor Improvements ...
16 34 35 41 42 44 46 47 49 50 60
Glossary of Terms
Bottleneck - The resource that determines the capacity of a production system.
CONWIP - Shop floor control method that constrains the work-in-process, or WIP, in a series of production processes.
Customer Service Level - The ratio of the number of instances demand for a product is satisfied on time to number of instances the product is demanded.
Drum-buffer-rope - Shop floor method that uses the bottleneck, or system constraint, to set the pace of the system (drum), ensures sufficient WIP in front of the bottleneck to keep it utilized (buffer), and ties together all processes that precede the bottleneck (rope).
Kanban - Shop floor control method that uses cards to constrain the WIP in a single production process.
Operation Time - The sum of process time and setup time.
Order Cycle time - Actual time from release to completion for a production order. Order Lead Time - Scheduled time from release to completion for a production order. Process Time - Time to complete a given process.
Setup Time - Time required to set up a tool or machine to begin a process.
Shared Work Center - Work center that contains an operation or set of operations that are shared by multiple product lines.
Shared Work Center Cycle Time - Time between completion of prior operation and completion of final shared work center operation for a given order.
Work Center - Area composed of work stations and factory personnel dedicated to a specific type of product.
Work Station - Location within a work center where a particular operation is performed.
1.0 Introduction
This Chapter is an overview of this research including the problem, research motivations, objectives, and methodology.
1.1
Problem Statement
The Boeing Tube Duct, and Reservoir Center (TDRC) supplies components to airplane programs. The assembly of hydraulic reservoirs at the TDRC is a traditional batch and queue operation that relies heavily on manual craftsmanship. The system experiences high variability in cycle times, high use of overtime, and poor on-time performance. The objective of this work is to identify and implement a scheduling, staffing, shop floor control, and performance management strategy that stabilizes and optimizes system performance and provide a foundation for
continuous improvement. Stabilizing the system is defined as ensuring consistency of product delivery and customer satisfaction. Optimizing the system is defined as maximizing the value provided by the production system to Boeing and its customers. Improvement is defined as an increase in the value that the production system provides.
1.2
Motivation
Boeing Commercial Airplanes (BCA) is facing increased competition in the aviation
marketplace. To meet this challenge, BCA has identified several "Keys to Winning". This work addresses two of these items, delivery discipline and competitive pricing, as related to the production of hydraulic reservoirs. Stabilizing the hydraulic reservoir production system improves delivery discipline. Optimizing the system reduces costs and allows for more
competitive pricing and also provides an approach for characterizing and quantifying that can be used to guide continuous improvement efforts. Continuous improvement allows for reduction in costs due to increased throughput and/or reduced capacity, lead time, and inventory.
In addition to increasing the TDRC's and BCA's delivery discipline with respect to hydraulic reservoirs, this work provides a framework for improving performance of a production system that can be applied elsewhere at Boeing Fabrication.
1.3 Methodology
The project is performed in four phases: value characterization, system modeling, control improvements, and implementation.
Value characterization is performed by identifying and assessing the costs associated with the performance of the production system. This effort includes interviews with factory management and customers and analysis of costs associated with inventory, labor, and late delivery. In this instance, the customers of the production system are the Boeing airplane programs and are therefore internal to Boeing. The opportunity cost of the people, equipment, and other infrastructure that is used by the production system is also considered.
The system modeling phase involves developing a discrete event simulation of the reservoir production system. The scope of this model includes all processes and workers in the reservoir work center. Process times are input based on worker feedback and manufacturing data. Worker absenteeism is modeled based on attendance records. Quality non-conformances and rework are modeled as rework loops at appropriate locations. Rejection rates are input based on
manufacturing data. Logic in the model triggers worker overtime based on traditional management practice. Support activities are modeled as additional cycle time according to a
distribution based on manufacturing data. The model is capable of performing various forms of scenario and sensitivity analysis. It is benchmarked using historical production data. As part of this phase, the simulation model is used to determine the manufacturing lead times that ensure
customer satisfaction.
In the control improvements phase, the benefits of changes to shop floor control, such as work-in-process (WIP) control, cross-training, work prioritization, and overtime strategies are
determined using the simulation model. These benefits are compared to any associated costs, and improvements are recommended accordingly.
The implementation phase includes the development of management tools to implement new staffing, lead time, and control measures and evaluate their effectiveness. These tools display key work status and performance indicators. They are monitored, with daily follow-up to encourage operator problem solving to improve system performance. The system's performance is
2.0 Background
This Chapter provides relevant background on The Boeing Company, the TDRC, and hydraulic reservoirs.
2.1
Boeing
Boeing is the world's largest aerospace company and leading manufacturer of commercial jetliners and defense, space and security systems. The company has two primary business units:
Boeing Commercial Airplanes (BCA) and Defense, Space & Security.
BCA currently manufactures the 737, 747, 767, 777 and 787 families of airplanes and the Boeing Business Jet range. The 747, 767, 777 and 787 families are assembled and delivered in Everett, Washington [1].
Boeing Fabrication provides key manufacturing and assembly capabilities and technologies to BCA. Fabrication has 11 manufacturing sites across three countries. The Auburn, Washington Fabrication site has eight manufacturing business units, including the TDRC.
In addition to production operations, Fabrication works with Engineering to develop new manufacturing capabilities that enable the introduction of new product development concepts.
2.2
Tube, Duct and Reservoir Center
The TDRC produces tubes, aluminum and hard-metal welded duct assemblies, dip-brazed assemblies, hydraulic reservoirs, and hydraulic units for BCA programs. The tubing and ducts are used in several different systems and applications on the airplanes. The hydraulic reservoirs store hydraulic fluid that actuates critical aircraft systems such as landing gear and flight controls. The TDRC also provides out-of-production spares and critical emergent parts for final assembly. The factory contains several critical manufacturing capabilities, such as tube bending, pullouts, welding, heat treatment, chemical treatment, and paint.
2.3
Hydraulic Reservoirs
Hydraulic reservoirs supply hydraulic fluid to the hydraulic power system. The hydraulic power system operates several mechanical devices on an aircraft. A cross-section sketch of a hydraulic
reservoir and its key components is provided in Figure 2-1. The reservoirs are fabricated by making and joining three separate parts, an upper weld assembly (upper), a lower weld assembly
(lower), and a gravity trap (g-trap).
Upper
Lower
Fittings
Gtrap
Figure 2-1. Hydraulic Reservoir Cross-Section,
The upper and lower parts are assembled from aluminum forgings, which are supplied to the TDRC by an outside vendor. The forgings are trimmed and then annealed. For certain part numbers, rings are welded on the forgings with a girth weld. Fittings are attached to the forgings by drilling out holes in them, pulling out penetrations, setting up the fitting and then welding. The welds are then inspected via x-ray. Next the parts are heat treated, formed back into shape (straightened), deoxidized, and checked for hardness. Finally, the fitting welds are inspected via dye penetrant testing. Throughout this process, geometric inspections are performed.
The g-trap is fabricated by initially deoxidizing the supplied parts, followed by a series of assembly steps that include riveting and welding.
A reservoir is assembled by starting with an upper, lower, and g-trap. First, the upper and lower are fitted up to determine any trimming that is required to yield an appropriate reservoir height.
The upper is then trimmed while the g-trap is fitted and welded into the lower. The upper and lower, with g-trap inside, are then fitted and welded together. The new girth weld is inspected via x-ray and dye penetrant testing and then heat treated. The assembled piece is then checked for material hardness, pressure tested, dried, and painted. Following painting, brackets and other components such as a relief valve and site glass are installed on the reservoir.
Table 2-1 shows reservoir part numbers and corresponding upper, lower and g-trap part numbers for different airplane programs. For the 747, a shipset includes four reservoirs. The 767 has two distinct shipsets, one for the freighter 767 and one for the tanker 767. A 777 shipset consists of three reservoirs.
Table 2-1. Reservoirs and Part Numbers
Takt Time Reservoir Part Takt Time Lower Part Takt Time Upper Part Number Takt Time Gtrap Part Takt Time
(M-Days) Number (M-Days) Number (M-Days) (M-Days) Number (M-Days)
271W3104-1 2.5 271W3105-3 2.50 271W3105-2 2.50 271W3106-5 2.22 777 2.5 271W3108-8 2.5 271W3109-3 1.25 271W3109-2 1.25 271W3110-6 1.25 _______ _______271W3108-11 2.5 _______________________ __________ 271T5212-63 20 271T5211-15 5 271T5211-3 10 271T5219-15 5 767Tanker 20 271T5212-64 20 271T5211-4 10 271T4521-7 20 271T4522-9003 20 271T4522-2 20 271W3106-5 -767 271T5212-59 20 271T5211-15 - 271T5211-3 - 271T5219-15 -Freighter 20 271T5212-60 20 271T5211-15 - 271T5211-4 -_7T__-1_ 271T0115-12 20 271T4551-9 20 271T4551-10 20 271T0110-10 20
271U3001-11 20 271U3110-9013 10 271U3110-2 10 271U3110-4 10
747 20 2130-2 2
271U3002-16 20 271U3210-9016 10 271U3210-2 10 271U3210-4 10
_______ _______271U3002-19 20 ______ ____ _______ _________ ____
2.4
Summary
In summary, the TDRC, a factory within Boeing's Fabrication Division, provides tubes, ducts, and reservoirs to the Boeing airplane programs. The scope of this work is limited to the
production of the hydraulic reservoirs for the 777, 767 and 747 programs. A work center in the TDRC is devoted to these products. Three subassemblies, the lower, upper, and g-trap, are assembled at the TDRC. The final assembled reservoir is then assembled from the three subassemblies. The 777 reservoirs are the highest volume products under consideration. A shipset of 777 reservoirs (one large reservoir, two small reservoirs) is produced every 2.5 manufacturing days, compared to shipsets of 767 and 747 reservoirs, which are produced monthly.
3.0 Key Concepts and Literature Review
This Chapter provides a description of key operations management and manufacturing concepts that are pertinent to the work described herein. A review of relevant research and literature is
also included.
The introduction of the industrial revolution and machine technology brought with it the need to develop methods of managing production processes that take place in factories. Over the last two hundred years, several manufacturing management strategies and theories have been proposed
[2]. Two relatively recent proposals are theory of constraints (TOC) and factory physics.
3.1 Theory of Constraints
Gupta and Boyd contend that TOC "provides a broad framework for viewing the relationship between operations management and the whole firm" and "that TOC concepts address many of the traditional concepts of operations management from a more unified perspective" [3]. TOC focuses on the constraints of a system and aims to exploit those constraints to increase the rate at which the goal of the organization is achieved. In a for-profit manufacturing organization, the goal of the firm is not simply to reduce cost but to "make more money" [4]. In TOC, the term "bottleneck" is replaced by "constraint". TOC defines a constraint as anything that limits a firm's ability to increase the rate at which it achieves its goal.
Goldratt [4] provides five steps for managing a system's constraints:
1. Identify the system's constraint, or resource that determines the capacity of the system. 2. Decide how to exploit the system's constraint (determine how to improve the capacity of
the constraint).
3. Subordinate the rest of the system to the decisions made above (prioritize this strategy). 4. Elevate the constraint (prioritize communication of the constraint's status).
5. Go back to Step 1.
TOC proposes drum-buffer-rope (DBR) as a shop floor control methodology [5]. DBR is shown pictorially in Figure 3-1. In this approach, the "drum" provides the cadence, or rate, of the system. The drum is therefore the system's constraint. The "buffer", which is work-in-process, protects the drum against any disruptions due to variability. It is important that a buffer be in
front of the constraint so that it is not starved. Starving the constraint starves the throughput of the entire system. The rope is the mechanism that moves materials through the system in unison, tying the drum together with upstream processes. In other words, materials is pulled into the system by the rope at the rate at which the drum is beating, or producing. Therefore, the production schedule must be compatible with the capacity of the drum.
System Constraint (Drum)
Rope
Raw Process 1 - + Process 1 BufrProcess 3 --- Process 4.
Figure 3-1. Drum-Buffer-Rope
TOC prioritizes three measures in order of importance: throughput, inventory, and operating expense. Because throughput is most important, TOC recognizes the need for excess capacity at processes that are not constraints [2]. The required amount of excess capacity required is
dependent on the amount of variability in the production process.
In TOC, the purpose of inventory (raw material, WIP or finished goods) is to protect the
throughput of the system. Having too little inventory can starve the constraint or other resources. Too much inventory takes up space and complicates movement and tracking of materials in the factory. For firms that make to stock and compete on order lead times, higher finished goods inventory increases a firm's competitiveness. For firms that make to order and compete on order lead times, higher WIP increases cycle times and decreases the firm's competitiveness.
3.2
Factory Physics
Factory Physics [6] is a textbook that attempts to provide a basis for the behavior of
manufacturing systems and an approach for managing them. The text presents several "laws" of factory physics, one of which addresses variability [7]. The more variability in a manufacturing system, the poorer the system performs. The presence of variability requires the use of buffers to achieve consistent output. In a manufacturing system, buffers can take one of three forms: 1) capacity, 2) lead time (or WIP), and 3) finished goods inventory [8].
As an example of how these buffers are related, consider the curve shown in Figure 3-2, which shows cycle time as a function of utilization. All manufacturing systems behave in accordance with this figure. Cycle time increases with respect to utilization. In other words, as the capacity buffer decreases, (utilization increases) a larger lead time buffer is required. This increase is non-linear, and at a certain point, becomes highly unstable and difficult to predict. The point at which this occurs is dependent on the amount of variability in the system. The more variability, the lower the utilization at which this instability occurs.
U
Cl)
20%
40%
60%
80%
100%
Utilization
Figure 3-2. Cycle Time vs. Utilization in a System with Variability [8]
The optimal type and amount of buffer are dependent on the nature of the manufacturing system and its customers. Therefore, it is important to define and quantify value as it exists relative to the manufacturing system. Then, one can analyze the system and choose the right buffers to maximize the rate at which value is output from the system. This concept is no different from the recommended strategy of TOC, which is to provide sufficient capacity and inventory buffers to ensure desired throughput, so as to maximize the rate at which the goal (making money) of the system is achieved.
As part of the factory physics approach, Spearman, Woodruff and Hopp propose a CONWIP, or constrained WIP, system as an effective shop floor control method [9]. Push systems, in which orders are pushed onto the shop floor by a materials resource planning (MRP) or enterprise
U
--resource planning (ERP) system, are very popular in U.S. factories. The TDRC, in fact, uses an ERP system. Pull systems, which authorize production based on the performance of the system, are less popular. The most well-known pull system is a Kanban, in which cards are used to limit the WIP of a particular part number between one production process and the next. A CONWIP
system is similar to Kanban in that WIP is limited and is therefore a pull system. In a CONWIP system, however, production authorization is not part specific and is not necessarily based on the WIP between two production processes. CONWIP systems can limit WIP between multiple production processes. A basic CONWIP system is shown in Figure 3-3. Work can be scheduled and "pushed" to the start of the system based on demand using an MRP or ERP system, but release of work is authorized according to the output of the last process in the CONWIP loop.
WIP Release Signal
Yeu Process 1 Process 2 - Process 3 -- +1Process 4 Process 5-+ Process 6
Figure 3-3. CONWIP
In a CONWIP system, a maximum WIP level, m, is determined and applied. The appropriate m level can determined by analysis (simulation) or by simply setting a level and evaluating its effectiveness. Choosing an m level that is too low will reduce throughput too much. Choosing an m level that is too high will result in unnecessarily high inventories. Spearman, Woodruff and Hopp recommend setting an m level that is higher than what might seem necessary and then lowering it from there.
A capacity shortage trigger, or r value, is also applied. This is the size of the start queue at which additional capacity (usually overtime) is applied.
CONWIP has several advantages versus a traditional push MRP system. First, cycle times for orders are more predictable. Second, limiting WIP causes work to amass at the bottleneck and may starve non-bottleneck activities. This phenomenon encourages cross-trained workers to spend less time overproducing on non-bottleneck activities and instead move to more productive work. Finally, CONWIP provides immediate feedback on a system's capacity, allowing for targeted additional capacity and other problem solving, if necessary.
3.3 Summary
Both TOC and the factory physics approach provide production management methodologies that emphasize the following:
" Understanding the value that the system is trying to maximize.
" Determining and providing appropriate buffers (staffing, order lead time) that maximize value creation.
* Implementing a shop floor system that effectively paces and manages the system's constraints.
The work described herein will integrate TOC and factory physics by implementing these concepts.
4.0 Value Characterization
This Chapter describes the approach used to determine the value provided by the welded reservoir production system to Boeing. Value is broken down into four categories: delivery, inventory, labor, and opportunity.
4.1
Delivery
The value of delivery is defined as the cost saved and/or revenue gained by Boeing as a result of reliably delivering a quality product. There are several costs associated with late delivery of a reservoir. These include:
1) Expediting - The TDRC has a staff of expediters that track and communicate the progress of late work orders through the factory and out to the customer. Each airplane program, or customer, has an additional staff of expediters with similar responsibilities. 2) Overtime - Late work often requires overtime labor, either at the TDRC or at airplane
assembly, to catch up on schedule.
3) Waste - Late products to the airplane assembly line can delay other tasks, thereby reducing the utilization of mechanics and wasting their time.
4) Delayed cash flow and revenue recognition - If reservoir is late enough, it can delay the airplane delivery schedule, which delays cash transfers and revenue recognition.
5) End-customer dissatisfaction - Airlines that receive aircraft late will be more likely to turn to other options for their next fleet of planes.
6) Increased Program Lead Times - To compensate for chronically late delivery of certain parts, airplane programs increase order lead times and buffers, which ties up capital and requires additional storage.
7) Loss of Work Statement - To find a more reliable source of reservoirs, the airplane programs may turn to a more expensive external supplier, thereby increasing costs for
Boeing.
A quality non-conformance found on a delivered reservoir has similar types of consequences, though the magnitude can be much greater depending on the timing of the discovery of the defect.
To understand these costs, representatives from materials management, supply chain, and
production management for both the TDRC and the airplane programs were engaged. From these discussions, it was determined that the effects of late delivery are very extensive and difficult to quantify, but the cost vs. number of days late increases exponentially.
Rather than attempt to quantify the value of supply reliability, the approach used herein is to treat supply reliability as a constraint. In other words, customer satisfaction (the right part, with the right quality, at the right time) must always be achieved. This will avoid or reduce many of the costs associated with poor supply reliability. It also focuses factory management by providing a primary goal (customer satisfaction) and then allowing other aspects of value to be considered separately.
4.2 Labor
The cost of labor required to produce the demanded amount of reservoirs is considered when assessing the value of labor. In this analysis, the cost of labor is assumed to be $50/hour. For a staff of 15 operators and mechanics working 40 hours a week, 48 weeks a year, this equates to $96,000 annually in labor costs per employee, or $1.44 MM in total labor costs. This value is an approximation to demonstrate the magnitude of labor cost relative to other costs described in this chapter. It does not account for other factors such variation in the amount of leave taken or use of overtime labor. In this evaluation, overtime labor costs twice that of standard labor, or
$1 00/hour.
4.3 Inventory
The cost of holding inventory includes the opportunity cost of the tied up capital, the cost of storage, and the cost of obsolescence. An annual inventory holding cost rate of 10.5% is assumed. The cost of storage is very low and is not considered. The cost of obsolescence is nearly zero and not considered because each ordered part has a committed customer. Therefore, a rate of 10.5%, a rate that is typically used by Boeing and one that is in line with costs of capital for large industrial companies, is assumed. The average material cost for a reservoir is
approximately $20,000. Therefore, the average inventory holding cost for a reservoir is:
The average lead time for the welded reservoir production system is 5.25 weeks. The daily demand is 1.7 reservoirs per manufacturing day (mday). Therefore, the average WIP is:
mday reservoirs
WIPave = 5.25 weeks * 5 rna* 1.7r = 45 reservoirs
week mday
The approximate holding cost associated with reservoir WIP is therefore:
C1_wip = C1 * WIPave = $94,500 per year
4.4
Opportunity
The opportunity cost associated with the welded reservoir production system is the value that could be added (or cost saved) by putting a resource currently employed in the production of welded reservoirs toward an alternative pursuit. Such resources could include machines,
employees, or floor space. In this analysis, the value added due to increased available floor space is considered. This resource has the most value that can be transferred to other opportunities. This is because it allows Boeing to take advantage of all the different knowledge and capabilities at the TDRC, including materials management, supplier management, manufacturing
engineering, and quality engineering, in making use of available space.
The potential value, or opportunity cost, of floor space at the TDRC was estimated by
considering a new statement of work. The TDRC was in the process of proposing to take on 787 tubing production. These tubes are currently being produced by an outside vendor at a cost,
Cvendor, of approximately $10 MM per year. The estimated cost for the TDRC to produce these
tubes, using Boeing cost estimating methods, Cfr, is approximately $7 MM per year. This estimate includes depreciation expenses for tube bending machines and other capital equipment required for the statement of work. It also, however, includes fixed costs of the TDRC that
currently exist, such as engineering and maintenance staff. Based on discussions with TDRC management, a conservative estimate is that 80% of the $ 7 MM cost estimate is variable and the
other 20% is fixed. Therefore, the actual additional cost to Boeing by introducing the 787 tubing statement of work is:
CTDRC= Cfv * 80% = $5.6 MM/year
The value to Boeing from moving the 787 tubing statement of work from an outside vendor to the TDCR is therefore:
V7 87 = CTDRC - CVendor = $4.4 MM/year
The required floor space to implement the 787 tubing statement of work with an entirely new set of machines and tooling, F787, is approximately 2500 square feet. Based on the 787 tubing
opportunity, the value of floor space at the TDRC is then:
V7 8 7
VF = F77= $1760 per sq. ft. per year
F787
In reality, the value provided by available floor space for an opportunity is a step function, where the value of the opportunity is zero until a certain amount of space is available. At that point, the value increases from zero to the value of the project. For the 787 tubing statement of work, if 2499 square feet of space or less are available, the value of that space is zero. If 2500 square feet or more are available, the value is $4.4 MM per year.
In this assessment, however, the value provided by opportunities for the TDRC to use its space is assumed to increase linearly with each available square foot. This approach is used to provide a generic value for space in the TDRC and to increase the incentive for factory managers to optimize their use of space. The 787 tubing statement of work is a representative opportunity. Other opportunities may require less space. Therefore, managers should always be looking to decrease usage of space. This approach provides a value that can be used to trade off of other management decisions.
This analysis only considers the cost of the floor space occupied by the reservoirs as they are worked. Therefore, increases in order lead time increase WIP, which increases floor space, or opportunity, cost. Decreases in order lead time decrease WIP, which decreases this cost. Based on review of the reservoir storage containers, each reservoir in-process is assumed to occupy 15 square feet of floor space. The approximate opportunity cost of a single reservoir held in
inventory is therefore:
Co = VF * 15 = $26,400 per year The approximate opportunity cost of the reservoir WIP is therefore:
4.5
Summary
Delivery reliability, either due to a missed schedule or poor quality, is the highest priority for the airplane programs as customers of the welded reservoir production system. Customer service is therefore treated as a constraint and other costs are minimized from this starting point. Labor
costs are the largest and most apparent costs associated with the production system. Inventory costs are more than an order of magnitude smaller. The significance of opportunity cost, as estimated here, is comparable with labor cost. This cost, however, is not as visible to TDRC management and is more difficult to quantify.
5.0
Welded Reservoir Value Stream
-
Current State
This Chapter describes the current state of the manufacturing operations required to produce welded reservoirs within the TDRC. Key sources of variability in the value stream are identified and discussed. Current system performance characteristics are defined.
5.1 Key Manufacturing Operations
Charts that describe the flow of operations for the processes used to produce uppers, lowers, and closeouts are shown in Figure 5-1, Figure 5-2, and Figure 5-3. The charts also include daily demand by part number. The workflow described in these charts is used in a simulation of the welded reservoir manufacturing system (see Chapter 6).
Key operations are listed and described below. The operations are divided between those that are performed in the welded reservoir work center and those performed in shared work centers. Figure 5-1, Figure 5-2, and Figure 5-3 indicate this distinction among different operations. For welded reservoir work center operations, the figures specify the worker with primary
All 747 saw CT 75--SawOperatvr Fittings M echanics iAll 767 Welder Dip -- ---Braze Pulout Operator
Shared Work Centers '
Fl~ttegiPart Lbrk
.[FIt1n
rI~ldJ271W3109-2
5-n
Gai Demandby PN Dai Demad ze De otal Dilyema
271W3105-2 0.40 La e 777 0.40
27IW3109-2 0.0 small 777 O.Se 7 1.2
271T4551-10 0.01 Large Commercial 767 0.06 27175211-3 0.10 Small WA 767 0.3 1.7 27175211-4 0.10 Commerda anker 27174522-2 0.05 Large anker767 0.05 271U311o-2 0.10 small 747 0.10 74T 0.2 271U3210-2 0.10 Large 747 0.10 1 IPart n t rk ... ,...
Figure 5-1. Upper Weld Assembly Flow of Operations
0
r
t
Additional steps after x-rayfor 767 small-assemble. weld, inspect
Release Iasue Ssaw S4w:0peIBWr Fittings Mechanics Welder AJ 767 Lowers Pulold Operator
Shared Work Centers
AnneaJ Weld Girth Weld SPact Pum Iutu Wel I W1 Pa2 Straighten
**Pact X0Ray HOea
Fitkge Treat
Daily Demand byPN DalyDemand byProgram!iuze Daily Demand by Progam Total Daily Demand 271W3105-3 040 Large 777 0.40 77T 1.2 271W3109-3 0.80 mal 777 0.80 271T4551-9 005 Large Commercial767 0.05 271T4522-903 0.05 L eTanker 767 0.05 M 0.3 1.7 2715211-15 0.20 mal Commewcal767 0.10 ma Tanker767 0.10 271UB110-013 0.10 ma 747 010 271U3110-916 0 05 L ge 747 0. I 7T I Par M ~~ff
Additional steps after x-rayfor 767 smaI -assemble, weld, inspect
Figure 5-2. Lower Weld Assembly Flow of Operations
Release Issue Measr OIGT i i UPR DilT-COOp DilT-COOp.2 STr.UPR -Saw Operator
i
WeierBracket Mechanic 1 Bracket Mechanic 2
i
PressureTest OperetorBuildu Mechanic
Shared Work Centers
RhPLWR-AewrGT UPR Prt Mark
GTWR
LPJ
St,rais- frsckeeng
Pmr.e Dry - Sand
Pusdvn x-ey I eins Pe
...
Figure 5-3. Final Reservoir Assembly (Closeout) Flow of Operations
3en
c ker OC
02 m32
-2r 0.3L-2 0.2
5.1.1 Work Center Operations
Trim - An operator uses a fixed saw to trim the upper and lower forgings that are provided from vendors. The operation includes measuring the height of the forgings to determine the
appropriate location of the trimming operation, setting up the trimming fixture, and the actual trimming process with the saw. For certain assembly orders, the saw is also used to trim the upper to ensure a proper fit-up with the lower section.
Pullout - An operator drills holes in the upper and lower domes and then uses pneumatic cylinders to pull out penetrations to engineering specifications. These operations are performed on a large fixture that is place on top of the domes. The fixture has holes for drilling and pulling out in the appropriate locations depending on the part number.
Welding - Welding is used to join cylindrical shells (girth welds) and to attach fittings to pullouts. Girth welds are performed using a dedicated machine, while fitting welds are applied by hand.
Fittings - Mechanics use customized tooling to place fittings onto the pullouts of lowers and uppers. Once the geometry is correct, the fittings are tack-welded in place and delivered to the welder.
Part Mark - At various points, mechanics affix markings to parts to indicate part number and order number.
Straighten - A mechanic uses tooling to remove distortions that occur in assemblies after they undergo heat treatment.
Closeout Operations - Closeout operations consist of all actions required to join the upper, lower, and g-trap. This includes:
- Assessing the fit between the upper and lower and delivering the upper to the saw for trimming (certain part numbers only)
- Drilling, riveting and fitting the g-trap inside the lower and delivering the lower/g-trap to the welder for welding
- Fitting the upper and lower/g-trap together and delivering the assembly to the welder for welding
Pressure Test - Pressure testing is performed to ensure the mechanical integrity of the reservoir pressure boundary. Water is pumped into the reservoir up to a pressure of 125 psig. After testing, the reservoir is rotated via machine and allowed to drain. The reservoir is then hooked up to a drier for two hours to ensure that all surfaces are dry.
Bracketing - Brackets are fastened onto the flanges of the reservoir. These brackets are used for installation of the reservoir inside the airplane.
Build-up - Final markings and devices, including a sight glass and a safety relief valve, are installed on the reservoir during build-up.
5.1.2 Shared Work Center Operations
Release - A capacity planner releases a subassembly (upper, lower, g-trap) or assembly (747, 767, 777 reservoir) order. This release is performed in accordance with the start date of the order. The start date of the order is determined based on the order lead time. For example, if a particular g-trap has an order lead time of 6 days, then the start date for an order of that g-trap would be 6 manufacturing days prior to the planned finish date. For each part number, there is a three manufacturing day time buffer between the finish date and the actual customer need date. Issue - A material mover issues requested material for an order. This operation occurs after the release of an order to issue initial materials. It also may occur at other times when additional parts require issue. For example, brackets are issued prior to the bracketing operation for reservoir assemblies.
Quality Inspections - A quality inspector is dedicated to the welded reservoir production work center and performs inspections at various points. These inspections ensure appropriate
geometries, orientations, and assembly.
Anneal - Annealing is performed to increase the ductility and reduce the hardness of the upper and lower material, making it more workable and allowing for downstream pullout processing to occur. As part of this process, each of the trimmed upper and lower forgings is placed in a furnace and heated for four hours. The parts are cooled for an additional ten hours.
X-Ray - Each weld is examined via x-ray to ensure that no defects that could harm the structural integrity or fatigue life of the weld are present.
Heat Treat/Age - After welding, assemblies are heat treated to stress-relieve welds. This operation is performed in a furnace where parts of batched and then heated for up to six hours. Hardness Testing - Heat treated parts are cooled back to room temperature and then tested to ensure that the hardness of the material is sufficient. This ensures that material strength has not been lost due to heat treatment.
Penetrant Testing - Each weld is examined via dye penetrant testing to ensure that no defects that could harm the structural integrity or fatigue life of the weld are present.
Tank Lines - After heat treatment and hardness testing, uppers and lowers are cleaned, or deoxidized, using a series of chemical treatments. Prior to painting, reservoirs are given alodine chemical treatment.
Painting - Assembled, pressure-tested reservoirs are painted in a booth prior to bracketing.
5.2 Manufacturing Personnel
Table 5-1 provides a list of manufacturing personnel in the welded reservoir work center. The table includes the operator or mechanic's primary task and other tasks for which he/she is cross trained.
Table 5-1. Manufacturing Personnel Task Priority
Operator/Mechanic Primary Task Secondary Task Tertiary Task
Welder Welding
-Saw Operator Saw
-Pullout Operator Pullout
-Fittings Mechanic 1 Fittings
-Fittings Mechanic 2 Fittings Weld Prep
-Fittings Mechanic 3 Weld Prep Fittings
-Fittings Mechanic 4 Straighten Fittings
-Gtrap Mechanic Gtraps Fittings Weld Prep
Team Lead Part Mark
-Closeout Mechanic 1 Closeouts
-Closeout Mechanic 2 Closeouts
-Bracket Mechanic 1 Bracketing Buildup
-Bracket Mechanic 2 Bracketing
-Pressure Test Operator 1 Pressure Test
-Buildup Mechanic 1 Buildup Pressure Test
-5.3 Key Sources of Variability
Based on observation and feedback from operations personnel, three critical sources of variability in the welded reservoir production system are:
1. Absenteeism - Vacation time is planned and limited by management. Sick time and family leave, however, are unplanned and can disrupt production. Many operators have multiple decades of experience and have accumulated a large amount of sick time. In addition, operators without sick time are free to take unpaid family leave without providing warning to management.
2. Shared Work Center Cycle Time - Operators and production managers feel that there is uncertainty as to when processing of a part in a shared work center will take place and when that part will return to the welded reservoir work center. This concern is valid, as other work centers compete with the welded reservoir work center for shared work center
capacity. Inconsistencies in performing and prioritizing work in shared work centers leads to added cycle time variability. For example, if work in another work center is
farther behind than welded reservoir orders, a shared work center may prioritize the late work. Other shared work centers, however, may prioritize work according to first in first out (FIFO).
3. Rework due to failed weld inspections - X-ray and dye penetrant inspections of lower fitting welds occasionally reveal unacceptable weld cracking. These findings result in rework, which ties up operator and welder capacity and increases the cycle time and cycle time variability of the lowers.
5.4
Current Performance Characteristics
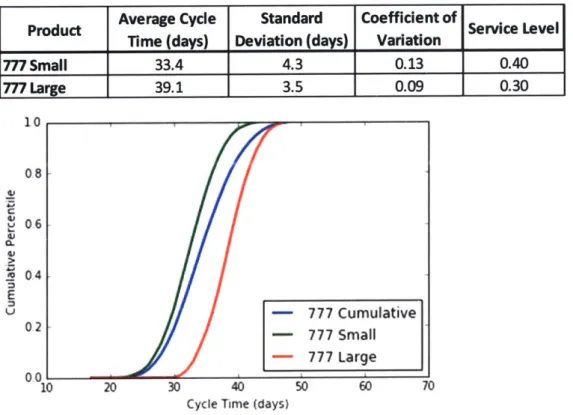
In this section, cycle time distributions, customer service level, and overtime usage for January 4, 2016 through June 6, 2016 are provided. Table 5-2 provides average cycle time, cycle time standard deviation, and coefficient of variation, and customer service level for the small 777 and large 777 reservoirs. Figure 5-4 shows cycle time cumulative distribution for small 777 and large 777 reservoirs. The percentage of tasks completed on weekends is used to represent overtime usage. This value is approximately 5%.
Table 5-2. Product Cycle Time Statistics and Service Level
Product Average Cycle Standard Coefficient of Service Level
Time (days) Deviation (days) Variation
777 Small 33.4 4.3 0.13 0.40 777 Large 39.1 3.5 0.09 0.30 10 0.8 C V a. I, E U 0.61-0.4 0.2 00 L 10 - 777 Cumulative - 777 Small - 777 Large 20 30 40
Cycle Time (days)
50 60 70
Figure 5-4. Cycle Time Cumulative Distribution
5.5
Summary
The current state of the welded reservoir production system includes a complex workflow through several operations. Approximately half of these operations occur in the welded reservoir production area. This area is devoted to welded reservoirs and contains fifteen workers
(operators, mechanics, and welders). Absenteeism among these workers is a significant source of variability in the production system. The other half of the operations takes place in shared work centers. The cycle time through these shared work centers is another significant source of variability in the process flow. Rework due to failed weld inspections that occur at share work centers (dye penetrant inspection and x-ray inspection) is the final significant source of
6.0 Production System Simulation
This Chapter describes the development of a discrete event simulation of the welded reservoir production system. This simulation is intended to be a tool for determining the effect on value made by changes to the production system.
6.1 Approach
A discrete event simulation of the welded reservoir production system is developed and analyzed using Process Simulator 2014 - Professional, Version 9.2.4.2624, Copyright C 2002-2015 ProModel Corporation. The scope of the model includes release, assembly of details (uppers, lower, and g-traps) and closeouts. The purpose of the model is to evaluate the effect of changes to labor deployment, overtime usage, and shop floor control within the welded reservoir work center on the required labor usage and customer service level (given a specified order lead time). The resultant labor usage and order lead times are converted into a "total cost" value using the value characterizations of labor, inventory, and opportunity described in Chapter 4.
The model, shown in Figure 6-1, simulates process times, capacities, labor requirements, and the distribution of available labor for activities in the welded reservoir work center. Shared work center operations are included in the simulation but only as waiting times. The process times, capacities, and labor associated with shared work centers are not included. Rather, a waiting time probability distribution is applied for each shared work center operation. This approach does not affect the accuracy of the simulation but rather limits its utility by not allowing for the evaluation of changes to shared work centers. It is reasonable given the purpose of the model, which is to evaluate changes to the welded reservoir work center.
Using this model, orders are pushed into the simulation according to the rate of demand. 747 and 767 products are simplified. Though there are multiple part numbers for a 747 or 767 lower, upper, g-trap, and closeout, only one generic part number is considered for each product type for each of these programs. This simplification is reasonable because process flows and process times are similar for the grouped products. Therefore, four types of parts are considered (small 777, large 777, 747, and 767).
... ... ... ... 4 sT.V i 4 ... ... ... ... ...
-L
...
M
lil l
i
...
zi
GT 1...
...
.
.
...
. ...
...
G ... ... ... .... 0 ULMP VAYe timeMove Ome kickw6d inckWW IM
... ...
for X-MyiHT bKOMM
perwitfent.deoK 3.04.1
... .. ... ... .. .. ....
.... .... A
lima
Move erm added kr inue .... ... - -- . I Oam ...
... ... ... ... ...
AN
... ... ... 'M OD .2kw 31m2w.dp r ... ... ... ... o ... 14 VP ......
...
.
...
.
..
..
...
?4?IJMM WUMft p ... ... ?67...
A
...
...
.
.
IS
...
...
...
...
...
76? UM bw 74Y UM SWAGO ... ... . ... ... ... ... I - --- ... ... ...... ... Y.W e ... . ... ... ... ... ... ..'Ift ... ftl 1" 9 kft ... ... . ... ---0000: I i 1." OT Fitter ... ... i ... .... ......
...
...
---...
...
w
...
L
...
...
...
.
.E.:-
:H
...
A,
...
L
...
8w*P3 3.111....
A,
.
...
Moop
4 71171. swap 0 stwage S Mme Mw ad&d Qok wait tkne uIcludec! infor VP.VR, Age brambrig process brm Moveteadded
for d4ox and iaue
PLftxcv Mings I Fitfings 2 MOVe 3 MM96 4 Wrap r._ I ,1~ 2 or Ck*t aracul
Process times, provided in Section 6.2.1, are input for work center operations as deterministic values. Using deterministic values is not completely realistic but is a reasonable approximation. The variability of an individual operation is small relative to other contributors to system
variability. For example, an operation may take 30 minutes one time and 35 minutes the next, but the much bigger concern is whether the operator actually present that day (especially when he is absent one or two days out of ten).
Shared work center operations are modeled as additional cycle (waiting) time according to a distribution based on manufacturing data (see Section 6.2.1). Manufacturing personnel within the welded reservoir work center are included in the model and given shift and task assignments in accordance with cross-training priorities provided in Table 5-1. The three key aspects of system variability (absenteeism, shared work center cycle time, and rework due to quality
non-conformances) are included in the model. Worker absenteeism is modeled based on attendance records and input as provided in Section 6.2.2. Shared work center operation cycle times are input in accordance with Section 6.2.1. Quality non-conformances and rework are modeled as rework loops at appropriate locations. Rejection rates are input based on manufacturing data as described in Section 6.2.3. Logic is implemented into the model to trigger worker overtime based on traditional management practice as described in Section 6.2.4.
Orders are pulled out of the system according to the rate of demand, delayed by certain lead time. The model is simulated for one year of production ten times. The number of times a reservoir is not available is determined, and a service level is calculated according to the following equation:
Service Level= D-N
D
Where:
D - Total number of finished goods demanded by customer
N - Number of times finished goods are not available when demanded by customer
A baseline case is developed to simulate current system performance. In Section 6.3, this case is
used to benchmark the model's ability to effectively predict the relationship between service level and order lead time against production data.
6.2 Inputs
Inputs to the discrete event simulation model used in the baseline case are provided in this section.
6.2.1 Operation Details
Table 6-1 lists each reservoir work center operation and several associated performance characteristics that used as inputs in the discrete event simulation. These include:
- Personnel required
- Tools/machines required to perform operation
- Average Setup Time - Setup times are determined via discussion with operators and observation. New setups are required for all activities. No batching takes place in the welded reservoir work center.
- Average Process Time - Process times are determined by subtracting setup time from operation time.
Operation times are estimated using production data and validated based on discussion with operators and observation. Operation times are not readily available in existing production data because the available production data contain the time completions of operations but do not contain starts of operations. Also, shift times and breaks complicate this calculation. Using production data from January 4, 2016, through March 26, 2016, operation times are estimated as follows:
1. For each operator that performs the specific operation, determine the time between the completion of the previous operation performed by that operator and completion of the current operation by that operator.
2. Average each of these times, with the exception of times greater than 8.5 hours (length of a shift) and less than 5 minutes. The long times are not considered to remove the effect of work stoppage due to the end of a shift. The short times are not considered to remove the effect of operation batching. Operation batching occurs when operators indicate completion of
multiple tasks on a work order at the same time even though those operations were completed at different times in the operation sequence.
3. Correct for non-productive time - Each of these operations is performed by operators on a shift that lasts 8.5 hours. However, due to scheduled breaks, meetings, and training, Boeing management estimates that approximately 7 hours of productive work are expected each shift. Therefore, each average time is adjusted by a factor of approximately 7/8.5 = 0.82. This approach is not exact, as some operations will be more affected than others by breaks in work, but it provides a reasonable estimate for the purposes of the simulation.
Table 6-1. Reservoir Work Center Operation Details
Operation Specif ic Setup Process
Type Machines, Tools, and Personnel Required Operation Part Type Time Time (min) (min)
Trim 1 saw required and available, 1 operator required, _ All Uppers and Lowers 25 65
capable of processing one part at a time Large 777 Closeout 15 45 Pullout 1 pullout station required and available, 1 operator _ Uppers 15 30
required, capable of processing one part at a time Lowers 30 105
Welding 1 weld booth and welder required per part, 1 weld _ All Closeouts 0 30
booth and welder available All Uppers and Lowers 0 24
1 fitting tool required per part, 1 fittingtool available
per part with exception of 271W3109-2 and 271W3109-3
Fittings (2 fitting tools available per part), 1mechanic required All Uppers and Lowers 30 150 per part
Part Mark 1 mechanic required per part - All Uppers and Lowers 10 65 All Closeouts 5 55
Straigthen 1tool and 1mechanic required per part, 1tool available - 10 30
Measure Upper All Closeouts 30 45 Drill/Fit Gtrap All Closeouts 10 50
Closeout 1 mechanic required per part 777 Closeouts 10 150
Fit LWR/UPR 747 Closeouts 30 210
767 Closeouts 30 180
1mechanic required per part (mechanic is idle during Pressurize All Closeouts 30 90
Pressure Test 1Dry" portion of the operation) Dry All Closeouts 5 120 Sand All Closeouts 0 60
Small 777 Closeout 0 300
Bracketing 1tool and 1mechanic required per part, 1tool available Large 777 Closeout 0 450
per part 747 Closeout 0 540
767 Closeout 0 480
Buildup 1 mechanic required per part - _ All Closeouts 0 180
Table 6-2 lists each support operation and several associated performance characteristics that are used in the discrete event simulation. These include average cycle time and approximate cycle time distribution. The characteristics are determined by considering production data from January 4, 2016 through June 6, 2016. Cycle time distributions are curve fit using @Risk in Microsoft Excel to one of the following distributions that Process Simulator is capable of modeling:


![Figure 3-2. Cycle Time vs. Utilization in a System with Variability [8]](https://thumb-eu.123doks.com/thumbv2/123doknet/14057768.460958/19.917.201.699.331.706/figure-cycle-time-vs-utilization-variability.webp)