Publisher’s version / Version de l'éditeur:
Vous avez des questions? Nous pouvons vous aider. Pour communiquer directement avec un auteur, consultez la première page de la revue dans laquelle son article a été publié afin de trouver ses coordonnées. Si vous n’arrivez pas à les repérer, communiquez avec nous à PublicationsArchive-ArchivesPublications@nrc-cnrc.gc.ca.
Questions? Contact the NRC Publications Archive team at
PublicationsArchive-ArchivesPublications@nrc-cnrc.gc.ca. If you wish to email the authors directly, please see the first page of the publication for their contact information.
https://publications-cnrc.canada.ca/fra/droits
L’accès à ce site Web et l’utilisation de son contenu sont assujettis aux conditions présentées dans le site LISEZ CES CONDITIONS ATTENTIVEMENT AVANT D’UTILISER CE SITE WEB.
The Journal of Biological Chemistry, 285, 5, pp. 3145-3156, 2010-01-29
READ THESE TERMS AND CONDITIONS CAREFULLY BEFORE USING THIS WEBSITE. https://nrc-publications.canada.ca/eng/copyright
NRC Publications Archive Record / Notice des Archives des publications du CNRC :
https://nrc-publications.canada.ca/eng/view/object/?id=93762aa1-c1cd-4683-88af-9f52b330fa9d
https://publications-cnrc.canada.ca/fra/voir/objet/?id=93762aa1-c1cd-4683-88af-9f52b330fa9d
Archives des publications du CNRC
This publication could be one of several versions: author’s original, accepted manuscript or the publisher’s version. / La version de cette publication peut être l’une des suivantes : la version prépublication de l’auteur, la version acceptée du manuscrit ou la version de l’éditeur.
For the publisher’s version, please access the DOI link below./ Pour consulter la version de l’éditeur, utilisez le lien DOI ci-dessous.
https://doi.org/10.1074/jbc.M109.073338
Access and use of this website and the material on it are subject to the Terms and Conditions set forth at
Nanoscale imaging of epidermal growth factor receptor clustering:
effects of inhibitors
Abulrob, Abedelnasser; Lu, Zhengfang; Baumann, Ewa; Vobornik, Dusan;
Taylor, Rod; Stanimirovic, Danica; Johnston, Linda J.
Nanoscale Imaging of Epidermal Growth Factor
Receptor Clustering
EFFECTS OF INHIBITORS
*Received for publication, October 6, 2009, and in revised form, November 9, 2009Published, JBC Papers in Press, December 3, 2009, DOI 10.1074/jbc.M109.073338 Abedelnasser Abulrob‡1, Zhengfang Lu§, Ewa Baumann‡, Dusan Vobornik§, Rod Taylor§, Danica Stanimirovic‡,
and Linda J. Johnston§2
From the‡Institute for Biological Sciences and the§Steacie Institute for Molecular Sciences, National Research Council of Canada,
Ottawa, Ontario K1A 0R5, Canada
The development of some solid tumors is associated with overexpression of the epidermal growth factor receptor (EGFR) and often correlates with poor prognosis. Near field scanning optical microscopy, a technique with subdiffraction-limited optical resolution, was used to examine the influence of two inhibitors (the chimeric 225 antibody and tyrosine phosphory-lation inhibitor AG1478) on the nanoscale clustering of EGFR in HeLa cells. The EGFR is organized in small clusters, average diameter of 150 nm, on the plasma membrane for both control and EGF-treated cells. The numbers of receptors in individual clusters vary from as few as one or two proteins to greater than 100. Both inhibitors yield an increased cluster density and an increase in the fraction of clusters with smaller diameters and fewer receptors. Exposure to AG1478 also decreases the fraction of EGFR that colocalizes with both rafts and caveolae. EGF stim-ulation results in a significant loss of the full-length EGFR from the plasma membrane with the concomitant appearance of low molecular mass proteolytic products. By contrast, AG1478 reduces the level of EGFR degradation. Changes in receptor clustering provide one mechanism for regulating EGFR signal-ing and are relevant to the design of strategies for therapeutic interventions based on modulating EGFR signaling.
The plasma membrane of the cell is a complex, carefully reg-ulated, dynamic structure that is compartmentalized into cell surface domains such as lipid rafts, caveolae, and clathrin-coated pits (1). Lipid rafts are postulated to be dynamic nano-domains ranging in size from 10 to 200 nm that are enriched in cholesterol, sphingolipids, and certain proteins and that play an important role in assembling signaling complexes (2– 4). Caveolae are invaginated lipid raft domains (50 –150 nm) whose stability at the plasma membrane is attributable to the formation of stable oligomers of their coat protein, caveolin-1 (5). Caveolae are thought to serve as concentrators of various signal transduction machineries. Clathrin-coated pits (100 – 150 nm) internalize rapidly upon formation at the plasma membrane, and their lateral cell surface mobility is enhanced by actin cytoskeleton depolymerization (6).
The epidermal growth factor receptor (EGFR),3a 170-kDa transmembrane glycoprotein, is one of four members of the ErbB family of receptor tyrosine kinases involved in oncogene signaling. The initial step in receptor activation involves bind-ing of the EGF peptide to the extracellular domain leadbind-ing to dimerization or activation of pre-existing dimers (7, 8). Follow-ing ligand bindFollow-ing, the EGFR is auto-phosphorylated in several tyrosine residues of the intracellular domain, creating high affinity sites for various adaptor molecules that transmit the mitogenic signal to the Ras/MAPK signal transduction pathway (9). Activation of Ras initiates a multistep phosphorylation cas-cade that leads to the activation of MAPKs, ERK1, and ERK2, which regulate transcription of molecules that are linked to cell proliferation, survival, and transformation. Enhanced EGFR expression has been detected in glioblastoma, breast, lung, ovarian, colorectal, and renal carcinomas (10). Overexpression of EGFR is associated with poor prognosis in many tumors including brain and breast cancer. Two main anti-EGFR strat-egies are currently exploited in clinical development: chimeric anti-receptor antibodies such as 225 (cetuximab), which binds directly to the ligand-binding site on the extracellular domain and has similar affinity to EGF peptide, and small molecule tyrosine kinase inhibitors such as tryphostin AG1478, gefitinib (ZD1839), or erlotinib (OSI-774) that compete with ATP for binding to the EGFR intracellular tyrosine kinase domain. Both classes of therapeutics have shown encouraging preclinical and clinical activity in a variety of tumors (11, 12). Nevertheless, the development of resistance to some therapies illustrates the need for a more detailed understanding of the factors that reg-ulate EGFR signaling (12, 13).
The nanometer scale clustering of receptors in higher order assemblies has attracted increased attention in studies of recep-tor biology and signal transduction. The functional conse-quences of receptor assemblies include their potential for inter-receptor communication and increased signaling efficiency, as well as their information processing capacity (14). Membrane domains such as lipid rafts, caveolae, and clathrin-coated pits provide one mechanism for spatial and temporal control of the
*This work was supported in part by a grant from the Canadian Institute for Photonics Innovation (to L. J. J., D. V., and R. T.).
1To whom correspondence may be addressed. E-mail: Abedelnasser. Abulrob@nrc.gc.ca.
2To whom correspondence may be addressed. E-mail: Linda.Johnston@ nrc-cnrc.gc.ca.
3The abbreviations used are: EGFR, epidermal growth factor receptor(s); MAPK, mitogen-activated protein kinase; ERK, extracellular signal-regu-lated kinase; NSOM, near field scanning optical microscopy; Tricine, N-[2-hydroxy-1,1-bis(hydroxymethyl)ethyl]glycine; mAb, monoclonal anti-body; FRET, fluorescence resonance energy transfer; GFP, green fluorescent protein.
at CISTI - Natl Research Council, on January 24, 2010
www.jbc.org
assembly of nanoscale signaling domains (15). However, pro-gress in understanding the assembly of signaling complexes and their association with membrane domains has so far been ham-pered by the limited availability of methods for the direct visu-alization of proteins and complexes with high spatial resolution in the membranes of intact cells.
A mechanistic understanding of EGFR activation in a tumor cell environment requires knowledge of the spatial organiza-tion of the receptor on the cell surface. Recently single molecule fluorescence and single particle tracking have provided insight on the role of EGFR dimers and oligomers but in most cases do not visualize the entire population of receptors (16, 17). We report the use of near field scanning optical microscopy (NSOM) to probe the distribution and nanometer scale associ-ations of EGFR in HeLa cells and to determine the influence of the tyrosine kinase inhibitor AG1478 and 225 EGFR-blocking antibody on the distribution of EGFR. NSOM is one of an emerging group of super-resolution methods for fluorescence imaging with subdiffraction resolution (18, 19) and is based on delivering light through an aperture that has subwavelength dimensions (20, 21) to overcome the diffraction limit. NSOM has recently been used for nanoscale fluorescence imaging of membrane protein clusters with spatial resolution below 100 nm in fixed cells (22–28). Using NSOM, we show that EGFR is distributed in nanometer-sized clusters in the plasma mem-brane and that association with lipid raft and caveolae domains regulates receptor sequestration and trafficking in response to activation and/or inhibition in HeLa adenocarcinoma cells. EXPERIMENTAL PROCEDURES
Reagents—Human epidermal growth factor peptide and AG1478 (4-(3-chloroanilino)-6,7-dimethoxyquinazoline) were purchased from Calbiochem. Polyclonal antibodies against EGFR and caveolin-1 were purchased from Santa Cruz Biotech-nology. Alexa488-labeled cholera toxin subunit B and secondary antibodies goat anti-rabbit Alexa568 and goat anti-rabbit Alexa647were purchased from Invitrogen. Cell culture medium was purchased from Invitrogen, and fetal bovine serum was from Hyclone. 225 anti-EGFR antibody was a kind gift from Dr. Maria Jaramillo (NRC-Biotechnology Research Institute, Mon-treal, Canada).
Cell Culture—Human cervical adenocarcinoma (HeLa) cells were obtained from American Type Culture Collection and maintained in Eagle’s minimum essential medium in Earle’s balanced salt solution and 2 mM L-glutamine modified to
con-tain 1.5 g of sodium bicarbonate/liter, supplemented with 1 mM
nonessential amino acids, 10 mMsodium pyruvate, and 10%
fetal bovine serum. The cells were maintained at 37 °C in a humidified atmosphere (95% air, 5% CO2) and passaged every 3– 4 days. Before the experiments, the cells were maintained in serum-free medium for 18 h.
Laser Scanning Confocal Microscopy—The membrane distri-bution of EGFR, lipid rafts, and caveolin-1 was studied by immunofluorescence. HeLa cells were serum-starved for 18 h, and incubated in the presence or absence of EGF (100 ng/ml) for 10 min and in the presence of AG1478 (1 M, 1 h) or 225
antibody (1 g/ml, 1 h) followed by EGF (100 ng/ml) for 10 min at 37 °C. Lipid rafts were labeled by incubating cells with 10
g/ml Alexa488fluor-labeled cholera toxin subunit B for 30 min on ice. The cells were then fixed with 4% formaldehyde and permeabilized with 0.1% Triton X-100 for 10 min. The cells were blocked with 4% goat serum for 1 h and incubated with anti-EGFR polyclonal antibody (dilution 1: 100) for 1 h followed by extensive washing and incubation with Alexa568secondary antibody (1: 250) for 1 h. In colocalization experiments, caveo-lin-1 was labeled with caveocaveo-lin-1 (1: 300) polyclonal anti-body for 1 h, followed by Alexa647secondary antibody. The coverslips were washed five times in Hanks’ balanced salt solu-tion and mounted in fluorescent mounting medium (Dako).
A Zeiss LSM410 confocal laser scanning microscope (Carl Zeiss) was used to image cells (Nikon Plan Apo, 60⫻ NA 1.4 oil immersion lens). Confocal images for triple labeled cells were obtained simultaneously to exclude artifacts from sequential acquisition. Alexa488was excited with the 488-nm line of an argon/krypton ion laser, and emission was detected through a 488/568-nm dual-band dichroic mirror and a 515–565-nm band-pass filter. Alexa568was excited with the 568-nm line of an argon/krypton laser, and emission was detected through a 488/568-nm dual-band dichroic mirror and a 575– 640-nm band pass filter. Alexa647was excited at 647 nm, and emission was measured through a 665-nm long pass dichroic mirror. The focal plane of the confocal microscope was adjusted such that the top flat layer of the cell membrane could be imaged in a single confocal slice. All of the images were collected using the same laser power and pinhole size for each channel and pro-cessed in an identical manner. Omission of primary antibodies resulted in no staining. No cross-reactivity was observed between the primary and noncorresponding secondary antibodies.
Preparation of Plasma Membranes from HeLa Cells—The plasma membrane fraction was isolated and characterized as described previously (29). All of the steps were carried out at 4 °C, and all of the buffers were supplemented with protease inhibitors mixture (Sigma) as described previously (29, 30). A plasma membrane fraction was prepared from four 175-cm2 tissue culture dishes of confluent HeLa cells incubated in the presence or absence of EGF (100 ng/ml) for 10 min or AG1478 (1 M, 1 h) or 225 antibody (1 g/ml, 1 h) followed by EGF (100
ng/ml) for 10 min. Each dish was washed twice with 10 ml of buffer A (0.25Msucrose, 1 mMEDTA, and 20 mMTricine, pH
7.8). The cells were collected by scraping in 5 ml of buffer A, pelleted by centrifugation at 1400 ⫻ g for 5 min (Beckman J-68; 3000 rpm), resuspended in 1 ml of buffer A, and homogenized by 20 up/down strokes with a Teflon glass homogenizer. Homogenized cells were centrifuged twice at 1000 ⫻ g for 10 min (Eppendorf centrifuge 5415C; 3000 rpm), and the two postnuclear supernatant fractions were subjected to Percoll gradient centrifugation. It was overlaid on top of 23 ml of 30% Percoll solution in buffer A and ultracentrifuged at 83,000 ⫻ g (30,000 rpm) for 30 min in a Beckman 60Ti. The plasma mem-brane fraction was collected (a visible band 5– 6 cm from the bottom of the tube) and then sonicated six times at 50 J/W/s.
SDS-PAGE and Western Immunoblot Analysis—For immu-noblot detection of EGFR and caveolin-1, cellular membrane fractions were resolved on SDS-polyacrylamide gels under reducing conditions. The separated proteins were
at CISTI - Natl Research Council, on January 24, 2010
www.jbc.org
phoretically transferred to a polyvinylidene difluoride mem-brane (Immobilon P; Millipore). After blocking with 5% skim milk for 1 h, the membrane was probed with polyclonal anti-EGFR antibody (dilution 1:500) and anti-polyclonal caveolin-1 antibody (dilution 1:500) in TBS-Tween with 5% skim milk for 2 h. Follow-ing detection with the appropriate horseradish-peroxidase conju-gated secondary antibody (Jackson ImmunoResearch), the blots were developed by ECL plus Western blotting detection system. Protein band intensities were quantified via densitometric analysis (Northern Eclipse digital software; Empix imaging) after normal-ization to -actin signals.
Near Field Scanning Optical Microscopy—NSOM experi-ments were carried out on a combined atomic force/NSOM microscope based on a Digital Instruments Bioscope mounted on an inverted fluorescence microscope (Zeiss Axiovert 100) as described previously (23, 30). Bent NSOM probes were pre-pared from high GeO2-doped fibers via a two-step chemical etching method followed by aluminum deposition and focused ion beam milling to produce a flat circular aperture. The probes used here had ⬃90-nm aperture diameters (based on scanning electron microscopy and images of 40-nm dye-labeled polymer spheres) and estimated spring constants of ⬃100Nm⫺1.
Cellu-lar imaging was carried out using 488-, 567-, or 647-nm excita-tion from an argon-krypton laser (Melles Griot 643-AP-A01). Fluorescence was collected with a 63⫻ objective (0.75 NA; LD Plan-NEOFLUAR, Zeiss), with a band pass filter and appropri-ate filters to remove residual excitation and the red alignment laser, and detected using an avalanche photodiode detector (PerkinElmer Optoelectronics, SPCM-AQR-16) (22, 23).
The cells for NSOM were prepared as described above for confocal imaging and were extensively washed with water and
nitrogen-dried prior to imaging. The images shown are representa-tive of multiple cells for a given set of conditions. We verified that the NSOM probe aperture remained unchanged throughout the experi-ments by scanning 40-nm fluorescent spheres before and after the experiments.
Cluster size analysis was per-formed using original nonprocessed NSOM images with custom soft-ware that determines the number of clusters and their location in the image, as well as their full width at half-maximum, based on a circular profile, and maximum intensity, as previously described (22, 23). All of the histograms represent data from multiple small images (10 ⫻ 10 m, typically three or four images) for a particular cell treatment. Cluster diameters are corrected for convo-lution of the probe aperture and cluster size using a deconvolution routine that assumes a Gaussian profile for both clusters and probe aperture and using the probe aperture size estimated from scanning electron microscopy and verified by imaging dye-la-beled spheres. Histograms of cluster intensity were obtained by calculating the total integrated intensity for individual clusters using the maximum intensity and diameter (after deconvolu-tion) from the cluster analysis procedure and assuming a Gaus-sian feature profile. The density of clusters on the cell surface is an average of data from a minimum of eight individual images (either 30 ⫻ 30 m or 10 ⫻ 10 m) for each cell treatment. Colocalization of EGFR with either rafts or caveolin-1 was mea-sured using Image J software, with values reported the average of five to eight individual images.
RESULTS
NSOM Reveals Nanometer Scale Clusters of EGFR on HeLa Cells—EGFR was labeled with anti-EGFR primary antibody fol-lowed by Alexa568 secondary antibody. The distribution of EGFR in control cells and cells treated with EGF peptide for 10 min prior to fixation was assessed by NSOM. Fig. 1 (A and B) shows simultaneously recorded topographic and fluorescence images of control cells. The nucleus for individual cells is clearly visible as a raised (brighter) region in the topographic scan, whereas the near field fluorescence image shows that the EGFR is located in clusters and larger patches of variable size and intensity that are distributed across most of the cell surface. NSOM is an interface-sensitive method, and the limited depth of field dependence results in a very low sensitivity to fluores-cent species (such as internalized receptors) that are more than ⬃100 nm below the membrane (22). Note that the resolution in the near field fluorescence image is much higher than that in the topographic scan. The topographic resolution is limited by FIGURE 1. Near field scanning optical microscopy shows that EGFR localizes in small clusters with a range
of sizes and intensities. A–C and D–F show NSOM images of control and EGF-treated HeLa cells, respectively.
A and D are topographic scans with the corresponding fluorescence images of the same area shown in B and E. C and F were obtained by scanning the regions in boxes in the larger fluorescence images. The inset at the top right of F shows the region outlined at the bottom right on a different intensity scale, illustrating that some
brighter features are multiple small clusters.
at CISTI - Natl Research Council, on January 24, 2010
www.jbc.org
the relatively large probe end, which is several hundred nm larger than the optical aperture because of the aluminum coating.
Fig. 1C shows an image obtained for the region outlined in Fig. 1B; the ⬃90-nm spatial resolution available with near field imaging allows clear visualization of individual, closely spaced clusters of labeled EGFR and a few larger fluorescent features. The results obtained for cells treated with EGF peptide (100 ng/ml) give qualitatively similar results (Fig. 1, D–F). The inset in Fig. 1F shows a small region of the image on a different inten-sity scale, illustrating that some of the brighter features are mul-tiple small clusters.
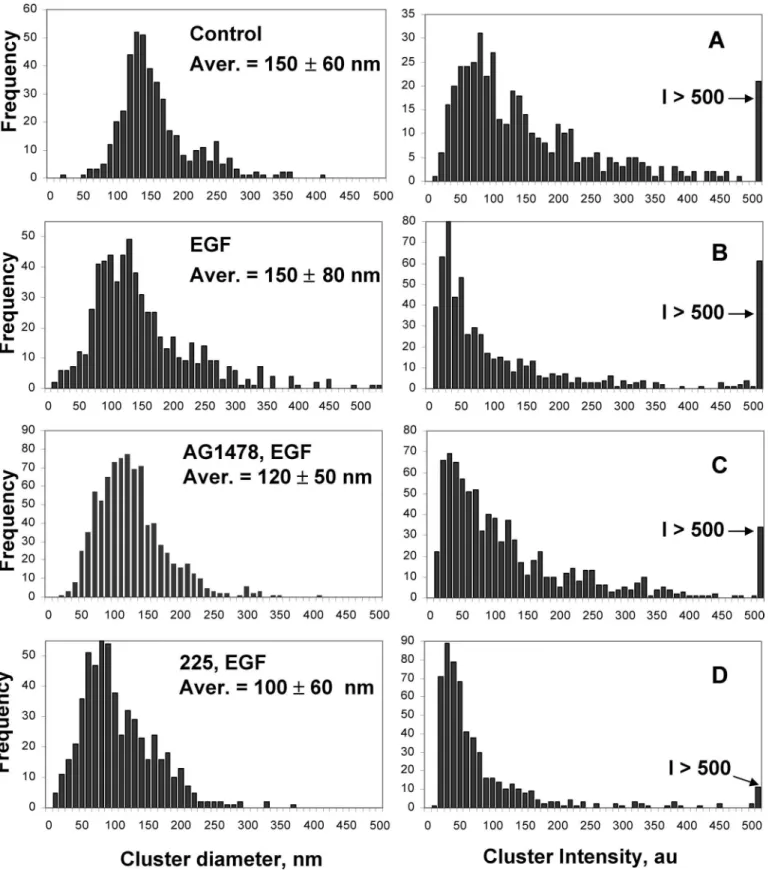
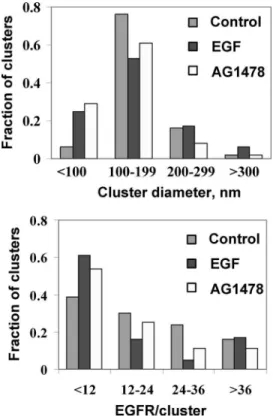
NSOM images for several cells were analyzed using custom software that counts individual clusters and measures their diameter and intensity (see “Experimental Procedures”). A his-togram of cluster sizes for control cells is presented in Fig. 2A. The majority (⬎95%) of EGFR clusters have diameters between 50 and 300 nm, with an average of 150 ⫾ 60 nm. A similar broad range of EGFR cluster sizes is observed in EGF-stimulated cells (Fig. 2B). Although the average cluster diameter is the same as in control cells, the distribution is broader, as evidenced by the larger standard deviation: 150 ⫾ 80 nm. Fig. 3 illustrates these changes graphically; after EGF stimulation there are 4- and 3-fold increases in the number of small (⬍100 nm) and large (⬎300 nm) clusters, respectively, with a concomitant decrease in the fraction of clusters with sizes between 100 and 200 nm (from 76 to 53%). These changes may reflect internalization of predominantly the intermediate size clusters as a result of ligand stimulation, with recycling of receptor back to the plasma membrane giving more small clusters. Note that the changes in cluster size illustrated by the histograms and bar charts in Figs. 2 and 3 are the averages of multiple images; these data more clearly illustrate the effects of EGF treatment than do individual images (Fig. 1), which give varying impressions depending on the intensity scale used to display the data.
Intensity distributions for EGFR clusters in control and EGF-treated cells are presented in Fig. 2. The intensity distribution is considerably narrower after activation with EGF and is shifted toward lower intensities; for example, ⬃50% of clusters have intensities between 0 and 40 (arbitrary intensity units) for EGF-stimulated cells, compared with only 8% for control cells. The density of EGFR clusters on the cell surface was assessed by quantitative analysis of the number of EGFR clusters for ⬎8 images of several different sizes for both control and EGF-acti-vated cells. An average of 2 clusters/m2was obtained for each cell treatment. This plus the increased fraction of less intense clusters after EGF treatment indicate a loss of cell surface EGFR, consistent with internalization and EGFR endocytosis.
The intensity of individual clusters can be related to the num-ber of receptors/cluster, if the intensity of a single dye-labeled antibody and the receptor labeling stoichiometry are known. We have assumed that the least intense clusters (first bin in the histogram) correspond to labeled EGFR dimers. This is consis-tent with the intensity measured for individual dye-labeled antibodies under conditions similar to those used for the cellu-lar imaging. To validate this approach, the measured cluster density of 2 clusters/m2and the number of EGFR in a cluster of average intensity for untreated cells were used to calculate
the number of EGFR/cell, assuming a cell diameter of 20 m. This provides an estimate of 60,500 EGFR/cell in good agree-ment with a literature value for HeLa cells of 50,000 EGFR/cell (13). Using this approach we estimate that clusters at the peak of the intensity distributions for EGF-treated and control cells have ⬃6 and 13 receptors, respectively, whereas those in the last bin of the histogram have ⬎65 EGFR. The fraction of clus-ters with various numbers of receptors is illustrated in the bar chart in Fig. 3. As noted above, EGF treatment leads to a larger fraction of clusters with small numbers of receptor (⬍12 EGFR), fewer clusters in the intermediate range (12–36 EGFR), and a similar fraction of clusters with ⬎36 EGFR, in compari-son with control cells.
In addition to estimating the numbers of receptors in indi-vidual clusters, it is informative to examine the correlation between cluster size and intensity. Plots of cluster area versus total integrated cluster intensity (as a measure of receptor den-sity) are shown in Fig. 4 for control and EGF-treated cells. The large degree of scatter indicates a wide range of packing densi-ties for EGFR on the cell surface. For example, clusters with the average diameter of 150 nm (area of 0.018 m2) have anywhere from 5 to 60 EGFR, clearly demonstrating that there is not a uniform receptor density for individual clusters. The plot for EGF-treated cells shows a higher incidence of smaller clusters, consistent with the histograms in Fig. 2.
Nanometer-sized EGFR Clusters Partially Overlap with Lipid Rafts and Caveolae—The extent of overlap of EGFR with lipid rafts was assessed by labeling cells with Alexa488-labeled chol-era toxin subunit B, which binds GM1 ganglioside, a frequently used raft marker. The representative NSOM images in Fig. 5 indicate that cholera toxin labels a number of small clusters, as well as some larger patches or clusters of domains. Cluster size analysis, as described above for EGFR, gives an average raft size of 110 ⫾ 50 nm. Merged images for raft and EGFR channels (Fig. 5) indicated a significant degree of colocalization of EGFR with raft domains. Analysis of multiple images revealed that 44 ⫾ 6% of EGFR colocalized with lipid rafts in control cells. The colocalization of EGFR and lipid rafts was not significantly influenced by EGF treatment, as evidenced by a similar overlap value (40 ⫾ 10%) after stimulation with EGF.
Caveolae were visualized by labeling cells with anti-caveo-lin-1 followed by Alexa647secondary antibody. NSOM imaging of caveolin-1 and EGFR revealed that 44 ⫾ 3% of EGFR was colocalized with caveolin-1. The colocalization of EGFR with caveolin-1 was not significantly influenced by EGF treatment, as evidenced by similar cluster overlap values (44 ⫾ 3% on con-trol cells and 45 ⫾ 9% after stimulation with EGF; Fig. 5). Caveolin-1 was located in clusters with an average diameter of 120 nm in control cells, consistent with the size of caveolae measured by electron microscopy (31). The measured size is slightly smaller than that reported in our earlier NSOM studies (23, 30); the present value is more reliable because it corrects for convolution of probe aperture and feature size. The average diameter for caveolae in EGF-treated cells decreased slightly to 110 nm.
The relationship between caveolin clusters and GM1-en-riched domains was also examined. The extent of colocalization between raft and caveolae domains was typically 20% in control
at CISTI - Natl Research Council, on January 24, 2010
www.jbc.org
cells. This result coupled with the overlap of EGFR with individual raft and caveolae domains suggests that there is a significant pop-ulation of EGFR that does not colocalize with either raft or
caveo-lae domains. Consistent with this, visual inspection of three-color merged images provides qualitative evidence for a fraction of EGFR that does not localize in either membrane domain. FIGURE 2. Histograms show the variation in EGFR cluster diameter (left column) and intensity (right column) for various cell treatments. Each histogram presents the combined data from multiple NSOM images. The cluster diameters are after deconvolution, based on the measured probe aperture diameter. Intensity histograms show integrated intensities, with all clusters with intensity greater than 500 summed in the last bin of the histogram. A, control cells (n ⫽ 2). B, cells treated with EGF for 10 min (n ⫽ 4). C, cells treated with AG1478 for 1 h, followed by EGF for 10 min (n ⫽ 2). D, cells treated with 225 antibody for 1 h, followed by EGF for 10 min (n ⫽ 2).
at CISTI - Natl Research Council, on January 24, 2010
www.jbc.org
Effects of AG1478 and 225 mAb Inhibitors on the Nanoscale Clustering of EGFR—The effect of pretreating cells with AG1478, a specific inhibitor of the intracellular EGFR kinase domain, on the spatial organization of EGFR was determined using NSOM. NSOM images of cells that were incubated with AG1478 for 1 h, followed by 10 min of EGF are presented in Fig.
6 (A–C). Large scale images show that EGFR is concentrated in relatively large patches rather than being distributed through-out much of the cell as in control or EGF-treated cells. Smaller images and adjustment of image intensity demonstrate that the larger patches are comprised of many small individual clusters (Fig. 6C). In this case the histograms of cluster size (Fig. 2C) indicate a slightly lower average cluster diameter of 120 ⫾ 50 nm compared with 150 nm for both control and EGF-stimu-lated cells. It is also interesting that the fraction of clusters ⬎300 nm in EGF-treated cells returned to the basal levels observed for nontreated cells after 1 h of AG1478 treatment (Fig. 3). Moreover, although starved cells had 76% of clusters with a size between 100 –199 nm and only 6% were ⬍100 nm, AG1478 treatment shifted the cluster size to 61% with a size between 100 and 199 nm and up to 29% of total clusters with ⬍100-nm diameter.
The intensity distribution for EGFR clusters in cells treated with AG1478 for 1 h is illustrated in Fig. 2C, with the fraction of clusters with specific numbers of EGFR shown in Fig. 3. AG1478 reduced the number of clusters with high receptor density (⬎36), compared with either unstimulated or EGF-treated cells. For other EGFR densities, AG1478 treatment gave behavior intermediate between control and EGF-treated cells, although with a trend toward a larger fraction of clusters with small numbers of receptor, compared with control cells. The surface cluster density for AG1478-treated cells was 4 cluster/ m2, twice that for control cells.
Treating HeLa cells with AG1478 results in a gradual decrease in the fraction of EGFR that colocalizes with caveolin compared with untreated cells. Incubation for 1 h with AG1478 reduces EGFR colocalization with caveolin-1 from 44 to 37%, whereas AG1478-prolonged incubation (24 h) results in a fur-ther reduction to 30%. Furfur-thermore, lipid raft colocalization with EGFR was reduced with AG1478 treatment from 45 to 20% after 24 h of incubation. This demonstrates that the nanometer scale organization of EGFR in the plasma membrane is sensitive to tyrosine phosphorylation.
The cell surface distribution of EGFR was also quantified in cells incubated with 225 antibody prior to EGF treatment (see representative images in Fig. 6, D–F). Quantitative analysis shows that the average cluster size is between 100 and 110 nm for three different incubation times (5 min, 1 h, and 24 h), as illustrated by a histogram for the 5-min incubation (Fig. 2D). The fraction of small clusters increased significantly for 225-treated cells, as compared with either EGF- or AG1478-225-treated cells. The intensity histograms indicate that there are fewer intense clusters, with ⬍5% of clusters having ⬎60 EGFR and with more than 50% with ⬍20 EGFR.
Confocal Laser Scanning Microscopy Studies of EGFR Clus-ters on HeLa Cells—NSOM measurements indicate that EGFR localizes in nanometer-sized clusters of variable size and inten-sity, with significant fractions overlapping with rafts and caveo-lae. For comparison, the distribution of EGFR and its partition-ing between membrane domains was examined uspartition-ing confocal laser scanning microscopy with triple labeling (Fig. 7). As antic-ipated, most EGFR is localized in the plasma membrane in the unstimulated control cells, whereas a significant fraction of internalized protein is observed in EGF-treated cells. Compar-FIGURE 3. Bar charts showing the distribution of cluster diameters (top
panel) and EGFR/cluster (bottom panel) for control, EGF-treated and
AG1478 ⴙ EGF-treated HeLa cells.
FIGURE 4. Correlation of EGFR cluster area and intensity indicates a range
of receptor densities for EGFR in control cells. The data correspond to the
cluster size and intensity histograms shown in Fig. 2 (A and B), with points for several (four to eight) of the most intense clusters removed for clarity of display.
at CISTI - Natl Research Council, on January 24, 2010
www.jbc.org
ison of the confocal and NSOM images (Fig. 1) for control and EGF-treated cells indicates the remarkable improvement in resolution obtained with near field imaging. In both cases, NSOM images show numerous nanometer-sized clusters, many of which are too small and close together to be resolved by confocal microscopy. However, confocal images provide com-plementary information on the amount of internalized protein, which is not detected by NSOM.
Triple labeling demonstrates that a significant fraction of EGFR in control cells colocalizes with rafts and caveolin, as evident from the yellow, white, or magenta areas in the merged
images (Fig. 7). To examine whether phosphorylation affects EGFR asso-ciation with caveolin-1 in HeLa cells, colocalization studies were performed in cells exposed to AG1478. In HeLa cells exposed to 100 ng/ml EGF for 10 min, reduced colocalization of EGFR with both lipid rafts and caveolin-1 compared with that in untreated cells was observed. Thus, the receptor disso-ciation from lipid rafts/caveolae coincides with increased ligand-induced EGFR phosphorylation. Whereas confocal microscopy indi-cated increased colocalization of EGFR with lipid rafts and caveolin after AG1478 treatment, NSOM yielded distinct smaller nanoclus-ters with reduced colocalization compared with untreated cells. This discrepancy could be due to the dif-ferent spatial resolution available with confocal and near field micros-copy; small features that are closer than ⬃300 nm will appear to be colocalized in confocal images but will be resolvable as distinct, non-overlapping areas at the higher spa-tial resolution available with NSOM. The ability to resolve molecular associations below the optical diffraction limit is a signifi-cant advantage of near field imaging.
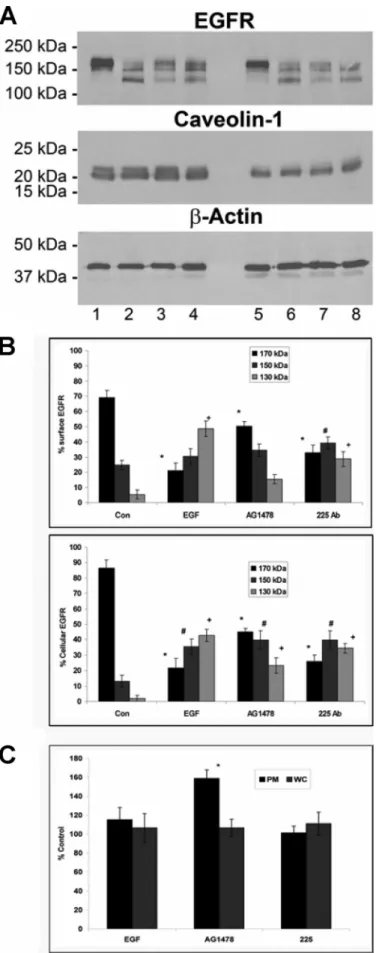
Effect of EGFR Inhibitors on EGFR Expression Levels—The expression level of EGFR at the plasma mem-brane and in whole HeLa cells was analyzed by Western blotting for control cells and cells treated with EGF and EGF plus inhibitor (Fig. 8). Comparison of control and EGF-stimulated cells indicates that pep-tide treatment results in a signifi-cant loss of the 170-kDa band from the full-length EGFR in both the plasma membrane and whole cells (Fig. 8, A and B). The lower intensity of the 170-kDa band after EGF treatment was paral-leled by the appearance of antibody-reactive low molecular mass fragments, which likely represent intermediate proteo-lytic EGFR products (moderate 150-kDa and strong 130-kDa protein bands). In contrast, AG1478 resulted in less receptor degradation after 1 h of incubation (Fig. 8, A and B), and inter-mediate proteolytic products were less prevalent (stronger 170-kDa and weaker 130-170-kDa protein bands) (Fig. 8B). Similar pat-terns of EGFR expression were observed at both the plasma membrane and cellular levels (Fig. 8B). Comparison of the total FIGURE 5. Individual (EGFR, raft, and caveolin) and merged images for a three-color NSOM colocalization
experiment for control cells. The top six panels show data for 30 ⫻ 30-m images. Fluorescence images for
EGFR, rafts stained with Alexa-488-cholera toxin B, and caveolin-1 are shown in A, B, and C, respectively; topography is shown in D, and merged EGFR-raft (green/blue) and merged EGFR-caveolin (green/red) images are shown in E and F. The bottom six panels are 10 ⫻ 10 m images for the boxed region shown in A of the top
panel. G–I are EGFR, raft and caveolin-1 fluorescence channels, J is topography, and K and L are merged
EGFR-raft and EGFR-caveolin images.
at CISTI - Natl Research Council, on January 24, 2010
www.jbc.org
plasma membrane EGFR expres-sion level (Fig. 8A, sum of 170-, 150-, and 130-kDa bands) for control and EGF- and AG1478-treated cells indicated reduced receptor expres-sion after treatment with either peptide or inhibitor. These results corroborate the conclusions from NSOM cluster analysis, which also indicated a net reduction in the level of plasma membrane receptor.
The effect of 225 antibody on EGFR expression at the plasma membrane and whole cell level was less pronounced than that for AG1478. However, at a concentra-tion of 1 g/ml, 130-kDa EGFR expression was reduced, and 170-kDa EGFR increased in a pat-tern similar to that of AG1478 treat-ment (Fig. 8B). We also found a decrease in total EGFR surface expression in HeLa cells, in agree-ment with our previous findings in A549 cells (32). For comparison, we examined the expression level of caveolin-1 in the plasma membrane. Although neither EGF nor 225 had a significant effect, there was a substantial increase in caveolin-1 expression at the plasma membrane surface of HeLa cells after 1 h of treat-ment with AG1478 (158%; Fig. 8, A and C).
DISCUSSION
Recent clinical results demonstrate the efficacy of EGFR-tar-geting therapy for colorectal, head, and neck cancer and prom-ise wider use of EGFR-targeting drugs for lung cancer treat-ment. However, because only a fraction of patients responds successfully to therapy and risks of recurrence are still high, further investigation is required to improve our understanding of the complex network of signaling pathways underlying EGFR-driven cancer progression. Moreover, a better under-standing of the mechanism of drug action in cells expressing high levels of EGFR is central to understanding how EGFR overexpression influences tumor biology. It is also critical for developing cancer therapeutics that selectively inhibit signaling pathways.
Clustering of proteins in large signaling complexes provides a mechanism for controlling protein interaction probabilities and modulating the efficiency of signal transduction. Thus, evaluating the size and composition of these signaling com-plexes and their relationship to membrane domains is an area of significant interest. Various methods have been used to study the dimerization of receptors, but the assembly of individual receptors or small oligomers into larger complexes is a more challenging problem because it requires methods for visualiz-ing interactvisualiz-ing proteins on a length scale that is intermediate between the nearest neighbor interactions probed by fluores-cence resonance energy transfer (FRET) and the diffraction-limited spatial resolution available with confocal microscopy. FIGURE 6. NSOM images of HeLa cells treated with AG1478 for 1 h (A–C) and 225 antibody for 5 min (D–F).
A/B and D/E show matched sets of topographic and fluorescence images of the same area. Smaller
fluores-cence images recorded for the boxed regions in B and E are shown in C and F.
FIGURE 7. Effect of EGFR inhibitors on colocalization of EGFR with
caveo-lin-1 and lipid rafts in HeLa cells. Starved HeLa cells were incubated in the
presence or absence (control) of EGF (100 ng/ml) and with AG1478 (1 M) or 225 mAb (1 g/ml) for 1 h, followed by EGF. The cells were permeabilized, fixed, and triple-labeled with cholera toxin B-Alexa 488 to localize GM-1 (green), anti-caveolin (blue), and anti-EGFR (red) and imaged using confocal microscopy. Yellow, colocalization between EGFR and lipid rafts; magenta, EGFR and caveolin-1; aqua, caveolin-1 and lipid rafts; white, triple colocaliza-tion EGFR/lipid rafts/caveolin-1. The images are representative of at least four separate experiments yielding similar results. Scale bar, 5 m.
at CISTI - Natl Research Council, on January 24, 2010
www.jbc.org
Here we have employed near field microscopy to examine the early processes in EGFR signal transduction, with the goal of understanding how the dynamic organization of membrane receptors is modulated by receptor agonists or antagonists.
We show that EGFR in unstimulated cells is organized in clusters with variable sizes (from 50 to ⬃300 nm in diameter) and intensities; more than 50% of clusters have ⬍24 receptors, although there is a small fraction of clusters with greater than 65 molecules. The clustering of EGFR in the absence of ligand is consistent with recent studies of ErbB receptors (16, 17, 33–36). For example, Clayton et al. (33) have used image correlation microscopy to estimate an average EGFR cluster density of 33/m2with 10 –30 EGFR/cluster in fixed HeLa cells. FRET and fluorescence lifetime imaging indicated the presence of higher order oligomers, with most FRET states localized in clusters containing 15–30 proteins. This organization of recep-tors into nanoscale complexes was predicted to enhance the sensitivity of EGFR to changes in concentration of EGF peptide and to give rise to “long range conformational spread effects that would be absent or diminished if the receptors existed as isolated monomers or dimers at low density on the cell surface” (33). Taken together, our study and the work of Clayton et al. provide a detailed picture of the distribution of EGFR on the plasma membrane of HeLa cells. The EGFR is organized in clusters with a range of sizes and receptor densities and with a significant fraction of receptor oligomers in the larger clusters. Similar receptor aggregation has been observed for a variety of integral membrane proteins (15, 23, 28).
EGF-stimulated cells show a larger fraction of small clusters (⬍100 nm) with fewer receptors/cluster compared with control cells. The relatively modest changes in cluster size and density after EGF stimulation suggest that receptors are preorganized in nanoscale domains on the cell surface and that cellular mech-anisms exist for organization of the EGFR, independent of ligand activation. The results parallel those obtained using immunoelectron microscopy of several ErbB receptors stably expressed in CHO cells (35). Receptor clustering was ob-served, even at low expression levels, with anywhere from 1 to 80 EGFR/cluster. No change in cluster size was observed for either EGFR or ErbB2 following ligand stimulation, although
FIGURE 8. AG1478 and 225 mAb produce decreased EGFR degradation
compared with EGF. A, HeLa cells were starved overnight prior to
stimula-tion with 100 ng/ml EGF at 37 °C for 1 h or were left unstimulated. Whole cell lysates (lanes 5– 8) or plasma membrane (lanes 1– 4) preparations were
subjected to SDS-PAGE and immunoblotting with anti-EGFR antibody (top
panel). The same blot was stripped and reprobed against anti-caveolin-1
(middle panel) and stripped again and reprobed against anti--actin as a load-ing control (bottom panel). For the plasma membrane: lane 1, control; lane 2, EGF; lane 3, AG1478 ⫹ EGF; lane 4, 225 mAb ⫹ EGF. For the whole cell: lane 5, control; lane 6, EGF; lane 7, AG1478 ⫹ EGF; lane 8, 225 mAb ⫹ EGF. The values are the means ⫾ S.E. *, p ⬍ 0.05 from analysis of variance) from control 170-kDa plasma membrane expression (black); #, p ⬍ 0.05 from control 150-170-kDa plasma membrane expression (red); ⫹, p ⬍ 0.05 from control 130-kDa plasma membrane expression (gray). B, graph from densitometric scanning of the 170-, 150-, and 130-kDa EGFR signals relative to -actin control as shown in A. The upper and lower panels represent semi-quantification of cell surface and whole cell EGFR signals, respectively. The value for unstimulated cells was taken as 100%. The values are the means ⫾ S.E. from p ⬍ 0.05 (*, analysis of variance) from control 170-kDa cellular expression (black). #, p ⬍ 0.05 from control 150-kDa cellular expression (red); ⫹, p ⬍ 0.05 from control 130-kDa cellular expression (gray). C, graph from densitometric scanning of the 21-kDa caveolin-1 signal relative to -actin control as shown in A. WC and PM repre-sent analysis of caveolin-1 in whole cell and plasma membrane. The value for unstimulated cells was taken as 100%. The values are the means ⫾ S.E. *, p ⬍ 0.05 (analysis of variance) from control. The data are representative of at least three separate experiments yielding similar results.
at CISTI - Natl Research Council, on January 24, 2010
www.jbc.org
ErbB3 cluster sizes increased after EGF treatment. The lack of colocalization of the three ErbB receptors led to the hypothesis that receptor segregation provides a mechanism for limiting heterodimerization. Changes in clustering behavior as a func-tion of ligand activafunc-tion are obviously complex for EGFR family receptors, because an earlier study reported a larger cluster diameter after activation of ErbB2 receptors overexpressed in SKBR3 cells (36).
Our work and the literature studies discussed above have examined protein clustering in fixed cells, thus giving a snap-shot of the dynamic behavior of the receptor. However, a sim-ilar picture emerges from studies in live cells. For example, three receptor populations were observed for quantum dot-labeled EGFR in COS cells: one that diffuses freely, one that is transiently confined in ⬍100 nm diameter domains, and one that is immobile (17). A fluorescence correlation spectroscopy study for eGFP-EGFR expressed in CHO cells has concluded that EGFR is a complex mix of monomer (70%), dimer (20%), and oligomer (10%) in control cells, with an average of 1.3 EGFR/cluster prior to activation with EGF peptide (16). By con-trast, a single molecule fluorescence study of GFP-EGFR tran-siently transfected in HeLa cells concluded that dimers formed after EGF peptide treatment (37).
Significant changes in the nanoscale distribution of EGFR are observed after treatment with the two inhibitors that we have examined. For example, the cluster size decreases and the clus-ter density increases by a factor of 2 afclus-ter AG1478 treatment. A similar increase in cluster density (⬃2.5 times) with a concom-itant decrease in the number of receptors/cluster was observed by Clayton et al. (33), leading to the conclusion that inhibition of tyrosine phosphorylation leads to the loss of EGFR super-structures. Consistent with these findings, treatment of puri-fied EGFR with the tyrosine inhibitor PD153035 inhibited clus-tering (38). However, using NSOM we have visualized the changes in cluster distribution directly, showing that AG1478 treatment leads to localization of many small individual EGFR clusters in larger patches. This illustrates the importance of examining receptor organization on both micrometer and nanometer length scales.
It is interesting that inhibitors that either interfere with ligand binding to the extracellular domain or prevent phos-phorylation of intracellular residues have similar effects on the nanoscale clustering of EGFR. By contrast, ligand activation leads to less pronounced changes in the nanoscale organization of the receptor. Both observations merit further investigation. The significance of understanding the oligomeric state of the EGFR in the presence of AG1478 is underscored by the recent observation that AG1478 alters the conformation of EGFR dimers, allowing the binding of an anti-EGFR antibody with enhanced therapeutic potential (39). Indeed, the combination of tyrosine kinase inhibitors with anti-EGFR antibodies to treat cancer is an area of active clinical investigation (40).
EGF peptide binding triggers the internalization and subse-quent degradation of the activated receptor, thereby desensitiz-ing the cells for mitogenic signals (41). Although a few studies have reported EGFR degradation products after EGF treatment (42– 44), to the best of our knowledge this is the first observa-tion of these products in the plasma membrane. We have
shown that addition of EGF to HeLa cells gives a decreased amount of mature receptor (170-kDa EGFR) at the plasma membrane and a relative increase in the 130-kDa protein. The three EGFR bands at 170, 150, and 130 kDa have previously been observed in other human tumors, and it was assumed that the 150- and 130-kDa proteins were breakdown products of the EGFR (45). These observations indicate that the enhanced receptor degradation in HeLa cells (46) was reversed by AG1478 and to a lesser extent by 225 antibody treatment. We have previously demonstrated that 225 mAb induces EGFR internalization and down-regulation, resulting in a 40% decrease in surface EGFR (32).
At present we cannot determine the relative contribution of each EGFR degradation product to the fluorescence signals detected using NSOM and confocal microscopy because the antibody used binds to all three EGFR proteins. However, it would be useful to visualize the different EGFR products and study their spatial localization. This might be feasible by select-ing antibodies against unique sequences and conformations for the individual EGFR products. It would also be of interest to determine whether the EGFR degradation products undergo signaling and, if so, how they respond to stimuli and inhibitors. Caveolae assemble signaling molecules in discrete plasma membrane subdomains, providing proximity for their interac-tion and facilitating cross-talk between different signaling path-ways (47). Here we show that close to half the plasma mem-brane EGFR (⬃45%) is localized in clusters that contain caveolin-1 in both control and EGF-stimulated cells. The pres-ence of EGFR in clusters with caveolin-1 has potential for tun-ing the specificity of cell signaltun-ing. These clusters also provide a high density of EGFR molecules in the plane of the plasma membrane, which may be required for efficient conversion to higher order EGFR oligomers. Indeed Sigismund et al. (48) found that in HeLa cells EGFR undergoes distinct post-transla-tional modifications and becomes committed to different inter-nalization routes, as a function of EGF ligand dose and receptor activation. At low EGF concentrations, the EGFR is tyrosine-phosphorylated, fully competent for signaling, nonubiquiti-nated, and internalized through clathrin-coated pits, whereas at high EGF concentrations (as used here), EGFR becomes ubiquitinated and is endocytosed through caveolae (48).
Previously we have shown an up-regulation of total cellular caveolin-1 mRNA and protein expression in U87MG human glioblastoma cells after 24 h of AG1478 treatment, although this observation was not reproduced in squamous cell carci-noma A431 cells (29). In this study the plasma membrane caveolin-1 protein expression was up-regulated after exposure to 1 h of AG1478, indicating that different cell types have dif-ferent responses to tyrosine kinase inhibition. Whether the observed discrepancies are due to the different experimental approaches or are caused by real differences in the observed systems (and if so, the cause of caveolin-1 up-regulation and its interaction with EGFR) is yet to be determined.
The colocalization of EGFR with lipid rafts was similar to caveolae in both control and activated cells (40 – 44%). The results indicate three distinct populations of receptor, with both raft and caveolae localized EGFR as well as a significant population that does not localize in either membrane domain.
at CISTI - Natl Research Council, on January 24, 2010
www.jbc.org
The average diameter for the raft domains visualized using GM1-cholera toxin B was 110 nm, within the predicted range for raft sizes (4) and in reasonable agreement with recent NSOM studies showing nanoscale domains for GM1 and GM3 (diameters of 159 and 190 nm, respectively) in fixed, immuno-stained Madin-Darby canine kidney cells and for asialo-GM1 in fixed HeLa cells (⬃90 nm) (30, 49). These estimates are larger than those from measurements of hindered diffusion of lipids or raft-anchored proteins in the plasma membrane of live cells. For example, stimulated emission depletion fluorescence nanoscopy provided evidence for raft domains ⬍20 nm in size (50). Similarly, fluorescence correlation spectroscopy showed hindered diffusion of GFP-Thy-1, consistent with the existence of nanodomains ⬍60 nm in size, in the plasma membrane of mouse T cells (51). The lack of suitable methods to measure dynamic nanodomains in live cells has led to confusion con-cerning the size, and even the existence, of membrane rafts. However, advances in super-resolution microscopies are start-ing to address this problem; the limited data available so far support the hypothesis of a range of raft sizes (4). It appears that estimates based on a “snapshot” in fixed cells give larger sizes than do dynamic measurements on live cells.
A recent study has concluded that EGF induces coalescence of two types of GM1-enriched raft domains: one in which EGFR is surrounded by a lipid shell composed predominantly of GM1 and a second containing GM1 and several glycosylphospha-tidylinositol-GFP molecules (52). NSOM provides evidence for a small fraction of larger EGFR domains for EGF-treated cells but shows minimal increase in the size of raft domains in the presence of EGF. Thus, it is likely that GM1 nanoclusters, if they occur under our conditions in HeLa cells, coexist within the individual raft domains (average diameter of 110 nm) observed by NSOM. This could be tested by combining FRET with NSOM imaging.
In conclusion, the lateral organization of membrane recep-tors is emerging as an important factor in controlling protein-protein interactions and the assembly of signaling complexes. Here we show that EGFR is organized in nanoscale clusters with a range of sizes and receptor densities on the surface of HeLa cells and that treatment with two commonly used inhibitors modifies both the number of receptor clusters and the EGFR density/cluster. A combination of multimodal methods with high spatial resolution is crucial for understanding receptor clustering as a function of agonist and antagonist modulated signaling. Future work will focus on elucidating the distribution of dimers and small oligomers within individual clusters and relating this to signaling dynamics. Ultimately, understanding the relationship between receptor organization on the cell sur-face and the modulation of signaling processes will contribute to strategies for therapeutic intervention in EGFR signaling and may have applications in personalized medicine.
Acknowledgments—We thank Eve Boileau and Eric Brunette for excellent technical assistance and Tom Devecseri for assistance with figure preparation.
REFERENCES
1. Hancock, J. F. (2006) Nat. Rev. Mol. Cell Biol. 7, 456 – 462 2. Mayor, S., and Rao, M. (2004) Traffic 5, 231–240 3. Simons, K., and Ikonen, E. (1997) Nature 387, 569 –572 4. Pike, L. J. (2006) J. Lipid Res. 47, 1597–1598
5. Parton, R. G., Hanzal-Bayer, M., and Hancock, J. F. (2006) J. Cell Sci. 119, 787–796
6. Gaidarov, I., Santini, F., Warren, R. A., and Keen, J. H. (1999) Nat. Cell Biol.
1,1–7
7. Citri, A., and Yarden, Y. (2006) Nat. Rev. Mol. Cell Biol. 7, 505–516 8. Ferguson, K. M. (2008) Annu. Rev. Biophys. 37, 353–373
9. Ciardiello, F., and Tortora, G. (1998) Clin. Cancer Res. 4, 821– 828 10. El-Rayes, B. F., and LoRusso, P. M. (2004) Brit. J. Cancer 91, 418 – 424 11. Mendelsohn, J., and Baselga, J. (2003) J. Clin. Oncol. 21, 2787–2799 12. Sebastian, S., Settleman, J., Reshkin, S. J., Azzariti, A., Bellizzi, A., and
Paradiso, A. (2006) Biochim. Biophys. Acta 1766, 120 –139
13. Yu, C., Hale, J., Ritchie, K., Prasad, N. K., and Irudayaraj, J. (2009) Biochem. Biophys. Res. Commun. 378,376 –382
14. Irvine, D. J., Hue, K. A., Mayes, A. M., and Griffith, L. G. (2002) Biophys. J.
82,120 –132
15. Pontier, S. M., Percherancier, Y., Galandrin, S., Breit, A., Gale´s, C., and Bouvier, M. (2008) J. Biol. Chem. 283, 24659 –24672
16. Saffarian, S., Li, Y., Elson, E. L., and Pike, L. J. (2007) Biophys. J. 93, 1021–1031
17. Serge´, A., Bertaux, N., Rigneault, H., and Marguet, D. (2008) Nat. Methods
5,687– 694
18. Hell, S. W. (2009) Nat. Methods 6, 24 –32
19. Lippincott-Schwartz, J., and Manley, S. (2009) Nat. Methods 6, 21–23 20. Dunn, R. C. (1999) Chem. Rev. 99, 2891–2928
21. Lewis, A., Taha, H., Strinkovski, A., Manevitch, A., Khatchatouriants, R., Dekheter, and Ammann, E. (2003) Nat. Biotech. 21, 1378 –1386 22. Ianoul, A., Street, M., Grant, D., Pezacki, J., Taylor, R. S., and Johnston, L. J.
(2004) Biophys. J. 87, 3525–3535
23. Ianoul, A., Grant, D. D., Rouleau, Y., Bani-Yaghoub, M., Johnston, L. J., and Pezacki, J. P. (2005) Nat. Chem. Biol. 1, 196 –202
24. Koopman, M., Cambi, A., de Bakker, B. I., Joosten, B., Figdor, C. G., van Hulst, N. F., and Garcia-Parajo, M. F. (2004) FEBS Lett. 573, 6 –10 25. Ho¨ppener, C., Siebrasse, J. P., Peters, R., Kubitscheck, U., and Naber, A.
(2005) Biophys. J. 88, 3681–3688
26. Ho¨ppener, C., and Novotny, L. (2008) Nano Lett. 8, 642– 646
27. de Bakker, B. I., de Lange, F., Cambi, A., Korterik, J. P., van Dijk, E. M., van Hulst, N. F., Figdor, C. G., and Garcia-Parajo, M. F. (2007) ChemPhysChem 8,1473–1480
28. de Bakker, B. I., Bodna´r, A., van Dijk, E. M., Va´mosi, G., Damjanovich, S., Waldmann, T. A., van Hulst, N. F., Jenei, A., and Garcia-Parajo, M. F. (2008) J. Cell Sci. 121, 627– 633
29. Abulrob, A., Giuseppin, S., Andrade, M. F., McDermid, A., Moreno, M., and Stanimirovic, D. (2004) Oncogene 23, 6967– 6979
30. Abulrob, A., Lu, Z., Brunette, E., Pulla, D., Stanimirovic, S., and Johnston, L. J. (2008) J. Micros. 232, 225–234
31. Parton, R. G., and Simons, K. (2007) Nat. Rev. Mol. Cell Biol. 8, 185–194
32. Jaramillo, M. L., Leon, Z., Grothe, S., Paul-Roc, B., Abulrob, A., and O’Connor-McCourt, M. (2006) Exp. Cell Res. 312, 2778 –2790
33. Clayton, A. H., Tavarnesi, M. L., and Johns, T. G. (2007) Biochemistry 46, 4589 – 4597
34. Clayton, A. H., Walker, F., Orchard, S. G., Henderson, C., Fuchs, D., Roth-acker, J., Nice, E. C., and Burgess, A. W. (2005) J. Biol. Chem. 280, 30392–30399
35. Yang, S., Raymond-Stintz, M. A., Ying, W., Zhang, J., Lidke, D. S., Stein-berg, S. L., Williams, L., Oliver, J. M., and Wilson, B. S. (2007) J. Cell Sci.
120,2763–2773
36. Nagy, P., Jenei, A., Kirsch, A. K., Szo¨llosi, J., Damjanovich, S., and Jovin, T. M. (1999) J. Cell Sci. 112, 1733–1741
37. Xiao, Z., Zhang, W., Yang, Y., Xu, L., and Fang, X. (2008) Biochem. Bio-phys. Res. Commun. 369,730 –734
38. Jia, C., Zhou, Z., Liu, R., Chen, S., and Xia, R. (2007) Bioelectromagnetics
at CISTI - Natl Research Council, on January 24, 2010
www.jbc.org
28,197–207
39. Gan, H. K., Walker, F., Burgess, A. W., Rigopoulos, A., Scott, A. M., and Johns, T. G. (2007) J. Biol. Chem. 282, 2840 –2850
40. Matar, P., Rojo, F., Cassia, R., Moreno-Bueno, G., Di Cosimo, S., Tabern-ero, J., Guzma´n, M., Rodriguez, S., Arribas, J., Palacios, J., and Baselga, J. (2004) Clin. Cancer Res. 10, 6487– 6501
41. Alexander, A. (1998) Front. Biosci. 3, 729 –738
42. Ness, G. O., Haugen, D. R., Varhaug, J. E., Akslen, L. A., and Lillehaug, J. R. (1996) Int. J. Cancer 65, 161–167
43. Murakami, Y., Mizuno, S., and Uehara, Y. (1994) Biochem. J. 301, 63– 68 44. Alwan, H. A., van Zoelen, E. J., and van Leeuwen, J. E. (2003) J. Biol. Chem.
278,35781–35790
45. Gullick, W. J., Marsden, J. J., Whittle, N., Ward, B., Bobrow, L., and Waterfield, M. D. (1986) Cancer Res. 46, 285–292
46. Wang, X. Q., Sun, P., O’Gorman, M., Tai, T., and Paller, A. S. (2001) Glycobiology 11,515–522
47. Gumbleton, M., Abulrob, A. G., and Campbell, L. (2000) Pharm. Res. 17, 1035–1048
48. Sigismund, S., Woelk, T., Puri, C., Maspero, E., Tacchetti, C., Transidico, P., Di Fiore, P. P., and Polo, S. (2005) Proc. Natl. Acad. Sci. U.S.A. 102, 2760 –2765
49. Chen, Y., Qin, J., and Chen, Z. W. (2008) J. Lipid Res. 49, 2268 –2275 50. Eggeling, C., Ringemann, C., Medda, R., Schwarzmann, G., Sandhoff, K.,
Polyakova, S., Belov, V. N., Hein, B., von Middendorff, C., Scho¨nle, A., and Hell, S. W. (2009) Nature 457, 1159 –1162
51. Lasserre, R., Guo, X. J., Conchonaud, F., Hamon, Y., Hawchar, O., Bernard, A. M., Soudja, S. M., Lenne, P. F., Rigneault, H., Olive, D., Bismuth, G., Nune`s, J. A., Payrastre, B., Marguet, D., and He, H. T. (2008) Nat. Chem. Biol. 4,538 –547
52. Hofman, E. G., Ruonala, M. O., Bader, A. N., van den Heuvel, D., Voort-man, J., Roovers, R. C., Verkleij, A. J., Gerritsen, H. C., and van Bergen en Henegouwen, P. M. (2008) J. Cell Sci. 121, 2519 –2528
at CISTI - Natl Research Council, on January 24, 2010
www.jbc.org