READ THESE TERMS AND CONDITIONS CAREFULLY BEFORE USING THIS WEBSITE.
https://nrc-publications.canada.ca/eng/copyright
Vous avez des questions? Nous pouvons vous aider. Pour communiquer directement avec un auteur, consultez la
première page de la revue dans laquelle son article a été publié afin de trouver ses coordonnées. Si vous n’arrivez pas à les repérer, communiquez avec nous à PublicationsArchive-ArchivesPublications@nrc-cnrc.gc.ca.
Questions? Contact the NRC Publications Archive team at
PublicationsArchive-ArchivesPublications@nrc-cnrc.gc.ca. If you wish to email the authors directly, please see the first page of the publication for their contact information.
NRC Publications Archive
Archives des publications du CNRC
This publication could be one of several versions: author’s original, accepted manuscript or the publisher’s version. / La version de cette publication peut être l’une des suivantes : la version prépublication de l’auteur, la version acceptée du manuscrit ou la version de l’éditeur.
Access and use of this website and the material on it are subject to the Terms and Conditions set forth at An Assessment of Laser Range Measurement of Marble Surfaces
Godin, Guy; Beraldin, Jean-Angelo; Rioux, Marc; Levoy, M.; Cournoyer, Luc
https://publications-cnrc.canada.ca/fra/droits
L’accès à ce site Web et l’utilisation de son contenu sont assujettis aux conditions présentées dans le site
LISEZ CES CONDITIONS ATTENTIVEMENT AVANT D’UTILISER CE SITE WEB.
NRC Publications Record / Notice d'Archives des publications de CNRC:
https://nrc-publications.canada.ca/eng/view/object/?id=1a3b04df-9139-4dad-90ec-9c141cefbd23 https://publications-cnrc.canada.ca/fra/voir/objet/?id=1a3b04df-9139-4dad-90ec-9c141cefbd23
National Research Council Canada Institute for Information Technology Conseil national de recherches Canada Institut de technologie de l'information
An Assessment of Laser Range Measurement of
Marble Surfaces *
Godin, G., Beraldin, J.-A., Rioux, M., Levoy, M., Cournoyer, L. October 2001
* published in Proceedings of the 5th Conference on Optical 3-D Measurement Techniques, Vienna, Austria. October 1-4, 2001. NRC 44210.
Copyright 2001 by
National Research Council of Canada
Permission is granted to quote short excerpts and to reproduce figures and tables from this report, provided that the source of such material is fully acknowledged.
Appeared in: 5th Conference on Optical 3D Measurement Techniques, October 1-4, 2001, Vienna, Austria, pp. 49-56.
An assessment of laser range measurement
on marble surfaces
Guy Godin Marc Rioux J.-Angelo Beraldin
Marc Levoy
*Luc Cournoyer François Blais
Visual Information Technology Group National Research Council Canada
Ottawa, Ontario K1A 0R6 CANADA
*
Computer Graphics Laboratory Stanford University Stanford CA 94305
USA
Abstract. An important application of laser range sensing is found in the 3D scanning and
modelling of heritage collections, and of sculptures in particular. Since a significant proportion of the statues in the world’s museums is composed of marble, the optical properties of this material under laser range sensing need to be understood. Marble’s translucency and heterogeneous structure produce significant bias and increased noise in the geometric measurements. Experiments on a sample of Carrara Statuario marble highlight the relationship between the laser spot diameter and the estimated noise levels in the geometric measurements. A bias in the depth measurement is also observed. These phenomena are believed to result from scattering on the surface of small crystals at or near the surface.
Keywords: Laser range sensing, optical surface measurement, marble, heritage applications.
1. Introduction
Active optical geometric measurement has gained wide acceptance in recent years, due to the increased availability of sensors as well as of efficient algorithms for tasks such as model building. In particular, the documentation of heritage sites, monuments and artefacts is emerging as one of the most active areas for the use of the technology [1,6], with the construction of 3D digital models of sculptures as one of its principal objectives. A significant proportion of the sculptures in museum collections are constituted of marble. Optical 3D sensing and modelling of marble sculptures has been successfully demonstrated through several projects initiated by research groups in North America and Europe. However, it soon became evident that the unique optical properties of marble might have an impact on the actual geometric measurement process, albeit to an extent that does not hinder the practical task of model building in most circumstances. Nevertheless, a better understanding of the related phenomena can guide the use of the gathered data for analytical tasks, as well as orient the design of sensors and scanning strategies.
The underlying hypothesis of active optical geometric measurement is that the imaged surface is opaque and diffusely reflecting. Marble departs from this hypothesis, and exhibits two important optical properties in this context: translucency, and non-homogeneity at the scale of the measurement process. This structure generates two key effects on the geometric measurement: a bias in the distance measurement, as well as an increase in noise level, when compared to a reference opaque surface.
The purpose of this paper is to illustrate, quantify and discuss these phenomena, and some of the variables that affect them. Results are obtained in controlled experiments on a sample of
Godin et al., “An assessment of laser range measurement on marble surfaces” 5th Conference on Optical 3D Measurement Techniques
white Carrara Statuario marble. Actual results obtained on Michelangelo statues are also briefly presented.
1.1. Range sensing
Active optical range sensing operates by illuminating a portion of the surface under controlled conditions, and extracting a quantity from the reflected light (angle of return in triangulation, or time/phase delay in LIDAR) in order to determine the position of the illuminated surface area. This position is normally expressed in the form of a single 3D point. Two important assumptions underlie the range measurement process.
First, it is assumed that the surface is opaque, in that all light reflection towards the sensor occurs at the air/material interface (or surface) of the object being scanned. In reality, a substantial proportion of the materials routinely scanned exhibit some level of subsurface scattering leading to the so-called diffuse reflection process. The light sensed for surface measurement originates not only from the air/material interface, but also from light scattered within the material, thus spreading the angular (or temporal) distribution of the measured signal. In practice however, most materials are sufficiently opaque so that the observable penetration occurs within a depth that is negligible with regards to the overall measurement uncertainty of most systems. This fact may explain why so little attention has been devoted to the study of the effect of translucent materials on range sensing (e.g. [4]) as opposed to that of highly specular surfaces.
The second implicit assumption is one of local uniformity in shape and reflectance properties of the measured surface. In a range image, a single 3D point coordinate summarizes the measurement over the finite area that is illuminated. The roughness of the surface, as well as variations in optical properties (both reflective and transmissive), will affect the measurement process and the relationship between the estimated 3D coordinates of the point and the actual surface geometry.
1.2. Marble
Marble results from the metamorphic transformation of limestone that is recrystallized under high temperature and pressure. It is composed of an aggregation of small packed grains of calcite (CaCO3). This granular structure is visible to the unaided eye, since the size of the
grains can be as large as 1 mm in some types of marble. Crystals of pure calcite (also known as Iceland spar) are transparent, and used in optics for their birefringent properties. In addition to calcite, marble, even in its purest form, contains accessory minerals present in the form of the characteristic veining as well as small isolated grains of a different composition (e.g. mica, quartz).
The microgeometry of the marble surface consists of closely packed crystals. This means that the subsurface propagation does not occur inside a homogeneous medium, but through a succession of microregions of possibly different optical properties. When travelling through marble, light encounters a number of crystalline domains of different size, shape and orientation, as well as air/material interfaces. This results in a very wide scattering, easily observed in visible wavelengths over depths in the order of centimetres in white marble. Figure 1 illustrates the behaviour of HeNe laser light (633 nm) on a block of white Carrara Statuario marble. In (a), subsurface scattering creates a large disk of light around the entry point of the laser. The inset shows a strong first reflection of the laser spot itself in a close-up picture taken at a shorter exposure time. In (b), the laser illuminates the surface at about 1 mm from the edge of the block, at an incidence angle indicated by the arrow; the photograph taken on the perpendicular face illustrates the depth of penetration; this distribution is obviously different from the one occurring within a full volume, since here one half of the scattering domain is removed.
Godin et al., “An assessment of laser range measurement on marble surfaces” 5th Conference on Optical 3D Measurement Techniques
Marble does not follow the two hypotheses of range sensing stated in the previous section: the depth of light penetration is significant, and the material composition is heterogeneous at a scale in the order of the measurement sampling. The first factor is expected to bias the depth measurement since light reflected from under the surface will also reach the detection system of the range sensor, and be superimposed to the component reflected by the first surface. The second factor is expected to significantly affect the optical behaviour even near the air/marble interface, since the grains are of a size comparable to the typical laser spot size or line width (typically 100-500 µm). The main goal of this paper is to experimentally assess the magnitude of these effects.
(a) (b)
Figure 1: Diffusion in a sample of Carrara Statuario marble.
(note: the magenta and white appearance of HeNe light is a saturation artefact of the digital camera)
1.3. Experiments
Experiments are conducted in the laboratory on a sample of clean Carrara Statuario white marble of size 40x40x20 mm. This type of marble, from which most of Michelangelo’s statues are carved, has a fine-grained, non-directional structure. The measured surface of the sample is flat but not polished; some grains and slight greyish veining are visible. All range measurements are performed using the auto-synchronized triangulation range sensor [7,8] developed at the National Research Council of Canada. This sensor uses single spot illumination, and performs the position detection through subpixel peak detection, not centroid estimation [2]. For the tests described here, the sensor was configured and calibrated to operate in a measurement area of a width of 8 cm and over a depth of 10 cm, with the third degree of freedom obtained by a mechanical displacement perpendicular to the triangulation plane, at intervals of 100 µm. All scans were acquired with HeNe laser illumination.
The analysis technique relies on least squares plane fitting, assuming equal weights for all points. For noise level estimation, the standard deviation of the residuals is used. In all of the paper, noise levels are always expressed in terms of one standard deviation σ. Areas smaller than the entire face of the sample are used (typically 1 cm square), since the marble surface is not perfectly planar, and also in order to separate the local random noise from other localized phenomena in measurement. The reported standard deviations are averaged over several such smaller regions. The reference object used for noise level comparison is a flat, uniformly opaque metal-coated surface.
Godin et al., “An assessment of laser range measurement on marble surfaces” 5th Conference on Optical 3D Measurement Techniques
2. Noise in measurement
The first set of experiments aims at determining the measurement noise level on marble, in particular with regards to the diameter of the laser spot projected on the surface. On the NRCC sensor, the laser spot cannot be modified independently. But since the laser is focused near the centre of the measurement field, taking measurements at different distances from the sensor yields a range of incident spot diameters. However a change in measurement distance induces other effects: triangulation error is a function of distance, and since the sampling in the triangulation plane is determined in angular increments, the sampling density on the surface is also affected. As a control, the opaque reference surface is therefore scanned at the same depths as the marble (aligned manually to within one millimetre), at 11 positions distributed around the position of smallest diameter. The diameter of the laser spot at different heights is determined with a spot-profiling instrument, under the 13.5% cut-off criterion. Scans of the reference surface as well as the marble are taken, and the noise level is determined from the residuals of plane fitting.
Figure 2: Effect of incident spot diameter on measurement noise.
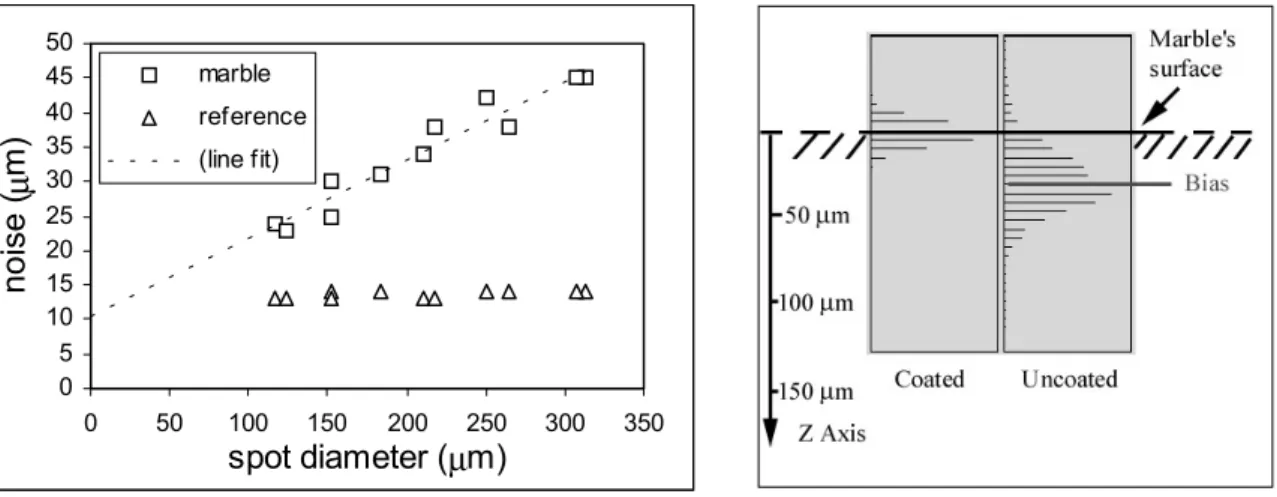
Figure 2 summarizes the results: the noise levels on marble as a function of distance extend from 23 to 45 µm, whereas they remain around 14 µm on the reference surface. The curve of spot diameter is also plotted, showing a strong similarity in shape with the curve of the noise on marble. In comparison, the noise is lower and almost constant on the reference surface. In Figure 3, the relationship between noise on marble and spot diameter appears almost linear when plotted one against the other.
Our explanation for the increase in noise as a function of spot diameter relates to the heterogeneous reflection properties encountered on the marble surface within the area illuminated by the laser spot. The individual crystals at or near the air/marble interface reflect light in preferred directions. This phenomenon also causes the scintillation visible under ordinary illumination on clean marble. The crystals are at a scale similar to that of the typical spot diameter. Under intense laser illumination, some of these reflections on crystals will distort the distribution of light reflected towards the sensor and interfere with the depth measurement by skewing the image of the spot. The magnitude of the effect on depth measurement is a function of the intensity of this reflection as well as its location relative to the centre of the spot. The position of this reflection is bounded by the spot size on the
0 5 10 15 20 25 30 35 40 45 50 147 162 177 192 207 222
nominal distance from sensor (mm)
measurement noise ( µ m) 0 50 100 150 200 250 300 350 400 spot diameter ( µ m) noise on marble noise on reference spot diameter
Godin et al., “An assessment of laser range measurement on marble surfaces” 5th Conference on Optical 3D Measurement Techniques
surface: thus, a larger spot diameter not only increases the probability of encountering such as region, but also extends the possible distance between this reflection and the undistorted spot centre, which in turn increases the amplitude of the effect and the observed noise.
Figure 3: Measurement noise as a function of laser spot diameter.
Figure 4: Measurement bias on uncoated marble surface.
Two alternate explanations for the increase in noise were ruled out through experiments: the first one is that a larger spot reduces the amplitude of the peak of the distribution which, combined with the light loss by transmission into the marble, would reduce the signal-to-noise ratio in the measurement system itself; the second one is that the measured signal-to-noise would correspond to a measurement of the actual surface roughness. Modifying the incident laser power for a fixed measurement distance disproves the first possibility: identical scans were taken at higher, normal and lower power levels on the marble sample; the estimated noise values were not significantly different. The second possibility is not consistent with observations: first, the noise behaviour is almost symmetrical around the position of smallest spot diameter; therefore the effect of sampling density appears to be much less significant than that of the spot diameter (a similar argument holds for the depth-dependent triangulation uncertainty). Furthermore, if the estimated σ and the actual surface roughness were correlated, then a larger spot would normally have the effect of smoothing the data since the returned light over that finite area would be averaged on the detection system. Here, the exact opposite behaviour is observed, thus ruling out this interpretation.
3. Bias in measurement
The second expected effect on marble measurement is a systematic bias of the surface measurement due to translucency. The subsurface scattering of light is expected to shift the measurement of the position below the physical surface. Such a phenomenon is likely to occur with any translucent material: the light scattered within the material is superimposed on the first reflection, thus shifting the estimation of the spot position towards the interior of the material. Peak detection provides a higher level of robustness to this phenomenon [2] than centroid computation. However, the effect is still expected to be present.
The impact of this effect is quantified here using the following experiment: one half of the marble sample is coated with a thin layer of titanium oxide pigment. The thickness of the coating is measured mechanically with a micrometric gauge to be approximately 5 µm. The entire surface of the block is scanned, and two areas are selected, on the coated and on the
0 5 10 15 20 25 30 35 40 45 50 0 50 100 150 200 250 300 350 spot diameter (µm) noise ( µ m) marble reference (line fit)
Godin et al., “An assessment of laser range measurement on marble surfaces” 5th Conference on Optical 3D Measurement Techniques
clear surface; a pair of parallel planes is fitted to the regions. The perpendicular distance between the fitted planes is taken as the bias in measurement.
The result on one typical measurement appears in Figure 4: the bias is approximately 40 µm, less the 5 µm of coating. The histograms of residuals also highlight the difference in noise levels between the raw marble surface and the coated one, in accordance with the results discussed in the previous section. Obviously, translucency is expected to cause a bias. However, the phenomenon is not as strong as could have been expected given the large diffusion of the light inside the volume of the marble. There is a strong reflection coming from the surface of the marble, as seen in Figure 1: the laser spot area is significantly brighter than the surrounding halo. However, the same phenomenon that gives rise to the increase in noise is likely to shift the distribution of light imaged on the position sensor, and since the highly reflecting facets will be at or under the first surface of the marble, this shift will be located on average under the actual physical surface, resulting in the systematic bias.
It is possible to observe the signal corresponding to the imaged spot on the photosensitive array of the NRCC range sensor. Figure 5 shows the spot profile on marble, as well as on the reference surface. The main peak areas are very similar in shape and, more importantly, in width. But the marble profile also includes a low-level, wide distribution, which is the image on the sensor of the large halo on the surface.
Figure 5: Typical spot distributions on the reference surface (left) and marble (right).
4. On-site scans
The laboratory tests were performed on a clean marble sample. Real museum sculptures usually exhibit various degrees of weathering, crusting, and surface finish. During the Digital Michelangelo Project, the same NRCC sensor used in the laboratory experiments was deployed in Florence for high-resolution measurements of patches on seven of Michelangelo’s statues. The marble on these sculptures is aged and their surfaces show different types of finishes. In spite of this difference in aspect with the clean sample, the marble on the statues displayed a substantial level of scattering within the volume, as can be seen in Figure 6. The estimated noise level was also higher than on an opaque reference surface. However, it was noted that the noise structure observed in the measurements was strongly related to the surface finish. On areas with visible tool marks, the noise level was higher on the smoother top surface than at the bottom of the tool marks, in spite of the fact that the surfaces at the bottom of the marks appeared to be geometrically rougher. Figure 7 illustrates the difference in noise level on a patch located on the St-Matthew by applying one-source synthetic Lambertian shading on the surface data.
The difference in optical properties within the tool marks may be due to the crushing of marble crystals under the impact of the chisel within these tool marks. These impacts would lead to smaller reflective facets there, hence less distortion of the shape of the reflected laser beam. Alternatively, the effect may be due to the accumulation of dirt or residues inside the
0 500 1000 1500 2000 2500 110 120 130 140 150 160 170 180 190 200 210 220 pixel intensity 0 500 1000 1500 2000 2500 110 120 130 140 150 160 170 180 190 200 210 220 pixel intensity
Godin et al., “An assessment of laser range measurement on marble surfaces” 5th Conference on Optical 3D Measurement Techniques
tool marks, which reduces subsurface scattering, with an effect similar to the thin coat of pigment used in the bias experiments.
Figure 6: Subsurface scattering on Michelangelo's Bearded Slave. The visible halo around the laser spot is 2 cm approx.
Figure 7: Shaded view of surface data illustrating changes in noise level in tool
marks.
5. Discussion
One important observation from the previous experiments is the increase in measurement noise as a function of spot diameter. An immediate consequence is in setting bounds on the expectation in performance of optical range sensors on marble surfaces. The practical impact of truly random noise is moderated by the fact that 3D models of complex surfaces are obtained by assembling a set of overlapping range images taken from different points of view. The multiple-view averaging process present within most integration methods should attenuate the noise on the resulting surface, as long as it is a zero-mean random process. Different viewpoints imply different directions of incident and reflected light, as well as surface sampling, hence a different noise structure. This effect encourages the acquisition of a larger number of images, and from more points of view, than what is required strictly for the purpose of surface coverage and image registration. However, such an increase will have a significant impact on the acquisition time and computational cost of building the models. The bias effect could in principle be compensated with the use of a predictive model that would take into account all scanning parameters (spot size, directions of incidence and observation, local surface geometry, etc.). Such a complete model remains to be developed. Recent results in the simulation of subsurface scattering [5] may assist in this task. However, the effects of geometric and optical surface conditions and other heterogeneities of the material, as observed in the example of Section 4, might limit the applicability of the model. We believe that simply establishing bounds on the magnitude of noise and bias already allows a better planning of the scanning and modelling of marble structures. The effect of relative surface orientation on the magnitude of the bias as well as the noise is still being evaluated. One possible question about the results in this paper concerns their specificity to the optical and electronic design of the NRCC system. In the context of the Digital Michelangelo project, similar phenomena, but at an even larger magnitude, were observed on the data obtained with the custom Cyberware scanner, using laser-stripe projection [6]. Noise was estimated to be 2-3 times larger on the statues than on optically cooperating surfaces.
Godin et al., “An assessment of laser range measurement on marble surfaces” 5th Conference on Optical 3D Measurement Techniques
Beyond the modelling and characterization of the noise and bias, their reduction becomes the obvious next goal. Our hypothesis is that discontinuous and strong reflections on the marble’s crystals at or near the surface drive both effects. Spacetime analysis [3] improves depth measurements by assuming that, if the laser beam with a Gaussian profile is swept across the object, then the reflected intensity from each point on the object will also follow a Gaussian curve over time. This is true regardless of the presence of local changes in reflectance or shape, or of depth discontinuities. However, if the observed intensity from a surface point is affected by the incident light at nearby points - for example due to subsurface scattering - then it may no longer follow a Gaussian curve over time. Whether or not spacetime analysis will help in this particular situation still requires experimentation.
6. Conclusions
This paper presented laboratory results on the behaviour of laser range scanning on marble. A direct link between the noise level and the diameter of the spot was observed, and a tentative explanation given in terms of reflection on the crystals at or near the marble surface. As can be expected on translucent materials, a bias in the depth measurement was observed, but because of the strong surface reflection compared to the subsurface scattering, along with subpixel peak detection, its impact was shown to be limited. Clean marble, as used in the laboratory, is expected to exhibit the largest effects: quantitative assessment of these same effects should also be performed on marble showing a wide variety of conditions of weathering and finish, as found in museum collections.
Further laboratory experiments are currently under way to improve our understanding of the phenomena involved in scanning marble, in order to establish the limits of noise that might be achievable. Given the large interest in the scanning of marble sculptures, such an understanding is essential to the choice of the sensing technology as well as to establish the limits on the interpretation and use of the geometric information being gathered.
References
1. Beraldin, J.-A. et al. Digital 3D imaging for rapid response on remote sites. Proc. Int. Conf. 3D Digital Imaging and Modelling. 1999. 34-43.
2. F. Blais, M. Rioux. Real-time numerical peak detector. Signal Processing, 1986. 11:145-155.
3. B. Curless, M. Levoy. Better optical triangulation through spacetime analysis. Proc. Int. Conf. Computer Vision, 1995. 987-994.
4. K. Harding, D. Svetkoff. 3D laser measurements on scattering and translucent surfaces. SPIE Proc. Three-dimensional and Unconventional Imaging for Industrial Inspection and Metrology, 1995. 2599:217-227.
5. H. W. Jensen et al. A practical model for subsurface light transport. To appear, Proc. SIGGRAPH 2001.
6. M. Levoy et al. The Digital Michelangelo Project: 3D scanning of large statues. Proc. SIGGRAPH 2000. 131-144.
7. M. Rioux. Laser range finder based on synchronized scanners. Applied Optics, 1984. 23:3837-3844.
8. M. Rioux. Digital 3-D imaging: theory and applications. Proc. SPIE Videometrics III, 1994. 2350:2-15.