HAL Id: hal-00803180
https://hal.sorbonne-universite.fr/hal-00803180
Submitted on 9 Mar 2015HAL is a multi-disciplinary open access archive for the deposit and dissemination of sci-entific research documents, whether they are pub-lished or not. The documents may come from teaching and research institutions in France or abroad, or from public or private research centers.
L’archive ouverte pluridisciplinaire HAL, est destinée au dépôt et à la diffusion de documents scientifiques de niveau recherche, publiés ou non, émanant des établissements d’enseignement et de recherche français ou étrangers, des laboratoires publics ou privés.
Constant-phase-element behavior caused by
inhomogeneous water uptake in anti-corrosion coatings
Sylvain Amand, Marco Musiani, Mark E. Orazem, Nadine Pébère, Bernard
Tribollet, Vincent Vivier
To cite this version:
Sylvain Amand, Marco Musiani, Mark E. Orazem, Nadine Pébère, Bernard Tribollet, et al.. Constant-phase-element behavior caused by inhomogeneous water uptake in anti-corrosion coatings. Elec-trochimica Acta, Elsevier, 2013, 87, pp.693-700. �10.1016/j.electacta.2012.09.061�. �hal-00803180�
Constant‐Phase‐Element Behavior Caused by Inhomogeneous Water Uptake in Anti‐Corrosion
Coatings
Sylvain Amanda, Marco Musianib, Mark E. Orazemc, Nadine Pébèrea, Bernard Tribolletd, Vincent Vivierd aUniversité de Toulouse, CIRIMAT, UPS / INPT / CNRS, ENSIACET, 4, allée Emile Monso – BP 44362, 31030 Toulouse cedex 4, France bIstituto per l’Energetica e le Interfasi, Consiglio Nazionale delle Ricerche,35127 Padova, Italy cDepartment of Chemical Engineering, University of Florida, Florida 32611, USA d Laboratoire Interfaces et Systèmes Electrochimiques, UPR 15 du CNRS, Université Pierre et Marie Curie, 75252, Paris cedex 05, France Abstract The impedance of a substrate/coating/electrolyte system was calculated with the assumptions: (i) the coating uptakes electrolyte to an extent that progressively decreases from the coating/electrolyte interface to the substrate/coating interface where it becomes negligible; (ii) the volume fraction of the electrolyte varies along the coating thickness according to a power‐law; (iii) the resistivity and permittivity profiles of the electrolyte‐penetrated coating can be calculated through an effective medium theory (EMT) formula corresponding to a parallel combination of the two media (electrolyte and coating material); and (iv) some pores extend from the coating/electrolyte interface to the substrate/coating interface, providing a low resistance path. The impedance plots thus calculated exhibited a constant phase element (CPE) behavior in a large frequency range. Some experimental results obtained with 2024 aluminum alloy/hybrid sol‐gel coating samples immersed in a NaCl solution were analyzed with reference to the above described model. The extension of the recently‐developed power‐law CPE model to anti‐corrosion coatings is shown to yield insight into the distribution of resistivity and associated water uptake. Evaluation of mixing rules for conductivities and permittivities of the two media (coating and electrolyte) showed that the linear combination provided results that were consistent with the observed impedance response; whereas, distributions resulting from a series combination of the two media, an EMT formula proposed in the literature, and the Maxwell approximation were incompatible with the observed CPE impedance response. Keywords: CPE; effective medium theory; impedance; porosity; resistivity. * Corresponding author: Marco Musiani m.musiani@ieni.cnr.it
1. Introduction Electrochemical impedance spectroscopy is a popular technique for the assessment of the corrosion protection performance of organic coatings, which has been used for some decades [1‐5]. By following the evolution of the impedance response of a substrate/coating/electrolyte system over an extended period of time, many research groups have been able to monitor the degradation of the coating material and the onset of corrosion processes. The analysis of the impedance data is often based on the classical equivalent circuit proposed by Beaunier et al. in 1976 [2] or its variants. Beaunier’s circuit consists of the uncompensated electrolyte resistance in series with a parallel connection of (i) the coating capacitance and (ii) a branch including the resistance of the electrolyte‐penetrated coating, assumed to be identical to the resistance of the electrolyte inside its pores, in series with a parallel connection of the double layer capacity at the base of the pores (coating/substrate interface) and an impedance representing the corrosion process. In the main variant of Beaunier’s circuit, the coating capacity is replaced by a constant phase element (CPE); additional modifications involve the replacement of the double layer capacity by a second CPE and/or the inclusion of additional elements. Substituting CPEs for capacities may greatly improve the quality of the fitting between the experimental data, which often show a CPE behavior, and the equivalent circuit, but creates ambiguities in the physical interpretation of the results, since the CPE modulus cannot be simply identified with the coating capacity (or the double layer capacity) and the calculation of the effective capacity from the CPE parameters requires a detailed knowledge on the physical reasons for the CPE behavior [6]. Thus, the price to pay for improving the fitting is the loss of information on the coating capacity, a parameter that, following the pioneering work of Brasher and Kingsbury [7], has been used for decades to calculate the electrolyte uptake in the coating. The physical origin of the CPE behavior is still incompletely understood, but it is generally agreed that it must be ascribed to inhomogeneous physical properties of the system [8]. With an original experimental approach, Kittel et al. [9,10] demonstrated marked variations in the impedance of organic coatings along their thickness, and concluded that accurate models for substrate/coating/electrolyte systems should integrate gradients of properties over the thickness of the coatings. However, those authors did not propose any specific resistivity or permittivity profiles. Inhomogeneities in the coating properties have been considered by Hinderliter et al. [11,12] who related these inhomogeneities with electrolyte uptake in the coating and, taking into account various geometries for the electrolyte‐filled coating defects, developed physical models of substrate/coating/electrolyte systems. Roche et al. [13,14] observed the formation of an interphase region, next to the substrate/coating interface, with properties significantly different from those of the bulk coating material. Such an interphase affected the mechanical and adhesion properties of the system.
Our group has recently shown that the impedance of a layer exhibits a CPE behavior if the resistivity of the material varies along the layer thickness according to a power‐law and its permittivity is either independent of the position [15] or varies along the layer thickness only in the low‐impedance parts of the layer [16]. This “power‐law model” has been applied to systems as diverse as passive oxides and human skin [17]. In the present paper a possible extension of the power‐law model to anti‐corrosion coatings is explored. The hypotheses are made that inhomogeneities in the coating morphology cause an inhomogenous electrolyte uptake, stronger near the coating/electrolyte interface and weaker near the substrate/coating interface, and that the dependence of the electrolyte volume fraction on the position along the coating thickness obeys a power‐law. The profiles of resistivity and permittivity resulting from the electrolyte uptake profile are calculated for some effective medium theory (EMT) formulas, and then used to calculate the impedance of the system. It is shown that only one of these formulas leads to CPE behavior. Finally, the theoretical impedance expression is compared to experimental impedance data obtained with hybrid sol‐ gel coatings exposed to a 0.5 M NaCl solution. 2. Theory A schematic representation of a substrate/coating/electrolyte system is presented in Fig. 1a. The coating thickness is denoted and the position along the coordinate perpendicular to the substrate/coating and coating/electrolyte interfaces is expressed in dimensionless coordinates as
x
(1) where x is the distance from the substrate/coating interface. The coating was assumed to be penetrated by the electrolyte which fills a number of pores, the lateral dimension of which may be distributed and not necessarily independent of . In Fig. 1a, the pores are represented as being straight, although they are obviously tortuous in nature. All pores have a mouth at the coating/electrolyte interface and, most of them are not as deep as the coating. Thus, different planes parallel to the interfaces, located within the coating at different positions , cross different numbers of pores, and different elemental layers of the coating, d thick, have different local electrolyte volume fractions (). Some pores (only one is shown in the right side of Fig. 1a) may extend throughout the coating and provide a low‐resistivity path between the electrolyte and the substrate. Thus, the electrical equivalent circuit of the substrate/coating/electrolyte system consists of the electrolyte resistance in series with the parallel combination of two components: a resistance (Rpore), representing the through pores, and an impedance (Zc), representing the electrolyte‐modified coating. Such a circuit is represented in the upper box shown in Fig 1b. The lower box, containing a CPE, accounts for the series impedance response of theoxide layer on the substrate surface. The scheme in Fig. 1a, in which the local electrolyte volume fraction increases as increases, is similar to the one proposed by Hinderliter et al. [11] who, however, clearly separated an outer electrolyte‐affected coating region from an inner pristine coating region and therefore did not consider pores that reach the substrate. Various effective medium theory (EMT) formulas have been proposed that may be used to calculate resistivity and permittivity profiles caused by a distribution of (). Taking into account that, in each elemental layer parallel to the interfaces, each position is occupied by either the coating material or the electrolyte, these two media may be assumed to be in parallel to each other. Therefore, the overall conductivity ( = ‐1) and permittivity () may be obtained as linear combinations of the conductivities and permittivities of the two media (coating and electrolyte) with coefficients equal to the respective volume fractions [11], i.e.,
( )
1
w1( )
c1[1
( )]
(2) and
( )
w( )
c[1
( )]
(3) where the subscripts w and c refer to the electrolyte and the coating material, respectively. Since usually << 1 and 1 c
<<
w1, ) -1 depends linearly on . It was recently shown [15] that a CPE behavior could be due to a variation of ‐1 according to a power‐ law. For a CPE impedance written as CPE1
( j )
Z
Q
(4)the power‐law exponent and the CPE exponent are linked by the relationship
1
(5)In the present work, the hypothesis is made that () changes from (0) = 0 at = 0 to () at = 1 according to a power‐law, i.e., ) 1 )( ( 1 ) ( ) (
(6)The condition(0) ≠ 0 was not considered because Rpore accounts for the contribution of through pores, and therefore only the pores not reaching the substrate/coating interface need to be considered for calculating
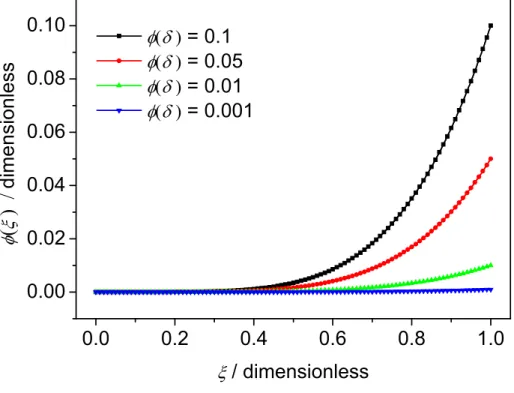
Zc. The electrolyte volume fraction () is presented as a function of position in Fig. 2 for some typical cases. These were calculated following Eq. (6) for different () values between 0.001 and 0.1. An exponent
= 5 was assumed, which corresponds to = 0.8, a typical value found with systems exhibiting a marked CPE behavior. Assumption of a different value of would produce qualitatively similar results.
The resistivity () and dielectric constant () profiles, calculated according to Eqs. (2) and (3) for the same
w, c, w and c values as those considered in reference [11], are shown in Fig. 3. With () = 0.1
(corresponding to a mean electrolyte partial volume < 2%), the resistivity variation across the coating is ca. 8 orders of magnitude. Even with () as low as 0.001, () is 5 orders of magnitude lower than (). In contrast, the permittivity variations are moderate: for () = 0.1, is larger than by only a factor of ca. 2. At low values, i.e., close to the metal/coating interface, Fig. 3a shows a high resistivity region compatible with the assumption of an interphase with properties significantly different from those of the bulk coating [13,14].
Under the assumption that each elemental layer may be represented by a parallel combination of a resistance d and a capacitance d, the impedance of the electrolyte‐penetrated coating (Zc) is calculated as 1 c 1 0 0
1
( )
d
( )
j
( )
Z
(7) Plots corresponding to four different () values are shown in Fig.4, both in Bode coordinates, currently used in the coating community, and in Nyquist coordinates. Clearly, the coating impedance becomes smaller when () increases (and the mean electrolyte partial volume increases). However, the shape of the plots is insensitive to the value of(). The plot of the phase angle clearly shows a CPE behavior in a high‐ frequency range, approximately between 100 Hz and 10 kHz. The CPE behavior is also visible in the high frequency branch of the Nyquist plots.
The frequency dependence of the d log |Zc| /d logf derivative is shown in Fig. 5. In a frequency range where the system exhibits a CPE behavior, d log |Zc| /d logf [18]. The plots corresponding to four
different () values completely overlap with a value of ‐0.8 (corresponding to = 0.8) in the high frequency range. Correspondingly, the constant‐phase‐angle value in Fig. 4b is given by 0.8 × 90° = 72°. To obtain the overall impedance Z of the substrate/coating/electrolyte system, the pore resistance Rpore in parallel with Zc and the electrolyte resistance in series with the parallel combination of Rpore and Zc should be considered. However, in most cases, the electrolyte resistance is practically negligible, and henceforth will be disregarded. Thus Z may be simply calculated as
Z
( )
Z
c( )
1
R
pore1
1 (8)Figure 6 shows impedance plots calculated according to Eq. (8) for various Rpore values and for the resistivity and permittivity profiles corresponding to () = 0, () = 0.1 and = 5. As long as Rpore > Zc(0), where
1 c
0
(0) ( )d
When Rpore becomes progressively smaller, the impedance modulus decreases and tends to approach Rpore, as shown in Fig. 6a; the transition from a CPE to a resistive behavior is shifted to higher frequency, as shown in Fig 6b; and the shape of the Nyquist plots becomes more symmetrical with respect to the maximum of Z”, as shown in Fig. 6c.
Hinderliter et al. [11] considered other effective medium theories, in addition to Eq. (2) and (3). Assuming an electrolyte uptake described by Eq. (6), () = 0, () = 0.1 and = 5, resistivity and permittivity profiles were calculated corresponding to: (i) a series combination of the two media [11], i.e.,
( )
w( )
c[1
( )]
(9) 1)
(
)
(
1
)
(
w c
(10) (ii) an EMT formula proposed by Brasher and Kingsbury [7], i.e.,
log[
(
)
1]
(
)
log[
w1]
[
1
(
)]
log[
c1]
(11)
log ( )
( ) log
w
[1
( )]log
c (12)and (iii) the Maxwell approximation [19], i.e., 1 1 1 1 1 1 w c w c c 1 1 1 1 w c w c
2
2 ( )(
)
( )
2
( )(
)
(13) c w c w c w c w c2
2 ( )(
)
( )
2
( )(
)
(14) The results are shown in Fig. 7. Eq. (9), (11) and (13) give rise to much smoother resistivity profiles than does Eq. (3). The ratio is close to 10 for the Brasher and Kingsbury formula, and below 2 for both the series combination and the Maxwell approximation, in agreement with Hinderliter et al. [11]. The permittivity profiles computed according to Eq. (10), (12) and (14) are also significantly smoother than that calculated according to Eq. (3). The profiles calculated according to Eq. (9)‐(14) were used to obtain the Nyquist plots shown in Fig. 8a, together with a plot corresponding to a simple RC parallel combination with R = c, and C =c. All plots have an almost perfect semicircular shape, i.e., there is no evidence of a CPE behavior. This result is confirmed by the logarithmic plots of Z” as a function of frequency, shown in Fig. 8b. Owing to the moderate variation of resistivity across the coating, the impedances are comparable to that of a coating that has uptaken no electrolyte, and are more than 10 times larger than that shown in Fig. 4 for the same and value. Thus, the distributions resulting from a series combination of the two media [11], described by Eq. (9) and (10); the EMT formula proposed by Brasher and Kingsbury [7], described by Eq. (11) and (12); and the Maxwell approximation [19], described by Eq. (13) and (14) are incompatible with the observed CPE impedance response.In the next two sections a preliminary test of the theory described above is presented. 3. Experimental The sol‐gel coating was prepared by using a polyaminoamide (PAA), 3‐glycidoxypropylethoxysilane (GLYEO), tetraethylorthosilicate (TEOS), butanol and an additional epoxy resin. The compounds were introduced with a GLYEO/TEOS/PAA/Epoxy ratio of 1:1:10:8. The complete chemical structures of the various components cannot be reported here because they are part of proprietary formulations. The sol‐gel film did not contain any pigments or fillers.
The coatings were deposited onto a 2024 T3 aluminum alloy currently used in the aerospace industry. The specimens consisted of 125 × 80 × 1.6 mm plates machined from rolled plate. Before painting, the samples were degreased in an alkaline bath at 60°C (pH = 9) for 15 min, rinsed twice with distilled water, then etched in an acid bath at 52 °C for 10 min, and rinsed again with distilled water. The liquid paints were applied by air spraying and cured at 100°C for 1 hour. The coating thickness was measured at several locations from the observation of the cross‐sections of the samples by SEM and found to be 20 ± 1 m. A three‐electrode electrochemical cell, filled with 0.5 M NaCl, was used in electrochemical impedance measurements. A coated specimen was used as working electrode. A cylindrical Plexiglas tube was assembled on top of the coated sample (exposed surface area of 24 cm²). This cell configuration (recessed system) allowed elimination of the frequency dispersion due to current and potential distributions at the disk electrode [20]. A large platinum sheet and a saturated calomel electrode were used as counter and reference electrodes, respectively. The electrochemical cell was kept at room temperature and open to air. Electrochemical impedance measurements were carried out using a Biologic VSP apparatus. The impedance diagrams were obtained under potentiostatic conditions at the corrosion potential over a frequency range of 60 kHz to 10 mHz with 6 points per decade, using a 20 mV peak‐to‐peak sinusoidal potential. The impedance data analysis was performed using a non‐commercial software developed at the LISE CNRS, Paris, which allowed regression of a model consisting of a combination of passive circuit elements and analytical expressions. This software did not provide confidence intervals. 4. Results and Discussion The impedance of a 2024 T3 aluminum alloy/hybrid sol‐gel coating/0.5 M NaCl solution system was measured at the corrosion potential as a function of the immersion time. As an example, the impedance recorded after 72 hours is presented in Figure 9 (points) in Bode and Nyquist formats. The high‐frequency
loop was attributed to the coating, and the low‐frequency quasi‐vertical straight line was attributed to an oxide film present at the surface of the alloy [21,22]. The experimental data were analyzed with reference to a model consisting of a series combination of an impedance described by Eq. (8), corresponding to the coating, and a CPE, corresponding to the oxide film. An equivalent circuit for such a model is shown in Fig. 1b (all circuit elements). The oxide resistance was assumed to be very large, in agreement with the quasi‐ capacitive blocking behavior observed at low frequency in all experiments, therefore, no resistance was considered in parallel with the CPE associated with the oxide layer shown in Figure 1b. Such a behavior suggests that, for the immersion times explored in the present work, the coating‐oxide ensemble effectively protects the underlying metal from corrosion, and circuit elements accounting for corrosion reactions need not be considered. Due to the resistivity of the electrolyte (22 cm) and the electrode size (24 cm2), the electrolyte resistance could be neglected.
In the regression procedure, , and Rpore were the only adjustable parameters for the coating; whereas,
w, c, w and c were given fixed values (w = 2.22 × 101 cm, c = 2 × 1011 cm, w = 82 and c = 8). The adjustable parameters for the oxide, Q and , are not discussed here as they are not relevant to the model presented above for the coating. The regression results are shown in Fig. 9 as solid lines. The agreement with the experimental data was good over the entire frequency range, both in Nyquist and Bode
coordinates. The and Rpore values measured for four immersion times are reported in Table 1. As the coating degradation proceeded, the electrolyte uptake became progressively stronger, although it
remained at low levels ( just exceeded 1 × 10‐4 after 168 hours), and R
pore became smaller. In Fig. 9, the low‐frequency limit of the coating impedance is close to Rpore, i.e., the pseudo‐diameter of the high‐
frequency loop may be identified with the pore resistance as for the classical Beaunier’s circuit [2], and, therefore, the high‐frequency loop is almost symmetrical with respect to the Z” maximum (compare with Fig. 6c).
The dependence calculated with the best fitted and values is shown in Fig. 10 for three different immersion times. Sharp resistivity profiles were obtained, even for the small fitted values of . The dependence was also calculated; however, the permittivity underwent only negligible variation (between 8 and 8.009, for 168 hours) and, therefore, no plot is shown. The model did not fit as well for some other hybrid sol‐gel coatings with different formulations, tested in electrolytes less aggressive than 0.5 M NaCl. Presumably, a more sophisticated interpretation is needed for those systems, and work is underway to refine the model. The above results, however, provide a preliminary validation of the model proposed in the present manuscript. The results confirm the assumption that the value of in the power‐law model can be considered as a constant parameter. The use of the power‐law model shows that the water uptake through the coating induces a CPE behavior without
significant variation of the permittivity. EIS data relevant to other substrate/coating/electrolyte systems are being examined and will be described in a following paper. 5. Conclusions Observation of a CPE behavior in the impedance of a substrate/coating/electrolyte system may be explained by an inhomogeneous electrolyte uptake giving rise to a power‐law profile, if the local resistivity and permittivity values at each position along the coating thickness, and , are calculated by an EMT formula corresponding to the parallel combination of the coating material and the electrolyte. Since the individual resistivities of the two media, c and w, typically differ by several orders of magnitude, the electrolyte uptake causes marked resistivity variations across the coating. In contrast, the permittivity undergoes only a mild variation since the individual permittivities, c and w , differ by a factor of about 10. These results allow the extension of a previously derived model [15,16], applied so far to passive oxides and human skin [17], to anti‐corrosion coatings.
When experimental EIS data recorded with 2024 aluminum alloy coated with hybrid sol‐gel coatings, immersed in aqueous NaCl solution, were analyzed with reference to the model described in the present work, good quality fitting was obtained using as adjustable parameters for the coating only , and Rpore. The fitted values were quite low (of the order of 10‐4 or lower), but sufficient to cause resistivity variations over at least 5 orders of magnitude (and virtually no variation of permittivity). The coating degradation was caused by the combined effect of increasing and increasing the number and/or cross‐ section of the through pores, witnessed by the decreasing Rpore values.
Acknowledgements The experimental data were obtained in the framework of the SMILE project (Surface Mono Innovative Layer for Environment, with the financial support of the DGCIS (Direction Générale de la Compétitivité, de l’Industrie et des Services). S. Amand and N. Pébère thanks the partners of the project: Mapaero (Pamiers), Rescoll (Bordeaux), Airbus (Toulouse), Dassault (Paris), EADS IW (Suresnes), l'Electrolyse (Bordeaux), and the laboratories LCPO and US2B (Université de Bordeaux). M. Musiani acknowledges financial support from the CNR Short Term Mobility program. M. E. Orazem acknowledges financial support from the Charles A. Stokes Professorship.
References [1] Y.N. Mikhailovskii, V.V. Leonov, N.D. Tomashov, Korr. Met. Spanov 202 (1965) 202 (British Lending Library Translation). [2] L. Beaunier, I. Epelboin, J.C. Lestrade, H. Takenouti, Surf. Technol. 4 (1976) 237. [3] F. Mansfeld, M.W. Kending, S. Tsai, Corrosion 38 (1982) 478. [4] F. Mansfeld, Electrochim. Acta, 35 (1990) 1533. [5] P.L. Bonora, F. Deflorian, L. Fedrizzi, Electrochim. Acta 41 (1996) 1073. [6] B. Hirschorn, M.E. Orazem, B. Tribollet, V. Vivier, I. Frateur, M. Musiani, Electrochim. Acta, 55 (2010) 6218 . [7] D.M. Brasher, A.H. Kingsbury, J. Appl. Chem. 4 (1954) 62. [8] M. E. Orazem, B. Tribollet, Electrochemical Impedance Spectroscopy, John Wiley & Sons, Hoboken, NJ, 2008. [9] J. Kittel, N. Celati, M. Keddam, H. Takenouti, Prog. Org. Coat. 41 (2001) 93. [10] J. Kittel, N. Celati, M. Keddam, H. Takenouti, Prog. Org. Coat. 46 (2003) 135. [11] B.R. Hinderliter, S.G. Croll, D.E. Tallman, Q. Su, G.P. Bierwagen, Electrochim. Acta 51 (2006) 4505 [12] O.A. Stafford, B.R. Hinderliter, S.G. Croll, Electrochim. Acta 52 (2006) 1339. [13] A. A. Roche, M. Aufray, J. Bouchet, J. Adhesion, 82 (2006) 861. [14] M. Aufray, A. A. Roche, J. Adhesion Sci. Technol.20 (2006) 1889. [15] B. Hirschorn, M. E. Orazem, B. Tribollet, V. Vivier, I. Frateur, M. Musiani, J. Electrochem. Soc. 157 (2010) C452. [16] M. Musiani, M. E. Orazem, N. Pébère, B. Tribollet, V. Vivier, J. Electrochem. Soc. 158 (2011) C424. [17] B. Hirschorn, M. E. Orazem, B. Tribollet, V. Vivier, I. Frateur, M. Musiani, J. Electrochem. Soc. 157 (2010) C458. [18] M.E. Orazem, N. Pébère, B. Tribollet, J. Electrochem. Soc. 153 (2006) B129. [19] R.E. De La Rue, C.W. Tobias, J. Electrochem. Soc. 106 (1959). [20] I. Frateur, V.M.‐W. Huang, M.E. Orazem, N. Pébère, B. Tribollet, V. Vivier, Electrochim. Acta 53 (2008) 6218. [21] J.‐B. Jorcin, M.E. Orazem, N. Pébère, B. Tribollet, Electrochim. Acta 51 (2006) 1473. [22] G. Boisier, N. Portail, N. Pébère, Electrochim. Acta 55 (2010) 6182.
Captions for Figures Figure 1. (a) Schematic representation of a substrate/coating/electrolyte system. (b) Equivalent circuit; the upper box corresponds to Eq. (7) and the complete circuit is the one used for regression. The CPE in the lower box was included to account for an oxide layer existing on the aluminum alloy electrode.
Figure 2. Water uptake profiles with as a parameter, calculated according to Eq. (6) with = 0 and = 5. Figure 3. Resistivity (a) and permittivity (b) profiles with as a parameter, calculated according to Eqs. (2) and (3) respectively, with c = 2 × 1011 cm, w = 330 cm, c = 8, w = 82, = 0, and = 5. Figure 4. Impedance plots with as a parameter, in Bode coordinates (a) and (b) and Nyquist coordinates (c), calculated according to Eq. (7) with = 20 m and the conductivity and permittivity profiles shown in Fig.3, i.e. with = 0 and = 5.
Figure 5. Frequency dependence of
d log |
Z
c"| /d log
f
, calculated with the same parameters as for Fig. 4.Figure 6. Impedance plots with Rpore as a parameter, in Bode coordinates (a) and (b) and Nyquist coordinates (c), calculated according to Eq. (8) with = 0, = 0.1, and = 5. To facilitate the comparison of the shape of the diagrams, the impedance is normalized by the polarization resistance Rp.
Figure7. Resistivity (a) and permittivity (b) profiles calculated for = 0, = 0.1, and = 5, according to the equations indicated on the figure. Figure 8. Impedance plots, in Nyquist (a) and logZ” vs. logf (b) coordinates, calculated according to Eq. (7), for the resistivity and permittivity profiles shown in Fig. 7. The solid line is the coating impedance in the absence of electrolyte uptake. Figure 9. Impedance plots recorded with 2024 aluminium alloy/hybrid sol‐gel coating, after a 72‐hour immersion in 0.5 M NaCl solution. The experimental data (points) are compared with the regression results (solid line).
Figure 10. Resistivity profiles in an electrolyte‐penetrated hybrid sol‐gel coating, calculated according to Eqs. (2) and (3), with the best fitted and values obtained for the three immersion times reported on the figure.
Table 1. Dependence of and Rpore on the duration of the immersion of the 2024 aluminum alloy/hybrid sol‐gel coating sample in 0.5 M NaCl.
Immersion time in 0.5 M NaCl / h
/ dimensionless / dimensionless Rpore / cm2
24 1.46 × 10‐5 3.5 1.04 × 10⁶
48 2.24 × 10‐5 3.4 3.12 × 10⁵
72 3.21 × 10‐5 3.1 2.11 × 10⁵
168 1.16 × 10‐4 3.0 5.15 × 10⁴
Figure 1. (a) Schematic representation of a substrate/coating/electrolyte system. (b) Equivalent circuit; the upper box corresponds to Eq. (7) and the complete circuit is the one used for regression. The CPE in the lower box was included to account for an oxide layer existing on the aluminum alloy electrode.
= 1
Electrolyte Coating Substrate
R
poreR
poreR
eZ
cCPE
(a)
(b)
0.0
0.2
0.4
0.6
0.8
1.0
0.00
0.02
0.04
0.06
0.08
0.10
= 0.1
= 0.05
= 0.01
= 0.001
(
) /
di
mensi
onl
ess
/ dimensionless
Figure 2. Water uptake profiles with as a parameter, calculated according to Eq. (6) with = 0 and = 5.