O
pen
A
rchive
T
OULOUSE
A
rchive
O
uverte (
OATAO
)
OATAO is an open access repository that collects the work of Toulouse researchers and
makes it freely available over the web where possible.
This is an author-deposited version published in : http://oatao.univ-toulouse.fr/
Eprints ID : 10102
To link to this article : DOI:10.1021/la4006086
URL :
http://dx.doi.org/10.1021/la4006086
To cite this version : Ledesma-Alonso, René and Legendre,
Dominique and Tordjeman, Philippe AFM tip effect on a thin liquid
film. (2013) Langmuir, vol. 29 (n° 25). pp. 7749-7757. ISSN
0743-7463
Any correspondance concerning this service should be sent to the repository
administrator: [email protected]
AFM Tip Effect on a Thin Liquid Film
R. Ledesma-Alonso, D. Legendre,* and Ph. Tordjeman*
Institut de Mécanique des Fluides de Toulouse (IMFT), INPT-CNRS, Université de Toulouse, Allée du Professeur Camille Soula, 31400 Toulouse, France
ABSTRACT: We study the interaction between an AFM
probe and a liquid film deposited over a flat substrate. We investigate the effects of the physical and geometrical parameters, with a special focus on the film thickness E, the probe radius R, and the distance D between the probe and the free surface. Deformation profiles have been calculated from the numerical simulations of the Young−Laplace equation by taking into account the probe/liquid and the liquid/substrate interactions, characterized by the Hamaker constants, Hpland Hls. We demonstrate that the deformation of a shallow film is determined by a particular characteristic length λF= (2πγE4/ Hls)1/2, resulting from the balance between the capillary force (γ is the surface tension) and the van der Waals liquid/
substrate attraction. For the case of a bulk liquid, the extent of the interface deformation is simply controlled by the capillary length λC= (γ/Δρg)1/2. These trends point out two asymptotic regimes, which in turn are bounded by two characteristic film thicknesses Eg= (Hls/2πΔρg)1/4and Eγ= (R2Hls/2πγ)1/4. For E > Eg, the bulk behavior is recovered, and for E < Eγ, we show the existence of a particular shallow film regime in which a localized tip effect is observed. This tip effect is characterized by the small magnitude of the deformation and an important restriction of its radial extent λFlocalized below the probe. In addition, we have found that the film thickness has a significant effect on the threshold separation distance Dminbelow which the irreversible jump-to-contact process occurs: Dminis probe radius-dependent for the bulk whereas it is film-thickness-dependent for shallow films. These results have an important impact on the optimal AFM scanning conditions.
1. INTRODUCTION
The current development of nanotechnology is responsible for the emergence of micro- and nanofluidic systems.1 A large number of these systems are based on the flow of very thin liquid films in confined geometries.2 Under these conditions, capillary and van der Waals forces are dominant, and as a consequence, the behavior of liquids is strongly dependent on the film thickness. For instance, the flow relaxation time,3,4the slip length,5 and the glass-transition temperature,6,7 among other properties, are controlled by the characteristic length of confinement.
The properties of a liquid film as function of its thickness, from the molecular to the macroscopic scale, can be studied by means of atomic force microscopy (AFM) as a result of the recent progress of this technique.8,9Indeed, noncontact AFM is a useful method for quantifying the local properties of liquid films,10 identifying the local positions of interfaces, and detecting liquid-phase domains and studying their rheology. In such experiments, the study of the probe/liquid film interaction is fundamental to understanding the behavior of liquids of different thicknesses. With respect to the extensive work done by means of the surface force apparatus (SFA), we recall that the thickness has been shown to be a fundamental parameter in determining the stability of the film.11In addition, it has been proposed, for a liquid nanofilm,12 that the film
thickness should have a significant effect on AFM measure-ments and also promising applications.
In our previous studies,13,14the surface deformation of a bulk liquid in interaction with an AFM tip has been modeled, solved numerically, and validated with experiments. We have shown that the magnitude of the bulk liquid surface deformation and its curvature are functions of the probe/liquid separation distance. When a probe is approached towards the liquid surface below a threshold separation distance, we have found that the liquid undergoes a jump-to-contact phenomenon, which triggers probe wetting. Knowledge of this critical distance, called Dmin, is essential to determining the experimental optimal conditions for noncontact AFM measure-ments over liquids. We have demonstrated that a combined approach, based on theory and experiments, leads to a better understanding of the whole phenomenon. In particular, a fine prediction of the Hamaker interaction constant has been deduced from AFM force/distance curves.13
The aim of this Article is to analyze the effect of the film thickness on the surface deformation. For this purpose, the Young−Laplace equation has been generalized to include the interaction between the liquid film and the underlaying
substrate. The present communication is organized as follows: in section 2, we describe briefly the system configuration, together with the corresponding theoretical model, in which molecular interactions and capillarity are included. Section 3 discusses the general surface deformation and the jump-to-contact phenomenon and their dependency on the involved dimensionless parameters in which some of them are thickness-dependent. Several characteristic length scales, naturally arising in the model, are introduced and employed to describe the surface shape. The theoretical analysis allows us to define two critical film thicknesses, marking the boundaries of a shallow film regime and the bulk behavior, which are presented in section 4 and discussed in section 5. Finally, in section 6 the effects of the probe radius and the film thickness are studied quantitatively in order to apply the results when performing AFM measurements.
2. PROBLEM FORMULATION
Consider a stable liquid film of thickness E deposited over a flat substrate, as shown in Figure 1. When a spherical probe of
radius R is placed at a distance D from the liquid free surface, a bump-like shape is observed. Because of the system geometry, the deformation is described by an axisymmetric profile z = η(r), where r and z are the radial and axial coordinates.
On the basis of the Hamaker theory,15 the attractive interaction potential or pressure field Πpl exerted by the probe over the liquid film is
π Π = − + − H R D z r R 4 3 1 [( ) ] pl pl 3 2 2 2 3 (1)
where Hpl is the Hamaker constant of the probe/air/liquid system. Equation 1 is obtained from integrating the London− van der Waals interaction potential of the spherical probe over a differential volume of liquid, anywhere outside the probe. Only the nonretarded interactions are considered in view of the dimensions of common AFM setups.
The presence of the substrate provokes, over the liquid film, the potential field Πlsgiven by
π Π = − + − ⎡ ⎣ ⎢ ⎤ ⎦ ⎥ H E z E 6 1 ( ) 1 ( ) ls ls 3 3 (2)
where Hls is the Hamaker constant of the air/liquid/substrate system. This potential is the difference between the so-called disjoining pressure16 of the initial state and that of the perturbed state (by the approach of the probe). Furthermore, the capillary pressure difference and the hydrostatic pressure
appear in the pressure balance so that the surface shape of the film is described by the generalized Young−Laplace equation
ρ η κγ Π − Δ g =2 + Π
pl ls (3)
where Δρ is the liquid/air density difference, g is the gravitational acceleration, γ is the liquid surface tension, η is the local surface position, and κ is the local mean curvature, which, expressed in axisymmetric cylindrical coordinates, takes the form κ= − η η + − ⎜ ⎟ ⎡ ⎣ ⎢ ⎢ ⎧ ⎨ ⎩ ⎛ ⎝ ⎞ ⎠ ⎫ ⎬ ⎭ ⎤ ⎦ ⎥ ⎥ r r r r r 2 1 d d d d d d 1 2 1/2 (4)
Using R as the characteristic length scale, we introduce dimensionless variables: D* =D/
Rthe distance from the center
of the probe to the originally undeformed free surface, E* =E/ R
the film relative thickness, r* =r/
Rand z* =z/Rthe horizontal
and vertical coordinates; and η* = η/
R and κ* = κR, the
interface position and mean curvature. From eqs 1−4, the dimensionless nonlinear ordinary differential equation describ-ing the free surface position results in
κ* − AH Π* +Bη* −HΠ* = 2 8 0 a ls o a pl (5) where η Π* = * + * − * E E 1 ( ) 1 ( ) ls 3 3 (6a) η Π* = * − * + * − D r 1 [( ) 1] pl 2 2 3 (6b)
Three dimensionless parameters are present in eq 5: the Hamaker constant ratio A = Hls/Hpl, the modified Hamaker number Ha = 4Hpl/(3πγR2), and the Bond number Bo = ΔρgR2/γ.
In AFM setups, the probe radius R is within the range [10−9, 10−7] m, and the probe/liquid and liquid/substrate interactions are characterized by Hamaker constants Hpl and Hls within [10−21, 10−19] J.17−20For air/liquid interfaces, one usually has γ ∈ [10−2, 10−1] N/m and Δρ ∈ [102, 104] kg/m3. Consequently, for a film thickness E spanning [10−10, ∞] m, the dimensionless parameters are normally found to satisfy A ∈ [10−2, 102], H
a∈ [10−7, 100], and Bo∈ [10−13, 10−8]. In particular, considering a PDMS film deposited over a silicon wafer and in interaction with an R = 1 × 10⁻⁸m silicon AFM probe, the system is characterized by γ = 3.1 × 10⁻²N/m, Δρ = 9.7 × 10² kg/m3, and H
ls = Hpl= 4 × 10⁻²⁰ J.13The nondimensional numbers are then A = 1, Ha= 5.48 × 10⁻³, and Bo= 3.07 × 10⁻¹¹, and the film relative thickness should span E* ∈ [10−2, ∞].
Equation 5 was solved numerically following a previously developed method14in which the supplementary term given by eq 6a, arising from the liquid/substrate interaction, has been introduced. The symmetry condition [η*]′ = 0 at r* = 0, a nearly flat surface profile [η*]′ ≪ 1, and a negligible probe/ liquid interaction potential Πpl*≈ 0 far from the symmetry axis were maintained as boundary conditions.
To calculate the film deformation analytically, we can write the separation distance D* as a function of the apex position η0* and the curvature κ0*at r* = 0 as follows
η η κ
* = * + + * * −
D 0 1 [ (f 0, 0)] 1/3 (7)
Figure 1. Surface deformation of the liquid film interacting with a spherical probe.
where the function f(η0*, κ0*) is defined as η* κ* = κ η η * + * − + * * + * − ⎡ ⎣ ⎢ ⎢ ⎛ ⎝ ⎜⎜ ⎞ ⎠ ⎟⎟ ⎤ ⎦ ⎥ ⎥ f H A E E B H ( , ) 2 8( ) 1 1 a o a 0 0 0 3 0 3 0 (8)
D* can also be expressed by introducing ε0*, the dimensionless gap between the probe surface and the deformed liquid interface inferred from Figure 1:
η ε
* = + * + *
D 1 0 0 (9)
In dimensional terms, D − R represents the gap between the probe and the nondeformed film surface. Comparing eq 9 with an expansion of eq 7 gives ε η κ η κ η κ * = * * − * * + * * − − − f f O f 1 2[ ( , )] 1 8[ ( , )] {[ ( , )] } 0 0 0 1/3 0 0 2/3 0 0 1 (10)
which allows us to calculate the magnitude of the gap if f(η0*, κ0*) is known.
In previous studies,12−14,21it has been stated that no solution of the problem can be found for distances below the threshold distance Dmin* because the jump-to-contact phenomenon takes place. This minimum separation distance also marks the critical point at which the maximum apex deformation η0,max* and the maximum curvature κ0,max* occur. Dmin* is obtained directly when dD*/dη0*= 0, which applied to eq 7 gives
η η η ′ * = * + * − f f f 1 36{ ( 0,max)} [ ( )] {1 [ ( )] } 2 0,max 8/3 0,max 1/3 (11)
An expression f(η0*), which must be used in eq 11 to obtain η0,max* , exists when it is possible to express the curvature in terms of the apex deformation, κ0*(η0*). Afterward, once η0,max* is known, Dmin* is determined using eq 7.
In the following section, this approach is applied to generate analytical expressions of the maximum deformation η0,max* and the minimum distance Dmin* in the asymptotic cases corresponding to E* → 0 (shallow-film limit) and E* → ∞ (thick-film limit).
3. SURFACE SHAPE
3.1. General Description. Some typical surface profiles obtained numerically are shown in Figure 2 for a radial extension of about 10 times the probe radius. Note that the
presented window is much smaller than the capillary length so that the entire interface deformation is not shown. The profiles are reported for a single separation distance of D* = 1.29 and for Ha= 5.48 × 10⁻³, Bo= 3.07 × 10⁻¹¹, and A = 1. The relative thickness E* varies over several orders of magnitude in the range of [10−10, ∞]. We observe that all of the profiles exhibit a bump-like shape that is roughly parabolic around r* = 0, followed by an exponential-like decay. The profiles obtained for E* > 102 are overlapped, indicating the existence of an asymptotic bulk regime. The vertical displacement of the surface weakens in magnitude, and the deformation seems to be confined to a shorter radial extent as E* is reduced. In addition, the curvature of the surface at r* = 0 lowers with decreasing E*. The corresponding behavior of apex deformation η0*at r* = 0 is shown in Figure 3 as a function of the separation distance
D*. As observed for infinite film thickness,14,22 we found a stable and an unstable position of the interface for any film thickness. In Figure 3, we present the stable deformation, corresponding to the minimal free energy of the system, that is present when experiments are performed. Similar hyperbolic evolutions for η0* are observed for the different values of E*. When sweeping from right to left, as the curve approaches the threshold distance Dmin* , the slope increases dramatically until a vertical asymptote is reached. At Dmin* , the maximum possible apex position η0,max* is attained. For shorter separation distances, the probe/liquid attraction becomes unconstrained and the so-called jump to contact is observed, which provokes the wetting of the probe in a real situation. Consistent with expectations on physical grounds, a decrease in E* leads to a decrease of Dmin* along with a shrinkage of η0,max* as the attractive liquid/substrate potential pulls the liquid film uniformly downward, therefore inhibiting its upward displacement. In other words, when the film thickness is decreased, the jump to contact is shifted to separation distances shorter than that observed for a bulk liquid. Additionally, it is relevant to remark that a reduction of E* provokes a similar effect to that induced by a diminution of Hafor the bulk.14
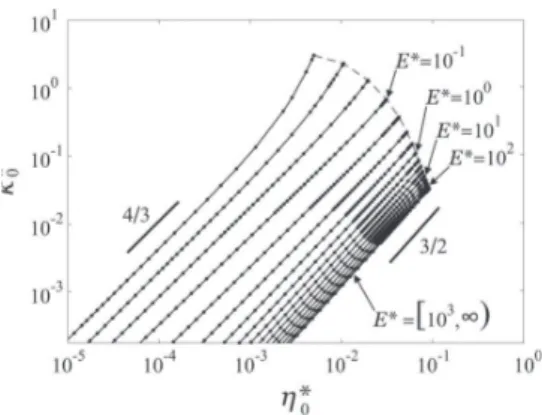
The corresponding evolution of the apex curvature κ0*as a function of the surface deformation η0*is shown in Figure 4 for different values of the relative thickness E*. As a general trend, for a given E*, the apex curvature increases along with the associated deformation, showing a nearly constant slope on the presented logarithmic scale. Nevertheless, mainly observed for the curves belonging to E* ≤ 10−1, the slope gradually becomes
Figure 2.Surface profiles of the film η* obtained from solving eq 5, at a constant D* = 1.29, for different values of E* and for Ha= 5.48 ×
10−3, B
o= 3.07 × 10⁻¹¹, and A = 1.
Figure 3.Apex position η0*of the air/liquid interface as a function of
D* for different values of E* and for Ha= 5.48 × 10⁻³, Bo= 3.07 ×
10−11, and A = 1. (•) Numerical solutions of eq 5 and (---) extreme
steeper as η0*increases and approaches the value of η0,max* . In most cases, the behavior of each curve seems to be properly described by a power law. For relatively thick films, an exponent of3/
2has been found,12,13whereas for shallow films and small deformations an exponent of 4/
3 is discerned. The theoretical analysis of these two particular power laws is given in section 4.
3.2. Jump to Contact.Now the effect of the film thickness on the jump-to-contact condition is discussed. Figure 5 reports the evolution of the maximum apex position η0,max* and the minimum separation distance Dmin* as function of the film relative thickness. Both Dmin* and η0,max* show analogous trends. The bulk behavior is characterized by a plateau, which in the
presented case takes the values Dmin* ≈ 1.29 and η0,max* ≈ 0.09 for thicknesses E* > 102. However, D
min
* → 1 and η0,max* → 0 when the limit of E* → 0 is approached. These two asymptotic behaviors are associated with two characteristic film thicknesses that will be discussed in more detail in the following section. For intermediate thicknesses typically varying from 10−1to 102, Dmin* and η0,max* go through a transition regime associated with noticeable variations due to the film thickness. It is interesting that for the nondimensional parameters considered here η0,max* never takes larger values than the film relative thickness E*. In other words, η0,max* /E* < 1.
In Figure 6, interface shape η* at D* = Dmin* is shown as a function of the radial position r* for different values of E*. As
previously discussed, the maximum apex position η0,max* and the radial extent of the deformation diminish when E* is reduced. As a consequence, the surface profile sharpens, which provokes a dilatation of the curvature at the surface apex. Indeed, as observed in Figure 4, for a fixed value of η0*, the apex curvature κ0* grows significantly by orders of magnitude when the film relative thickness E* decreases.
On the basis of these results, we can define two behaviors depending on the film thickness. For thin films, the amplitude of the surface deformation is small and restricted to a length scale significantly shorter than the capillary length, clearly indicating the appearance of a localized tip effect. This phenomenon is characterized by a deformation profile of confined radial extent, specifically restricted to the near-field underneath the probe. In contrast, for thick films, the surface deformation of large magnitude is observed up to the capillary length. Hence, the tip effect is not observed for thicknesses above a characteristic value, which is found within E* ∈ [102, 103], and as a consequence, the deformation corresponds to that of the bulk.14
3.3. Deformation Length Scales. To understand the localized tip effect and to identify the different length scales arising in this problem, we linearize normalized eq 5 for small surface deformations. Far from the axis, where r* → ∞, the surface is nearly flat, [η*]′ ≪ 1, the probe/liquid interaction potential is negligible, Πpl* ≈ 0, and the liquid/substrate interaction potential, Πls*, is approximated by the first-order term in eq 6a for [η*] ≪ E*. Therefore, the surface profile in this region is obtained from
η η λ λ η * ∗ + ∗ * ∗ − *− + *− ∗ = r r r d d 1 d d [( ) ( ) ] 0 2 2 C 2 F 2 (12)
Figure 4.Apex mean curvature κ0*as a function of η0* obtained for
different values of E* and for Ha= 5.48 × 10⁻³, Bo= 3.07 × 10⁻¹¹, and
A = 1. (•) Numerical solution of eq 5 and (---) extreme values κ0,max*
and η0,max* .
Figure 5.(a) η0,max* and (b) Dmin* , as functions of E*, for Ha= 5.48 ×
10−3, B
o= 3.07 × 10⁻¹¹, and A = 1. (•) Numerical solution of eq 5 and
asymptotic approximations for (---) E* > Eg*and (−) E* < Eγ*, with Eg*
= 9.05 × 101and E γ
*= 2.13 × 10⁻¹. The approximations are obtained by applying eqs 19 and 20 for thick films and eq 23 for shallow films to eqs 11 and 7 in sequence. The characteristic thicknesses, Eg*and Eγ*,
are defined in eqs 14 and 15, respectively.
Figure 6.Surface profiles of the film η* obtained from solving eq 5 at
D* = Dmin* for different values of E* and for Ha= 5.48 × 10⁻³, Bo=
where the dimensionless capillary length λC* = λC/R = (γ/ ΔρgR2)1/2 and a dimensionless film characteristic length λ
F *= λF/R = (8(E*)4/(3AH
a))1/2 appear. λF = (2πγE4/Hls)1/2 corresponds to the radial distance beyond which the liquid/ substrate interaction contributes to the flattening of the liquid surface. A condition for observing the localized tip effect is thus given by λF≪ λC, which is satisfied in the shallow film limit E → 0. As clearly revealed in eq 12, these two length scales are compared through an effective capillary length, λCF* = 1/((λC*)−2 + (λF*)−2)1/2, that indicates which one of the two mechanisms, gravity or the liquid/substrate interaction, prevails and controls the radial extent of the deformation. In the literature,12 the inverse of λCF* has been introduced as an effective Bond number, which indicates when the effect of the substrate is negligible. Indeed, the exact solution of eq 12 is given by
η λ * = * * ⎛ ⎝ ⎜ ⎞ ⎠ ⎟ GK0 r CF (13)
where K0 is a zeroth-order modified Bessel function of the second kind and G = ηCF*/K0(1), with ηCF* being the surface deformation at r* = ηCF*. For the studied range of parameters, G ≲ 10−2and K
0(1) ≈ 0.42. Thus, for r* ≥ ηCF*, η* ≲ 10−2and
[η*]′ ≲ 10−3, demonstrating the validity of the small deformation hypothesis.
In the particular case of an R = 1 × 10⁻⁸ m silicon AFM probe interacting with a PDMS film of thickness E ≈ R deposited over a silicon wafer, the film characteristic length λF ≈ 2.2 × 101R is much smaller than the corresponding capillary length λC≈ 1.8 × 10⁵R.
4. CHARACTERISTIC FILM THICKNESSES
The characteristic radial length scales are now used to highlight the existence of two characteristic film thicknesses. When the capillary length λC and the film characteristic length λF are of the same order of magnitude, film thickness effects are expected to be observed. The first critical film thickness Egis obtained from λF*≈ λC* π ρ ≃ Δ * ≃ ⎛ ⎝ ⎜ ⎞ ⎠ ⎟ ⎛ ⎝ ⎜ ⎞ ⎠ ⎟ E H g E AH B 2 , 3 8 g ls 1/4 g a o 1/4 (14)
Egis a constant of the system, independent of the probe radius R, and Eg*= Eg/R depends on dimensionless parameters A, Ha, and Bo. The value of this critical thickness in common AFM setups is Eg∈ [10−7, 10−6] m, corresponding to Eg* ∈ [100, 103].
When the film characteristic length λFis on the order of the probe radius, the probe/liquid attraction is opposed only by the liquid/substrate attraction. Hence, from λF* ≈ 1, we find a second critical film thickness Eγthat is given by
πγ ≃ * ≃ γ γ ⎜ ⎟ ⎛ ⎝ ⎜ ⎞ ⎠ ⎟ ⎛ ⎝ ⎞ ⎠ E R H E AH 2 , 3 8 2 ls 1/4 a 1/4 (15)
Eγis a function of the probe radius, scaling as R1/2, and Eγ*= Eγ/ R changes with the product of Haand A. Within common AFM setups, this critical thickness is on the order of Eγ∈ [10−10, 10−8] m, corresponding to E
γ
*∈ [10−2, 100].
We expect to observe different behaviors depending on the film thickness, relative to the aforementioned critical values. They might be useful for marking the boundaries of the arising
regimes in which the involved mechanisms alternate their contributions.
In Figure 7, the terms in eq 5 are shown as function of the film thickness E* under the jump-to-contact condition. The
presented curves correspond to our reference case for which A = 1, Ha = 5.48 × 10⁻³, and Bo= 3.07 × 10⁻¹¹. In addition, hydrostatic term Boη*is not shown because its magnitude is very small compared to that of the other terms.
As can be seen on the right-hand side of Figure 7, where E* > Eg*, the curvature and the probe/liquid interaction terms are nearly constant. The presence of the substrate can be disregarded because the liquid/substrate interaction term in eq 5 is negligible. Consequently, the deformation of the liquid surface results from the equilibrium between the surface tension and the probe/liquid interaction, and in dimensionless terms, it is determined only by the values of Ha and Bo, as described in previous studies.14 Moreover, the minimum separation distance Dmin* and the maximum apex position η0,max* do not vary with the film relative thickness E*, as depicted in Figure 5. The surface deformation spreads to the effective capillary length, which is essentially given by the usual capillary length λCF* ≈ λC*, because in this case λF* ≫ λC*. We shall name this regime the asymptotic “thick-film” behavior.
For a film with an intermediate thickness Eγ* < E* < Eg*, though the liquid/substrate term continues to be negligible, the curvature term and the probe/liquid interaction are not constant anymore. These two terms increase slowly and simultaneously, remaining in balance, when reducing the film relative thickness E*, as can be discerned from Figure 7. In this case, the deformed surface shape stretches out to the effective capillary length λCF*, which takes values between the capillary length λC*and the film characteristic length λF*. This constraint forces the surface to recover from its deformation, getting back to a flat profile at a radial distance shorter than the capillary length. The resulting restrained interface shape shows a curvature that is greater than that of the deformed bulk. Hence, the surface position results from the interplay of the three involved physical mechanisms: surface tension and probe/liquid interaction forces act directly, whereas liquid/ substrate interaction force appears by means of an implicit modification of the curvature.
On the left-hand side of Figure 7, where E* < Eγ*, the curvature term seems to reach a saturated state. Meanwhile, the probe/liquid and the liquid/substrate attraction terms increase
Figure 7.Absolute value of the different terms Yjfrom eq 5 for which
∑ Yj= 0 as functions of E* at D* = Dmin* and for A = 1, Ha= 5.48 ×
10−3, and B
o= 3.07 × 10⁻¹¹. The hydrostatic term Boη*, which is not
represented herein, remains on the order of 10−11. The critical film
monotonically, approaching each other in magnitude as E* decreases from Eγ*toward smaller values. Hence, the effect of the proximity of the substrate dominates over that of the surface tension, and the position of the film free surface is retrieved from the equilibrium of the probe/liquid and the liquid/substrate attractive interactions. Dmin* and η0,max* change significantly with the film relative thickness E*, as shown in Figure 5. A direct effect of the substrate attraction is observed on the radial span of the surface deformation λCF*. In this case, λF*≪ λC*; therefore, the effective capillary length is mainly given by the film characteristic length λCF* ≈ λF*. Hence, the deformation profiles are sharp, and they are restrained to a very narrow zone around r* = 0. We name this regime the asymptotic “shallow-film” behavior, where the localized tip effect is observed.
5. FILM THICKNESS ASYMPTOTIC BEHAVIORS
5.1. Thick Film.Considering the limit of a thick film E* > Eg*, the surface deformation is controlled by the capillary force and the probe/liquid interaction. The force due to the surface deformation can be taken as
πγ η
≈ *
γ
F R 0 (16)
Also, the force mutually exerted between the probe and the liquid surface can also be approximated by the force between a sphere and a flat surface:17
ε ≈ * F H R 6 ( ) pl pl 0 2 (17)
Therefore, when the equilibrium between these two forces is attained, the surface deformation is described by
η ε * ≈ * H 8( ) 0 a 0 2 (18)
In the limit E* → ∞, with the dominant term in eq 8 being the one containing the curvature, the function f(η0*, κ0*) is given by
η* κ* ≃ κ* f
H (0, 0) 2 0
a (19)
which, combined with the first-order approximation of eq 10, results in an expression for ε0*in terms of κ0*. Taking this within eq 18, one obtains the power law relation of the curvature in terms of the apex deformation
κ ≃ πγ ⎜⎛η ⎟ κ* ≃ η* ⎝ ⎞ ⎠ C H R C H 3 2 , 2 ( ) pl 0 0 3/2 0 a 0 3/2 (20)
which is in agreement with that observed in Figure 4 for large values of E* and has been previously found for the bulk.12,13 For this case, where Ha= 5.48 × 10⁻³and Bo= 3.07 × 10⁻¹¹, coefficient C takes a value of 6.37 × 10⁻². The employment of eqs 19 and 20 in eqs 11 and 7 allows us to forecast the asymptotic bulk behavior shown in Figure 5.
5.2. Shallow Film. We now focus on the particular evolution observed in Figure 4 for shallow films, E* < Eγ*, and small deformations. Consequently, according to the relative contributions shown in Figure 7, the first-order surface deformation results from the balance between the probe/liquid and the liquid/substrate interactions. The force due to the liquid/substrate interaction can be taken as
η ≈ * * F H R E( ) ls ls 04 (21)
Equilibrium between this expression and the probe/liquid interaction force, given by eq 17, yields
η ε * ≈ * ∗ E A ( ) 6 ( ) 0 4 0 2 (22)
Now, the dominant term in eq 8 comes from the liquid/ substrate interaction, and the function f(η0*, κ0*) for η0*/E* → 0 is given by η κ η λ * * ≃ * * f H ( , ) ( ) 0 0 0 a F 2 (23)
The asymptotic shallow film behavior is obtained when combining eq 23 with eqs 11 and 7, which is a good approximation of the numerical results displayed in Figure 5. From the first-order approximation of eq 10, we find an expression for ε0*in terms of η0*, which when substituted into eq 22 gives η* ≈ ∗ E A ( ) 24 0 4 (24)
Moreover, from the balance between the two interaction terms in eq 5
−1AHΠ* =HΠ*
8 a ls a pl (25)
the free surface shape of the thin film is given by η* D* −η* + * −r = E* A [( ) 1] 8( ) 3 2 2 3 4 (26)
from which, at r* = 0 and considering D* ≫ η0*, we obtain η* ≃ − ∗ ∗ E A D 8( ) 3 ( 1) 0 4 2 3 (27)
Differentiating eq 26 and evaluating at r* = 0 gives κ * ≃ − ∗ ∗ E A D 16( ) ( 1) 0 4 2 4 (28)
Finally, by combining the last two relations in order to eliminate D*, we find that κ ≃ η κ* ≃ η * * ⎜ ⎟ ⎜ ⎟ ⎛ ⎝ ⎞ ⎠ ⎛ ⎝ ⎞ ⎠ ⎛ ⎝ ⎜⎜ ⎞ ⎠ ⎟⎟ H H 3E R A E 1 , 3 0 ls pl 0 4/3 0 0 4/3 3 3 (29)
which is in agreement with the trend observed in Figure 4 for shallow films and small deformations. Within this regime, the minimum separation distance Dmin* and the maximum apex position η0,max* are significantly modified by the film relative thickness E*, in contrast to the thick-film case. Note also that the deformation is dependent on the Hamaker constant ratio, A, but not on the modified Hamaker and Bond numbers.
6. PROBE SIZE EFFECT
With the purpose of determining the experimental parameters for AFM measurements, the probe size and the film thickness effects are quantitatively studied. Therefore, the dimensional jump-to-contact threshold is analyzed, considering the constant physical properties of the system. The combined effect of Ha
and E* on the deformation for a given value of Hls = Hpl is equivalent to studying the effects of R and E on the free surface displacement. The dimensionless representation depicted in Figure 5a corresponds to the evolution of η0,max* in terms of E* for a single value Ha = 5.48 × 10⁻³. As a consequence, it is possible to reconstruct the dimensional dependency of the maximum apex displacement η0,maxon the film thickness E, but only for R = R3= 10−8m with parameters γ = 3.1 × 10⁻²N/m and Hpl = 4 × 10⁻²⁰ J. Additionally, considering the same physical parameters, we solved eq 5 numerically for different values of E and for R2= 10−6m and R1= 10−4m. In Figure 8,
the maximum apex displacement η0,max is displayed as a function of the film thickness E for the three probe radii. One notes that the evolution of η0,max(E) follows similar tendencies: for E < Eγ, η0,maxincreases linearly with E; for Eγ< E < Eg, η0,max grows monotonically as E increases with a slowly declining slope; and finally for E > Eg, η0,maxreaches a plateau.
Figure 8 points out that for a shallow film E < Eγ the maximum apex displacement η0,maxis independent of the probe radius R. A linear dependency of the displacement on the thickness, η0,max = α0E with α0 ≃ 0.33, is found. Because Eγ grows as R1/2, the linear regime is extended to a larger range of E. Furthermore, the value of η0,maxat the plateau, characteristic of bulk behavior E > Eg, increases with the value of R. As depicted in eq 14, Eg is constant for a given set of physical parameters, whatever the value of R. In Figure 8, the free surface displacement of a bulk liquid due to its interaction with a probe of millimetric size, R0 = 10−3 m ≈ λC, is also represented. In the theoretical case in which R = λC, the two critical film thicknesses collapse into a single value, Eg= Eγ. As a
consequence, the value of η0,max obtained with R = R0 in the bulk regime corresponds to the maximum displacement that the liquid surface can attain by increasing the probe radius, even for R > λC. Hence, for probes of larger radius, the system can be modeled as a film interacting with a flat, solid surface for which the maximum apex displacement is approximately the same as for R ≈ λCand completely independent of R. Table 1 reports the characteristic parameters computed for the different values of R.
The combined analysis of Figures 6 and 8 shows that the localized tip effect is observed only for shallow films for which E < Eγ. As a consequence, when R increases, the localized tip effect is observed at larger thicknesses as a result of the relation between Eγand R. Within this regime, the linear dependency of η0,maxon E can be understood by considering that the confined liquid behaves as a linearly elastic solid. This is in agreement with the linear relationship observed between the displacement and the thickness of confined materials undergoing a constant force test.23 In conclusion, the localized tip effect is characterized by a constant deformation η0,max/E = α0. In the particular case of A = 1, the value α0≈ 0.33 is found.
A film with a very small thickness compared to the size of the probe (R ≫ E) corresponds to E < Eγ, so the surface deformation at the jump-to-contact results from the balance between the probe/liquid and the liquid/substrate interactions. Considering the geometric decomposition, Dmin= R + η0,max+ ε0,min, we can deduce from Figure 5 that the surface displacement and the gap are comparable in magnitude, η0,max ≈ ε0,max. Thus, taking into account the dependency η0,max= α0E, we find that the gap is much smaller than the probe radius, ε0,min ≪ R. Therefore, eq 1 can be condensed to
π ε Π ≃ H 6 ( ) pl pl 0,min 3 (30)
In addition, eq 2 is also reduced to α π Π ≃ H E 6 ( ) ls 1 ls3 (31)
where α1 = 1 − (1 + α0)−3. The balance between these two simplified potentials gives
ε ≃[αA]− E
0,min 1 1/3 (32)
Using this result, a linear evolution of the gap between the probe surface and the originally flat surface is yielded:
α α
− ≃ + −
Dmin R { 0 [ 1A]1/3}E (33) In Figure 9, Dmin− R is shown as a function of E for different values of R. Dmin− R behaves essentially the same way as η0,max, shown in Figure 8. The only difference is that the magnitude of Dmin− R is slightly superior to that of η0,max, for the same value
Figure 8.Maximum apex displacement η0,maxas a function of the film
thickness E for Hls= Hpl= 4 × 10⁻²⁰J and different values of the probe
radius R (R1= 10−4m, R2= 10−6m, and R3= 10−8m). The values of
Eγ, corresponding to the different values of R, are summarized in Table
1, as is the value of Eg. The horizontal line (---) is the solution of eq 11,
considering the thick-film approximation given by eqs 19 and 20 for R0
≳ λC≈ 10−3m.
Table 1. Values of the Dimensionless Parameters, the Characteristic Film Thicknesses, and the Bulk Apex Displacement for the Different Probe Radii and for the Given Physical Propertiesa
R [m] R0≈ λC(10−3) R1(10−4) R2(10−6) R3(10−8) Ha [1] 5.48 × 10⁻¹³ 5.48 × 10⁻¹¹ 5.48 × 10⁻⁷ 5.48 × 10⁻³ Bo [1] 3.07 × 101 3.07 × 10³ 3.07 × 10⁷ 3.07 × 10¹¹ Eg [m] 9.05 × 10⁻⁷ EγR [m] 6.73 × 10⁻⁷ 2.13 × 10⁻⁷ 2.13 × 10⁻⁸ 2.13 × 10⁻⁹ η0,max(bulk) [m] 2.83 × 10⁻⁸ 1.72 × 10⁻⁸ 4.31 × 10⁻⁹ 9.18 × 10⁻¹⁰ aγ= 3.1 × 10⁻²N/m, Δρ = 9.7 × 10²kg/m3, and H pl= Hls= 4 × 10⁻²⁰J.
of E. The linear dependency described by eq 33 is verified in Figure 9 for small values of E.
The value of gap Dmin − R should be respected when performing AFM measurements because it indicates the experimental set point needed to avoid the jump to contact and the wetting of the probe. For example, colloidal AFM probes, with a radius of R = R2= 10−6m, must be used at a distance of Dmin − R ≳ 10−8 m when scanning, whereas for common AFM probes with R = R3 = 10−8 m, we should use Dmin− R ≳ 10−9m, which is 1 order of magnitude closer to the interface.
7. CONCLUSIONS
We have studied the interaction between an AFM probe and a liquid film deposited over a flat substrate. The competition between probe/liquid and liquid/substrate attraction deter-mines the equilibrium position of the liquid surface. The radial extent of the deformation reaches the effective capillary length λCF, which takes values between the capillary length λCand the film characteristic length λ
F. When the deformation extends up to λCF ≈ λC, gravity is responsible for the flattening of the surface. However, when λCF ≈ λF, the liquid/substrate attraction is the mechanism that restrains the deformation.
From these two characteristic length scales, the existence of two characteristic film thicknesses, Eγand Eg, is pointed out. Eγ depends on the liquid/substrate interaction constant and the liquid surface tension, also scaling as R1/2. In contrast, E
g is independent of the probe radius R, taking a constant value for a given set of physical properties of the system.
For shallow films (i.e., E < Eγ), the maximum apex displacement varies linearly with the film thickness η0,max = α0(A)E and is independent of R. In addition, a localized tip effect is revealed, which is characterized by a deformation of localized radial extent λCF≈ λFand small amplitude. For thick films (i.e., E > Eg), no tip effect is observed, and η0,maxtakes a fixed value independent of the film thickness E but given by the probe radius R.
From a practical point of view with the aim of performing AFM experiments, Eγ emerges as the relevant characteristic thickness, which can be used to separate two regimes: a linear regime for E < Eγwhere η0,maxand Dminare controlled by film thickness E and a plateau regime for E > Eγwhere η0,maxand Dminare mainly determined by probe radius R.
Corresponding Author
*E-mail: [email protected]; philippe.tordjeman@ imft.fr. Phone: +(33)0534322858. Fax: +(33)0534322991. Notes
The authors declare no competing financial interest.
(1) Bhushan, B., Ed. Springer Handbook of Nanotechnology; Springer: New York, 2004.
(2) Bocquet, L.; Charlaix, E. Nanofluidics: from bulk to interfaces.
Chem. Soc. Rev. 2010, 39, 1073−1095.
(3) Li, T.-D.; Riedo, E. Nonlinear viscoelastic dynamics of nanoconfined wetting liquids. Phys. Rev. Lett. 2008, 100, 106102.
(4) Riedel, C.; Sweeney, R.; Israeloff, N.; Arinero, R.; Schwartz, G.; A., A.; Tordjeman, P.; Colmenero, J. Imagining dielectric relaxation in nanostructured polymers by frequency modulation electrostatic force microscopy. Appl. Phys. Lett. 2010, 96, 213110.
(5) Maali, A.; Bhushan, B. Measurement of slip length on superhydrophobic surfaces. Philos. Trans. R. Soc. A 2012, 39, 2304− 2320.
(6) Kim, J.; Jang, J.; Zin, W. Estimation of the thickness dependence of the glass transition temperature in various thin polymer films.
Langmuir 2000, 16, 4064−4067.
(7) Grohens, Y.; Hamon, L.; Reiter, G.; Soldera, A.; Holl, Y. Some relevant parameters affecting the glass transition of supported ultra-thin polymer films. Eur. Phys. J. E 2002, 8, 217−224.
(8) Butt, H. J.; Cappella, B.; Kappl, M. Force measurements with the atomic force microscope: technique, interpretation and applications.
Surf. Sci. Rep. 2005, 59, 1−152.
(9) Yaccot, A.; Koenders, L. Aspects of scanning force microscope probes and their effects on dimensional measurements. J. Phys. D:
Appl. Phys. 2008, 41, 103001.
(10) Ondarcuhu, T.; Aime, J.-P. Nanoscale Liquid Interfaces: Wetting,
Patterning and Force Microscopy at the Molecular Scale; Pan Stanford
Publishing: Singapore, 2013.
(11) Christenson, H. Capillary condensation due to van der Waals attraction in wet slits. Phys. Rev. Lett. 1994, 73, 1821−1824.
(12) Quinn, D.; Feng, J.; Stone, H. Analytical model for the deformation of a fluid-fluid interface beneath an AFM probe. Langmuir 2013, 29, 1427−1434.
(13) Ledesma-Alonso, R.; Legendre, D.; Tordjeman, P. Nanoscale deformation of a liquid surface. Phys. Rev. Lett. 2012, 108, 106104.
(14) Ledesma-Alonso, R.; Tordjeman, P.; Legendre, D. Multiscale deformation of a liquid surface in interaction with a nanoprobe. Phys.
Rev. E 2012, 85, 061602.
(15) Hamaker, H. C. The London-Van der Waals attraction between spherical particles. Physica 1937, 4, 1058−1072.
(16) de Gennes, P.-G.; Brochard-Wyart, F.; Quere, D. Capillarity and
Wetting Phenomena: Drops, Bubbles, Pearls, Waves; Springer: New York,
2004.
(17) Israelachvili, J. N. Intermolecular and Surface Forces, 3rd ed.; Academic Press: Burlington, MA, 2011.
(18) Bergstrom, L. Hamaker constants of inorganic materials. Adv.
Colloid Interface Sci. 1997, 70, 125−169.
(19) Visser, J. On Hamaker constants: a comparison between Hamaker constants and Lifshitz-van der Waals constants. Adv. Colloid
Interface Sci. 1972, 3, 331−363.
(20) Mougin, K.; H., H. Wetting of liquid films at nanoscale heterogeneous surfaces. Europhys. Lett. 2003, 61, 660−666.
(21) Cortat, F. P.; Miklavcic, S. J. How closely can a solid approach an air-water surface without becoming wet? Phys. Rev. E 2003, 68, 052601.
(22) Wang, Y. Z.; Wang, B.; Xiong, X.; Zhang, J. Spherical solid model system: exact evaluation of the van der Waals interaction between a microscopic or submacroscopic spherical solid and a deformable fluid interface. Surf. Sci. 2011, 605, 528−538.
Figure 9.Dmin− R as a function of the film thickness E for Hls= Hpl=
4 × 10⁻²⁰J and different values of the probe radius R (R
1= 10−4m, R2
= 10−6m, and R
3= 10−8m). The values of Eγcorresponding to the
different values of R are summarized in Table 1, as well as the value of
Eg. The horizontal line (---) is the solution of eq 7 for Dmin− R,
considering the thick-film approximation already described in Figure 8 for R0≳ λC≈ 10−3m.
(23) Tordjeman, P.; Papon, E.; Villenave, J. Squeeze elastic deformation and contact area of a rubber adhesive. J. Chem. Phys. 2000, 113, 712−716.