Publisher’s version / Version de l'éditeur:
Vous avez des questions? Nous pouvons vous aider. Pour communiquer directement avec un auteur, consultez la
première page de la revue dans laquelle son article a été publié afin de trouver ses coordonnées. Si vous n’arrivez pas à les repérer, communiquez avec nous à [email protected].
Questions? Contact the NRC Publications Archive team at
[email protected]. If you wish to email the authors directly, please see the first page of the publication for their contact information.
https://publications-cnrc.canada.ca/fra/droits
L’accès à ce site Web et l’utilisation de son contenu sont assujettis aux conditions présentées dans le site LISEZ CES CONDITIONS ATTENTIVEMENT AVANT D’UTILISER CE SITE WEB.
Research Report (National Research Council of Canada. Institute for Research in Construction), 2002-06-01
READ THESE TERMS AND CONDITIONS CAREFULLY BEFORE USING THIS WEBSITE.
https://nrc-publications.canada.ca/eng/copyright
NRC Publications Archive Record / Notice des Archives des publications du CNRC :
https://nrc-publications.canada.ca/eng/view/object/?id=3b26ac27-7fd3-430c-8ad3-2559d2b9f243 https://publications-cnrc.canada.ca/fra/voir/objet/?id=3b26ac27-7fd3-430c-8ad3-2559d2b9f243
NRC Publications Archive
Archives des publications du CNRC
For the publisher’s version, please access the DOI link below./ Pour consulter la version de l’éditeur, utilisez le lien DOI ci-dessous.
https://doi.org/10.4224/20378589
Access and use of this website and the material on it are subject to the Terms and Conditions set forth at
Construction and Rehabilitation Costs for Buried Pipe with a Focus on Trenchless Technologies
Construction and Rehabilitation Costs for Buried Pipe with a Focus on Trenchless Technologies
Zhao, J.Q.; Rajani, B.
IRC-RR-101
June 2002
Construction and
Rehabilitation Costs for
Buried Pipe with a Focus on
Trenchless Technologies
Research Report No. 101
Date of Issue: June 2002
Authors: Jack Q. Zhao; Balvant Rajani
Published by
Institute for Research in Construction National Research Council Canada Ottawa, Canada
Abstract
Over the past a few years, there were numerous inquiries from municipal engineers on the costs of rehabilitation or construction of buried pipes using trenchless technologies, This report was prepared to provide this cost information. The cost data of trenchless rehabilitation and construction projects from various sources were collected, compiled and presented. The data indicate that, in general, costs of the trenchless methods increase with the increase in pipe size. Costs of emergency repairs are more than 3 times the normal repair average. Costs of some maintenance activities are included, as well as costs of the available internal inspection and evaluation methods. Furthermore, cost ranges for access hole rehabilitation, replacement and new construction are summarized.
Table of Contents
1. Introduction...1
2. Understanding Cost Data Presented...1
3. Costs Of Trenchless Techniques ...2
3.1 Comparison to open cut method ...5
4. Rehabilitation Of Large Masonry Sewers ...8
5. Maintenance Of Water Pipe...9
6. Cost Of Failure Repair Or Replacement ...9
7. Cost Of Sewer Inspection Methods ...10
8. Rehabilitation Of Access Holes ...11
9. Summary...12
References...13
Appendix A: Collection Of Raw Cost Data ...16
List of Tables
Table 1. Average cost of trenchless techniques with more than five data records 3 Table 2. Cost of rehabilitation or maintenance techniques based on up to three data records 7 Table 3. Cost of miscellaneous sewer rehabilitation and repairs 8 Table 4. Cost of rehabilitation for large masonry sewers 8
Table 5. Cost of maintenance for water pipe 9
Table 6. Cost of urgent repair of sewer pipe using trenchless technology 10 Table 7. Cost of pipe internal inspection/evaluation 11 Table 8. Cost of rehabilitation or construction of access hole 12
List of Figures
Figure 1. Average cost of trenchless methods for four diameter ranges (including Open Cut) 4 Figure 2. Increase of CIPP rehabilitation with pipe diameter 5
1.
Introduction
In recent years, trenchless technologies have been used for construction and rehabilitation of buried utilities such as gas pipelines, water distribution systems, sewer collection systems and drainage culverts. Under the general umbrella of trenchless technologies, there are a wide range of no-dig (or less dig) techniques, including Cured-In-Place Pipe (CIPP), Microtunneling, Tunneling, Horizontal Directional Drilling (HDD), Sliplining, Fold-and-Reformed pipe, Pipe Jacking, Pipe Bursting, Spot Repair, Spiral Wound, and Shotcrete (ISTT/WRc 1996). Engineers need to keep abreast not only of the existing and emerging trenchless technologies, but also of their associated costs in order to make appropriate decisions on rehabilitation priorities, budgeting and scheduling. The total cost of a construction project includes not only the direct costs but also social costs (McKim 1998; Noor and Miranda 2000; Harbuck 2000). Accurate estimations of these costs are key to selecting the most appropriate construction method and to carrying out effective life cycle costing analysis. For existing pipe systems, condition assessment and rehabilitation of buried infrastructure systems are an on-going process for maintaining a desired level of service. Thorough understanding and appreciation of existing conditions is important, as well, in the decision-making process.
This report presents cost data for some trenchless technologies for water and sewer pipe, based on reported contract costs and case histories in Canada and in the United States. In addition, costs of some condition assessment techniques are included. For comparison purposes, cost data for the traditional open excavation and replace (Open Cut) method is also discussed. Unfortunately, details of costs or separation of direct and social costs are rarely given in the reported contract costs as these social costs are very hard to identify and even harder to quantify (McKim 1998).
The data presented in this report will help engineering practitioners make better cost estimates for their future projects and help researchers develop cost models for estimating the total costs of different trenchless constructions. These data will also be useful in developing reliability-based models for optimal scheduling of condition assessment and rehabilitation of buried pipe.
2.
Understanding Cost Data Presented
Cost data were collected and compiled from various sources. While every effort was made to ensure the accuracy of the reported cost data, the reader is advised of the following when reading the cost information presented in this report:
• Each project is unique and actual cost depends on many factors, which were not consistently reported in the cited references.
• The cost data presented are total contract costs, it is not certain if the social costs were included. • Raw cost data from published references in different years are included as such in Appendix A. In
the cost analysis, inflation was taken into account by published Building Cost Index (ENR 2002) (Appendix B).
• Except in Appendix A, all cost values are expressed in Canadian dollars. The conversion rate used in this report is $1 US = $1.48 CDN (the average rate for year 2001).
3.
Costs of Trenchless Techniques
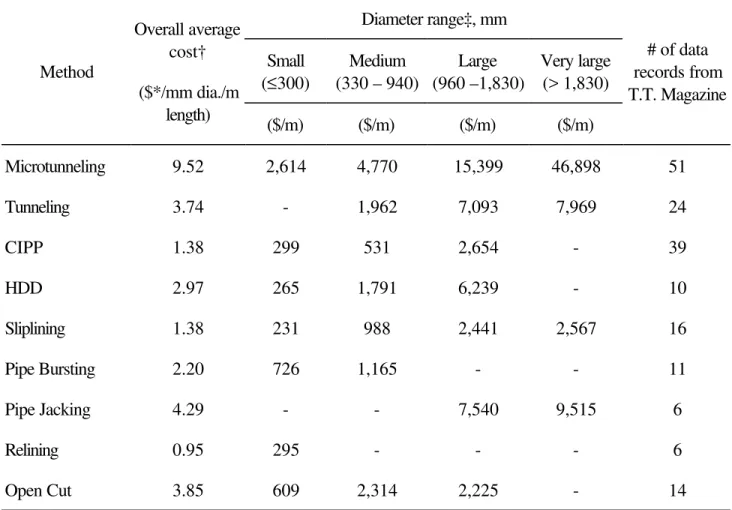
A total of 174 data records were compiled from the “Jobs Let” Section of the Trenchless Technology Magazine (T.T. Magazine) from 1993 onwards (see Appendix). Some of the reported total project costs included the construction cost of a small quantity of access holes (manholes), which could not be separated. Based on at least five data records, costs of eight trenchless techniques are shown in Table 1, together with the Open Cut method. These costs are expressed in dollar per millimeter in diameter per linear meter, and also in dollars per linear meter for four diameter ranges. The last column contains the number of data records for each method.
In terms of overall average cost, the most costly method is Microtunneling at $9.52/mm/m, followed by Pipe Jacking at $4.29/mm/m. These two methods are also more expensive than the Open Cut method ($3.85/mm/m). The least costly is Relining at $0.95/mm/m. Table 1 also shows that for pipes of diameter larger than 960 mm, none of the applicable trenchless methods appears to be more economical then the Open Cut method. This observation indicates that the reported contract costs were direct costs because direct costs of trenchless technologies are in the same range as direct costs of the Open Cut method (McKim 1998).
The actual cost of the Ottawa project served as a check on the compiled cost data from the Trenchless Technology Magazine. In 1999, the City of Ottawa (formerly the Region of Ottawa-Carleton) sliplined one of its 915 mm diameter watermain in the downtown area. The final contract cost was $1,453,630 (year 2001 value=$1,503,262) for a 1,500 m length (Willmets 2000). The unit cost was $1.11/mm/m, which is lower than the average of $1.38 /mm/m for Sliplining. If the cost is expressed in dollar per meter length only, the Ottawa sliplined project was completed at $1,003/m, within 2% of the average cost of $988/m for the second diameter group.
Table 1. Average cost of trenchless techniques with more than five data records Diameter range‡, mm Small (≤300) Medium (330 – 940) Large (960 –1,830) Very large (> 1,830) Method Overall average cost† ($*/mm dia./m length) ($/m) ($/m) ($/m) ($/m) # of data records from T.T. Magazine Microtunneling 9.52 2,614 4,770 15,399 46,898 51 Tunneling 3.74 - 1,962 7,093 7,969 24 CIPP 1.38 299 531 2,654 - 39 HDD 2.97 265 1,791 6,239 - 10 Sliplining 1.38 231 988 2,441 2,567 16 Pipe Bursting 2.20 726 1,165 - - 11 Pipe Jacking 4.29 - - 7,540 9,515 6 Relining 0.95 295 - - - 6 Open Cut 3.85 609 2,314 2,225 - 14
† - For the reported projects that contained more than one diameter, the average diameter was used for determining the overall average cost.
‡ - The data records that could not be separated for the diameter ranges were not used in these diameter ranges, but used in the overall average.
* - All costs are expressed as the 2001 value and in $ CDN. $US 1 = $1.48 CDN.
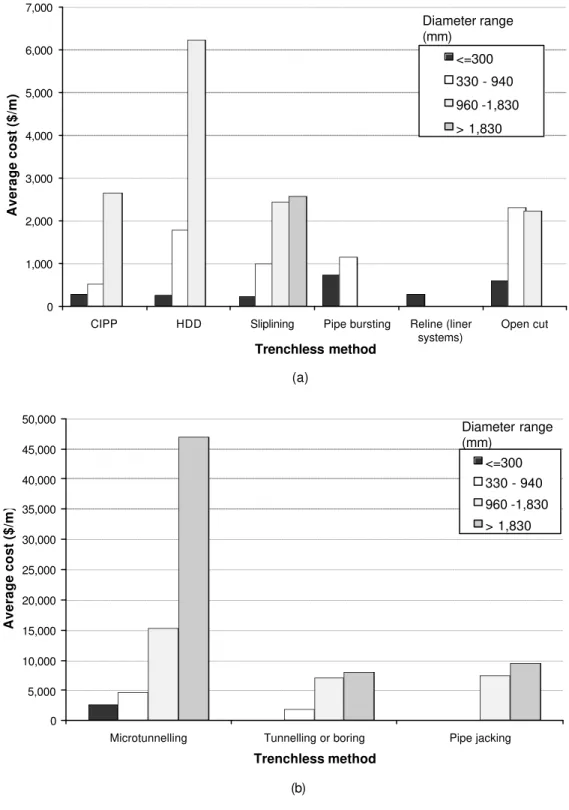
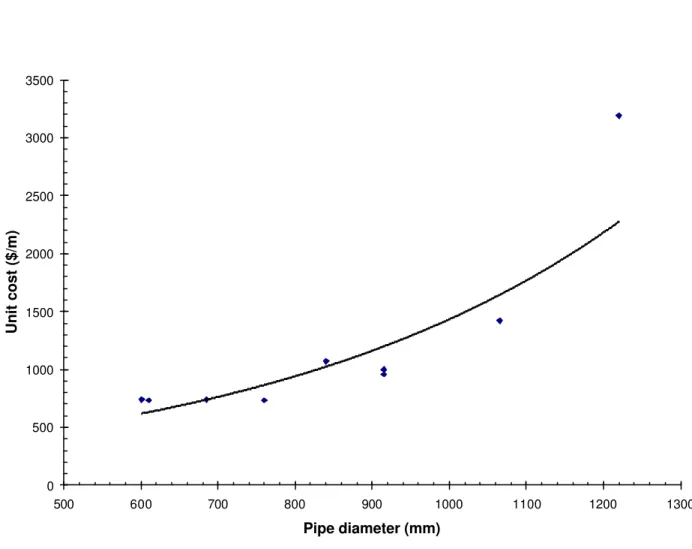
Costs of all trenchless rehabilitation/construction methods increase with the increase in pipe diameter (Figure 1). The increase in cost with size is due to the increased level of complexity and difficulty of carrying out the rehabilitation work. To demonstrate the range of costs in one location, the cost-diameter relationship for the CIPP projects in Phoenix (Brown and Caldwell 1999) is shown in Figure 2.
Figure 1. Average cost of trenchless methods for four diameter ranges (including Open Cut) a) 0 1,000 2,000 3,000 4,000 5,000 6,000 7,000
CIPP HDD Sliplining Pipe bursting Reline (liner
systems) Open cut Trenchless method Average cost ($/m) <=300 330 - 940 960 -1,830 > 1,830 Diameter range (mm) (a) 0 5,000 10,000 15,000 20,000 25,000 30,000 35,000 40,000 45,000 50,000
Microtunnelling Tunnelling or boring Pipe jacking
Trenchless method Average cost ($/m) <=300 330 - 940 960 -1,830 > 1,830 Diameter range (mm) (b)
Figure 2. Increase of CIPP rehabilitation with pipe diameter
3.1 Comparison to open cut method
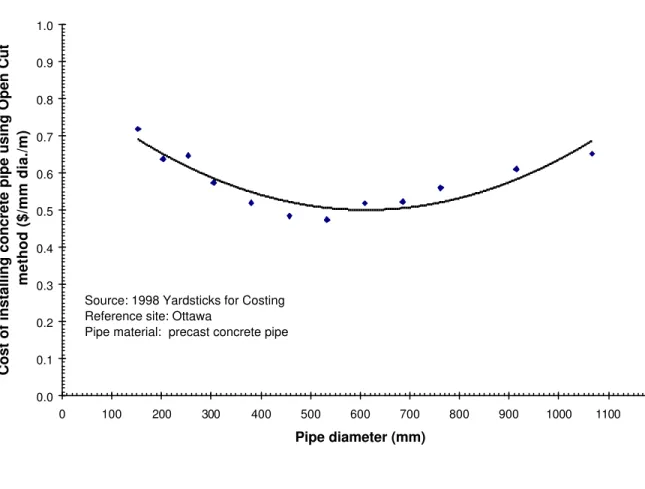
For the Open Cut method, the average of the reported costs for the 960 – 1,830 mm diameter range seems to be less than that for the 330 – 940 mm diameter range (Table 1). The data for the Open Cut method given in the 1998 Yardsticks for Costing (CMD/Canada 1998) suggest a second degree polynomial relationship between the cost and pipe diameter for the 152 – 1,065 mm diameter range (Figure 3). The lowest cost occurs when the pipe diameter is around 600 mm. Although the location was chosen to be Ottawa, similar cost diameter relationships exist for other locations as well.
Comparing the overall average cost for Open Cut in Table 1 with Figure 3, one concludes that the cost estimate data in the Yardsticks for Costing are much lower than the reported costs.
0 500 1000 1500 2000 2500 3000 3500 500 600 700 800 900 1000 1100 1200 1300 Pipe diameter (mm) Unit cost ($/m)
Figure 3. Cost curve for Open Cut method
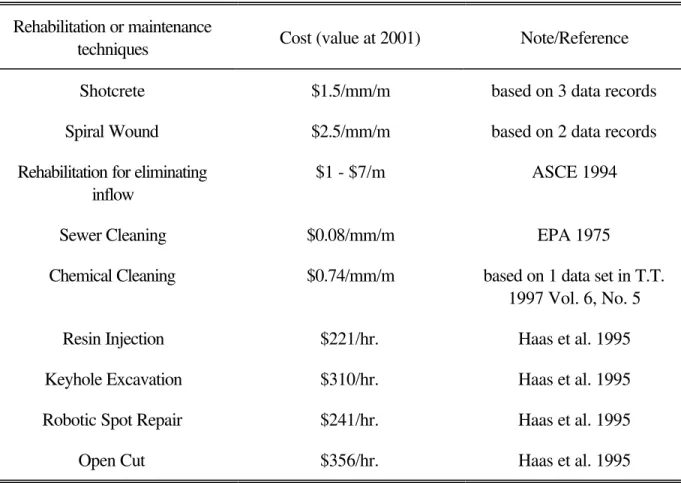
Table 2 lists the costs of the trenchless techniques based on a single source or up to three data records from the Trenchless Technology Magazine. Although these data cannot be considered representative, they may provide a starting point for making rough cost estimates. The costs in the last four rows are expressed in dollars per hour as reported by Haas et al. (1995). The cost for Open Cut is also included for comparison.
For Spot Repair, Garibaldi (1999) gives a range of $500 to $1,000/repair and Gribbins (2001) reported that the City of Lakeland, Fla., found it cost-effective to carry out spot repairs by its own crew.
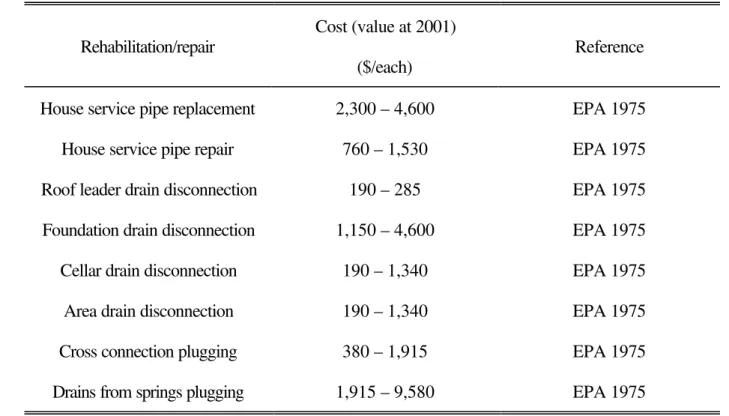
Cost ranges of miscellaneous sewer rehabilitation and repairs are shown in Table 3. Randrup et al. (2001) report that repairs to damage due to tree root intrusion were $0.16 - $9.5/tree annually based on a study of eight U.S. and Canadian cities and $2.30 per capita per year based on a Danish study. However, Randrup et al. (2001) did not give the cost per occurrence.
0.0 0.1 0.2 0.3 0.4 0.5 0.6 0.7 0.8 0.9 1.0 0 100 200 300 400 500 600 700 800 900 1000 1100 1200 Pipe diameter (mm)
Cost of installing concrete pipe using Open Cut
method ($/mm dia./m)
Source: 1998 Yardsticks for Costing Reference site: Ottawa
Table 2. Cost of rehabilitation or maintenance techniques based on up to three data records Rehabilitation or maintenance
techniques Cost (value at 2001) Note/Reference Shotcrete $1.5/mm/m based on 3 data records Spiral Wound $2.5/mm/m based on 2 data records Rehabilitation for eliminating
inflow
$1 - $7/m ASCE 1994
Sewer Cleaning $0.08/mm/m EPA 1975
Chemical Cleaning $0.74/mm/m based on 1 data set in T.T. 1997 Vol. 6, No. 5 Resin Injection $221/hr. Haas et al. 1995 Keyhole Excavation $310/hr. Haas et al. 1995 Robotic Spot Repair $241/hr. Haas et al. 1995
Table 3. Cost of miscellaneous sewer rehabilitation and repairs
Rehabilitation/repair
Cost (value at 2001) ($/each)
Reference
House service pipe replacement 2,300 – 4,600 EPA 1975 House service pipe repair 760 – 1,530 EPA 1975 Roof leader drain disconnection 190 – 285 EPA 1975 Foundation drain disconnection 1,150 – 4,600 EPA 1975 Cellar drain disconnection 190 – 1,340 EPA 1975 Area drain disconnection 190 – 1,340 EPA 1975 Cross connection plugging 380 – 1,915 EPA 1975 Drains from springs plugging 1,915 – 9,580 EPA 1975
4.
Rehabilitation of Large Masonry Sewers
Costs of trenchless techniques for the rehabilitation of large masonry sewers are listed in Table 4. The cost for masonry sewer rehabilitation using the CIPP method is much lower than that shown in Table 1.
Table 4. Cost of rehabilitation for large masonry sewers
Method
Cost (value at 2001) ($/mm dia./m length)
Reference
CIPP 0.20 Collins & Stude (1995)
Reinforced Shotcrete 0.07 Collins & Stude (1995) Sliplining with segmented plastic
pipe
5.
Maintenance of Water Pipe
The cost for thawing a frozen water service line in cold weather is about $830 per occurrence based on the City of Ottawa’s experience (Raymond et al. 1999) (Table 5). Thawing of the frozen water service lines during the winter of 1983/1984 cost the City approximately $2,000,000 (year 2001 value = $2,957,400) (Raymond et al. 1999). The cost of implementing a cathodic protection program is about 4% of the replacement cost or $22/m according to Raymond (1999).
Table 5. Cost of maintenance for water pipe
Maintenance activities Cost (value at 2001) Reference Thawing of frozen water service
line
$830/each occurrence Raymond et al. 1999
Cathodic Protection $22/m Raymond 1999
6.
Cost of Failure Repair or Replacement
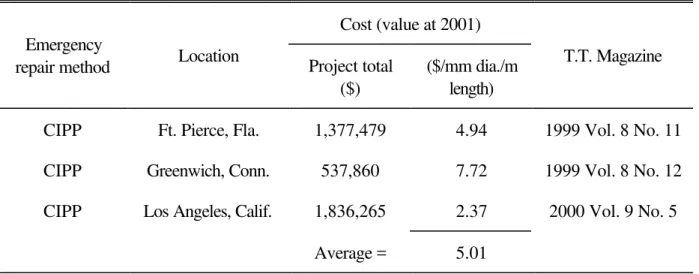
Failure of a sewer or a watermain calls for urgent, unplanned repair and the repair cost can vary drastically from case to case, depending upon many factors such as the location and extent of the failure, and the depth and size of the pipe. There were three such repairs reported in the Trenchless Technology Magazine, all using the CIPP method (Table 6). The average unit cost was $5.01/mm/m, which is 3.6 times the average unit cost of $1.38 /mm/m for CIPP non-emergency rehabilitation (Table 1).
Collins and Stude (1995) reported that the Metropolitan St. Louis Sewer District experienced one failure each year in its old brick sewers and the repair costs ranged from $483,000 to $2,400,000 each. On the other hand, the repair cost of watermain breaks in pipes of less than 200 mm diameter is about $6,200 each (Raymond 1999). For catastrophic failures of larger diameter watermains, repairs can cost millions of dollars. In such cases, social costs can also be very significant. For example, Nankivil and Nichols (1997) reported the direct cost of two water pipe failures as being $186,000 and $215,000. They stated that the ratio of social to direct costs can range from 1:1 to 4:1 depending on the location of failure.
Table 6. Cost of urgent repair of sewer pipe using trenchless technology Cost (value at 2001)
Emergency
repair method Location Project total ($)
($/mm dia./m length)
T.T. Magazine
CIPP Ft. Pierce, Fla. 1,377,479 4.94 1999 Vol. 8 No. 11 CIPP Greenwich, Conn. 537,860 7.72 1999 Vol. 8 No. 12 CIPP Los Angeles, Calif. 1,836,265 2.37 2000 Vol. 9 No. 5
Average = 5.01
Note: these cost data were excluded from the CIPP data set in Table 1.
There were three reported projects involving rehabilitation of earthquake damage – two in Santa Monica (Calif.) and one in Glendale (Calif.). One of the projects involved CIPP, Fold-and-Formed Lining, as well as Pipe Bursting of a total length of 9,205 m of 200 mm to 455 mm diameter sewer for a total cost of $2.8 million (T.T. 1995 Vol. 4, No. 11). The second project was worth $9.8 million for relining 13,715 m of 200 mm and 305 mm diameter sewers. This project included replacing (36% by Pipe Bursting) or repairing 7,620 m of 150 mm to 380 mm diameter sewers (T.T. 1999 Vol. 8, No. 9). A third project valued at $1.74 million for relining 8,077 m of 200 mm and 255 mm diameter sewers (T.T. 1999 Vol. 8, No. 9).
7.
Cost of Sewer Inspection Methods
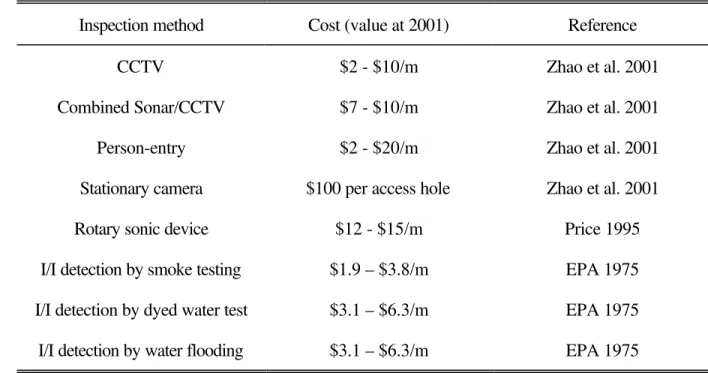
Cost ranges for some commonly used internal inspection and evaluation methods are shown in Table 7. The cost ranges given by Zhao et al. (2001) were based on the information collected from 10 Canadian municipalities and two consulting firms who participated in a one-year research project on condition assessment and rehabilitation of large sewers. EPA (1975) gives a range for internal inspection from $5.5/m to $28/m for sewers of 150 mm to 914 mm in diameter.
Table 7. Cost of pipe internal inspection/evaluation
Inspection method Cost (value at 2001) Reference
CCTV $2 - $10/m Zhao et al. 2001
Combined Sonar/CCTV $7 - $10/m Zhao et al. 2001 Person-entry $2 - $20/m Zhao et al. 2001 Stationary camera $100 per access hole Zhao et al. 2001 Rotary sonic device $12 - $15/m Price 1995 I/I detection by smoke testing $1.9 – $3.8/m EPA 1975 I/I detection by dyed water test $3.1 – $6.3/m EPA 1975 I/I detection by water flooding $3.1 – $6.3/m EPA 1975
8.
Rehabilitation of Access Holes
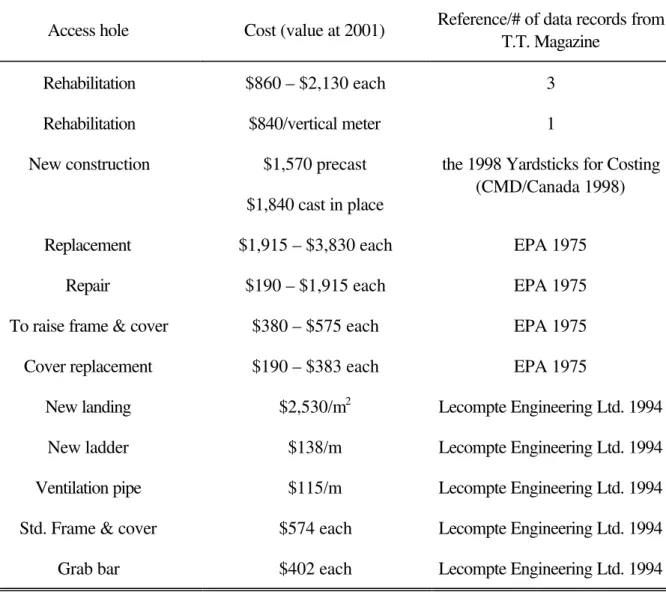
As shown in Table 8, the cost of access hole rehabilitation is in the same range as for its replacement. One project used $840 per vertical meter to determine the total project cost of access hole
rehabilitation. Using this unit cost, one can determine that the cost range of $890 to $2,230
corresponds to a depth range from 1.13 m to 2.82 m. Construction of new access holes along a new pipeline costs $1,570 each for precast and $1,840 each for cast in place.
Table 8. Cost of rehabilitation or construction of access hole
Access hole Cost (value at 2001) Reference/# of data records from T.T. Magazine
Rehabilitation $860 – $2,130 each 3 Rehabilitation $840/vertical meter 1 New construction $1,570 precast
$1,840 cast in place
the 1998 Yardsticks for Costing (CMD/Canada 1998)
Replacement $1,915 – $3,830 each EPA 1975 Repair $190 – $1,915 each EPA 1975 To raise frame & cover $380 – $575 each EPA 1975 Cover replacement $190 – $383 each EPA 1975
New landing $2,530/m2 Lecompte Engineering Ltd. 1994 New ladder $138/m Lecompte Engineering Ltd. 1994 Ventilation pipe $115/m Lecompte Engineering Ltd. 1994 Std. Frame & cover $574 each Lecompte Engineering Ltd. 1994 Grab bar $402 each Lecompte Engineering Ltd. 1994
9.
Summary
Over the past a few years, there were numerous inquiries on the costs of rehabilitation or construction of buried utilities using trenchless technologies, which indicates that there is a need for cost information for these technologies.
The cost data for trenchless rehabilitation and construction projects from various sources, but mainly from the Trenchless Technology Magazine, were collected, compiled and presented in this report. The data indicate that, in general, costs of trenchless rehabilitation or construction increase with the
Costs of some maintenance activities are included, as well as costs of the available internal inspection and evaluation methods. Furthermore, cost ranges for access hole rehabilitation, replacement and new construction are summarized.
Although the cost data may provide valuable information on cost estimation for rehabilitation and construction projects of buried pipe, it must be stressed that the actual cost of a project depends on the specific conditions and the nature of the project, and sound engineering judgement.
Details of the cost data from the Trenchless Technology Magazine are provided in the appendix for further reference.
REFERENCES
ASCE. 1994. Existing sewer evaluation and rehabilitation. ASCE Manuals and Reports on Engineering Practice No. 62. American Society of Civil Engineers.
Barsoom, J. 1995. Denver's experience in trenchless technology, Advances in Underground Pipeline Engineering, Proceedings of Second International Conference, J.K. Jeyapalan and M. Jeyapalan (eds.), American Society of Civil Engineers. pp.572-588.
Bell, R.E. Jr. and Williams, G.G. 1997. Sewer rehabilitation: developing cost-effective alternatives. Managing Engineered Construction in Expanding Global Markets, ASCE Construction Congress Proceedings, Minneapolis, MN, U.S.A. Oct. 4-8. pp. 331-337.
Brown and Caldwell. 1999. Unlined concrete sewer assessment. Draft Task Memorandum 1/2, submitted to the City of Phoenix. (with permission). Phoenix, AR, U.S.A.
CMD/Canada. 1998. Yardsticks for Costing. The R.S. Means Co., Inc., North York, ON, Canada Collins, M.A. and Stude, C.T. 1995. Rehabilitation of masonry combined sewers in the City of St.
Louis. Advances in Underground Pipeline Engineering, Proceeding of Second
International Conference, J.K. Jeyapalan and M. Jeyapalan (eds.), American Society of Civil Engineers. pp.709-720.
ENR. 2002. Engineering News Record: Building Cost Index History (1915-2002), www.enr.com/cost/costbci.asp.
EPA 1975. Handbook for Sewer System Evaluation and Rehabilitation. Environmental Protection Agency, Washington, D.C., U.S.A.
Galeziewski, T.M., Edmondson, S.A. and Webb, R. 1995. Condition assessment and rehabilitation program for large diameter sanitary sewers in Phoenix, Arizona. Advances in Underground Pipeline Engineering, Proceedings of Second International Conference, J.K. Jeyapalan and M. Jeyapalan (eds.), American Society of Civil Engineers. pp. 560-571.
Garibaldi, B. 1999. Social and environmental ramifications of trenchless technology. Conference on New Developments in Municipal Transportation and Public Works, International Plaza Hotel, Toronto, ON, Canada. Jan. 11-15.
Gribbins, K. 2001. Lakeland crews capitalize on smart repairs. Trenchless Technology, 10(4):34. Haas, C., Fowler, D., Wright, C. and Bauhan, T. 1995. Evaluation of sewer spot repair techniques.
North American No-Dig’ 95, Toronto, ON, Canada.
Harbuck, R.H. 2000. Economic evaluation of trenchless technology. 2000 AACE International Transections. 44th Annual Meeting, Association for the Advancement of Cost Engineering. Calgary, AB, Canada. pp. 12.1 – 12.7.
ISTT/WRc. 1996. Trenchless technology database. The International No-Dig Multimedia CD-ROM, Version 1.0. International Society for Trenchless Technology, London, UK.
Lecompte Engineering Ltd. 1994. Sewer Access Shaft Rehabilitation and Upgrade, Draft report, submitted to the Regional Municipality of Ottawa-Carleton, Ottawa, ON, Canada.
McKim, R.A. 1998. Bidding strategies for trenchless technologies. Cost Engineering, 40(3):37-41. Nankivil, M., and Nichols, D.J. 1997. Extending life and adding control – the rehabilitation of a 70
year old water transmission main. Proceedings of the Conference Trenchless Pipeline Projects: Practical Applications, American Society of Civil Engineers, Boston, MA, U.S.A. pp. 80-87.
Noor, I. and Miranda, G.M. 2000. Evaluating the costs of trenchless sewer repairs. 2000 AACE International Transactions. 44th Annual Meeting, Association for the Advancement of Cost Engineering. Calgary, AB, Canada. pp. 01.1 – 01.5.
Price, T. 1995. Inspecting buried plastic pipe using a rotating sonic caliper. Advances in
Underground Pipeline Engineering. J.K. Jeyapalan and M. Jeyapalan (eds.), American Society of Civil Engineers. pp.126-137.
Raymond, D. 1999. Cathodic protection program – ROC experience. NACE Seminar, The Canadian National Capital Section of NACE International, Ottawa, ON, Canada.
Raymond, D., Zhao, J.Q., Scothorn, P., Rajani, B.B. and Daigle, L. 1999. A practical measure to prevent frozen water service lines – the Regional Municipality of Ottawa-Carleton’s experience. Proceedings, the 14th Hydrotechnical Engineering Specialty Conference, Canadian Society of Civil Engineering, Regina, SK, Canada. pp. 421-430, June 2-5. Randrup, T.B, McPherson, E.G. and Costello, L.R. 2001. Tree root intrusion in sewer systems:
review of extent and costs. Journal of Infrastructure Systems,7(1):26-31.
T.T. 1995 to 2000. Trenchless Technology. Trenchless Technology, Inc., Peninsula, OH, U.S.A. Willmets, M. 2000. Private communication. Ottawa, ON, Canada.
Vanier, D.J. 2000. Advanced asset management: tools and techniques. NRCC/CPWA Seminar Series “Innovations in Urban Infrastructure”, APWA International Public Works Congress. Louisville, Kentucky, U.S.A. Sept. 10-12.
Zhao, J.Q., McDonald, S.E., and Kleiner, Y. 2001. Guidelines for Condition Assessment and Rehabilitation of Large Sewers, Technical Report NRCC-45130. Institute for Research in Construction, National Research Council Canada, Ottawa, ON, Canada.
Appendix A: Collection of Raw Cost Data
Microtunneling
Pipe Diameter Trenchless Technology Project location Project cost
($CAN)
Pipe length
(m ) (in.) (mm) Year Vol. No.
Houston, TX 1,105,188 704 12" 305 1994 3 7
Colony, NY 900,200 518 12" 305 1994 3 12
Atlanta, GA 5,180,000 1,280 12" 305 1997 6 10
Los Angeles, Calif. 1,190,000 671 12" 305 2000 9 1
Houston, TX 5,796,000 2,576 15", 30", 36" 686 1994 3 1 Houston, TX 3,983,763 2,195 18", 24" 533 1994 3 2 Houston, TX 5,558,000 2,286 20", 24" 559 1994 3 2 Kunia, Hawaii 1,820,000 762 24" 610 1994 3 3 Austin, TX 4,263,000 1,981 24" 610 1994 3 3 Hartford, Conn. 1,350,280 160 36" 914 1994 3 5 Houston, TX 2,511,257 721 36" 914 1994 3 9
Microtunneling
Pipe Diameter Trenchless Technology Project location Project cost
($CAN)
Pipe length
(m ) (in.) (mm) Year Vol. No.
Edmonton, AB 3,640,000 1,524 18", 21" 495 1995 4 5
Ames, Iowa 1,895,439 914 24" 610 1995 4 12
Vancouver, BC 1,500,000 483 32" 813 1996 5 5
Houston, TX 4,086,365 1,402 36" 914 1996 5 7
San Diego, Calif. 700,000 247 36" 914 1997 6 3
Westfield, Ind. 3,080,000 945 24" 610 1997 6 3 Houston, TX 4,275,929 1,036 30" 762 1997 6 3 Orinda, Calif. 11,340,000 2,513 36" 914 1997 6 8 Atlanta, GA 5,040,000 820 20" 508 1997 6 10 Honolulu, Hawaii 4,480,000 1,036 26" 660 1997 6 11 Martinez, Calif. 3,323,250 1,021 24" 610 1998 7 7 Milwaukee, Wisc. 2,702,000 945 30" 762 1998 7 11
Microtunneling
Pipe Diameter Trenchless Technology Project location Project cost
($CAN)
Pipe length
(m ) (in.) (mm) Year Vol. No.
Charleton, MI 420,000 91 22" 559 1999 8 11
San Francisco, Calif. 1,820,000 1,067 36" 914 1998 7 5
Houston, TX 5,530,697 1,923 12", 15" 343 2000 9 10
Santa Barbara, Calif. 6,300,000 254 50" 1,270 1995 4 7
San Jose, Calif. 18,245,122 4,288 42" 1,067 1997 6 11
Sacromento, Calif. 26,271,000 732 48" 1,219 1999 8 8
Warren, Ohio 700,000 137 42" 1,067 1999 8 9
Seattle, WA 19,304,600 827 54" 1,372 1994 3 3
Los Angeles, Calif. 7,560,000 2,393 42" 1,067 1995 4 8
Las Vegas, Nev. 4,900,000 1,771 42" 1,067 1996 5 4
Manchester, NH 4,017,538 701 42" 1,067 1997 6 9
Libertyville, ILL 7,980,000 2,802 30", 42", 48" 1,016 1997 6 10 Dayton, Ohio 5,432,000 1,311 36", 42", 48" 1,067 1998 7 6
Microtunneling
Pipe Diameter Trenchless Technology Project location Project cost
($CAN)
Pipe length
(m ) (in.) (mm) Year Vol. No.
Honolulu, Hawaii 13,518,890 3,252 48" 1,219 1999 8 11
Maple Grove, Minn. 875,546 258 42" 1,067 1999 8 12
Staten Island, NY 24,920,000 561 48" 1,219 2000 9 2
San Jose, Calif. 5,880,000 610 42" 1,067 2000 9 7
Hartford, Conn. 7,980,000 271 60" 1,524 2000 9 7
Cobb City, GA 1,372,000 1,829 57" 1,448 1994 3 11
East Hartford, Conn. 8,036,000 250 57", 60" 1,486 2000 10 4
King County, WA 7,000,000 168 87" 2,210 1997 6 11 Littleton, Colo. 4,480,000 168 36" 914 2000 9 2 Homestead, TX 1,657,778 666 12", 18" 381 1993 2 4 Houston, TX 7,488,754 2,704 12" to 48" 762 1994 3 7 Houston, TX 7,613,544 2,566 12" to 30" 533 1994 3 7 Houston, TX 4,558,291 914 8" to 54" 787 1996 5 9
Microtunneling
Pipe Diameter Trenchless Technology Project location Project cost
($CAN)
Pipe length
(m ) (in.) (mm) Year Vol. No.
Los Angeles, Calif. 11,185,409 2,545 30", 48" 991 1997 6 2
Tunneling
Pipe Diameter Trenchless Technology Project location Project cost
($CAN)
Pipe length
(m ) (in.) (mm) Year Vol. No.
Lake Zurich, ILL 759,881 620 36" 914 1996 5 4
Conemaugh, PA 644,000 209 36" 914 1997 6 7
Spruce Grove, AB 933,000 1,006 24", 30" 686 1997 6 7
Cleverland, Ohio 11,325,930 3,444 60" 1,524 1993 2 6
San Diego, Calif. 3,220,000 1,219 60" 1,524 1994 3 9
Ohio Regional Sewer District 12,292,000 2,697 72" 1,829 1995 4 8 Chicago, MI 7,280,000 2,438 48", 54", 72" 1,473 1995 4 8
Tunneling
Pipe Diameter Trenchless Technology Project location Project cost
($CAN)
Pipe length
(m ) (in.) (mm) Year Vol. No.
Ohio 8,556,642 2,697 72" 1,829 1996 5 1
Omaha, NEB 1,848,000 232 72" 1,829 1996 5 10
Birmingham, Alab. 12,040,000 2,012 48" 1,219 1996 5 11
Dallas, TX 2,488,494 98 72" 1,829 1997 6 1
Las Vegas, Nev. 4,900,000 6,096 40" 1,016 1997 6 3
Dayton, Ohio 3,220,000 671 54" 1,372 1997 6 10
Cincinnati, Wisc. 1,820,000 441 36", 42", 60", 66" 1,295 1998 7 4
San Diego, Calif. 3,500,000 347 61" 1,549 1998 7 7
Ohio Region, Cleveland 14,364,000 3,391 66" 1,676 1998 7 9
Nevada 28,326,851 6,070 144" 3,658 1995 4 7
Northeat Ohio Regional Sewer District
25,172,770 4,633 120" 3,048 1996 5 6
Decatur, ILL 1,680,000 335 84" 2,134 1997 6 5
Tunneling
Pipe Diameter Trenchless Technology Project location Project cost
($CAN)
Pipe length
(m ) (in.) (mm) Year Vol. No.
Nashville & Davidson County 20,580,000 1,219 102" 2,591 1999 8 10
St. Louis, MO 10,360,000 1,890 78" 1,981 2000 9 3
Detroit, MI 28,313,600 5,012 84" 2,134 2000 9 5
Chicago, MI 52,262,000 5,865 - - 1995 4 9
CIPP
Pipe Diameter Trenchless Technology Project location Project cost
($CAN)
Pipe length
(m ) (in.) (mm) Year Vol. No.
Denver, CO 227,945 4,227 9" 229 1994 3 3 Denver, CO 641,554 2,425 8", 10", 12" 254 1995 4 1 Denver, CO 1,287,318 5,736 8" 203 1995 4 4 Amarillo, TX 680,408 3,658 6" 152 1998 7 4 Amarillo, TX 539,000 1,829 10" 254 1998 7 4 Houston, TX 3,304,000 5,425 10" to 12" 279 1998 7 12 Norwood, Mass. 105,360 510 8", 12" 254 2000 9 1
Altamonte Springs, Fla. 385,000 732 24" 610 1997 6 2
Tacoma, WA 840,000 1,372 18" to 30" 610 1998 7 1
Amarillo, TX 747,859 1,795 18", 27", 36" 686 1998 7 4
Amarillo, TX 1,019,493 2,874 18" to 27" 572 1998 7 4
CIPP
Pipe Diameter Trenchless Technology Project location Project cost
($CAN)
Pipe length
(m ) (in.) (mm) Year Vol. No.
Los Angeles, Calif. 1,719,997 1,453 21" 533 2000 9 5
Pima County, Ariz. 3,136,000 6,401 30", 33" 800 2000 9 9
Miami-Dade, Fla. 700,000 85 72" 1,829 1994 3 2 Denver, CO 1,661,621 1,524 2' 8" x 4' 1,016 1994 3 3 Denver, CO 1,316,039 1,640 26" x 39" etc. 826 1995 4 1 Chicago, MI 8,397,200 4,529 54" 1,372 1996 5 8 Ottawa, ON 1,761,000 820 60", 72" 1,676 1997 6 1 Newton, Mass. 5,880,000 9,144 12"x36",24"x36" 686 1999 8 8
San Jose, Calif. 2,793,847 1,667 42" 1,067 2000 9 4
Milwaukee, Wisc. 2,800,000 1,036 60" 1,524 2000 10 1 Montgomery County, Maryland 1,554,000 7,620 8", 15" 292 1994 3 1 Laurel, MD 610,383 3,048 8" to 18" 330 1996 5 5 Indianapolis, Ind. 3,640,000 19,202 8" to 60" 864 1996 5 11
CIPP
Pipe Diameter Trenchless Technology Project location Project cost
($CAN)
Pipe length
(m ) (in.) (mm) Year Vol. No.
Denver, CO 1,250,126 6,378 8", 9", 16" 279 1997 6 2 Denver, CO 1,412,265 3,754 10" to 36" 584 1998 7 2 Fresno, Calif. 5,832,400 4,828 30" to 48" 991 1998 7 8 Wichita Falls, TX 282,800 381 15", 36" 648 1998 7 9 Houston, TX 8,162,000 7,620 15" to 48" 800 1998 7 12 Houston, TX 3,360,000 4,267 10" to 30" 508 1998 7 12 Indiana 3,981,264 6,730 8" to 54" 787 1999 8 5 Cincinnati, Wisc. 5,460,000 15,682 8" to 24" 406 1999 8 5 Ft. Pierce, Fla. 1,260,000 305 30", 36", 42" 914 1999 8 11 Kenton County, Kentucky 1,960,000 9,144 8" to 15" 292 1999 8 11
Greenwich, Conn. 595,601 488 36", 39" 953 1999 8 12
Fairfax County, VA 1,960,000 2,493 24" to 42" 838 2000 9 2 Westchester County, NY 3,920,000 9,254 8" to 30" 483 2000 9 12
CIPP
Pipe Diameter Trenchless Technology Project location Project cost
($CAN)
Pipe length
(m ) (in.) (mm) Year Vol. No.
Massachusetts 16,660,000 4,828 27" to 48" 953 2000 10 7
Newton, Mass. 10,500,000 19,312 - - 2000 9 11
Phoenix, Ariz. 630,000 489 42" 1,067 Galeziewsk et al. 1995 Phoenix, Ariz. 532,000 397 47" 1,194 Galeziewsk et al. 1995 St. Louis, MO 27,300,000 8,500 8",82" 1,143 Moore & Nance 1995
HDD
Pipe Diameter Trenchless Technology Project location Project cost
($CAN)
Pipe length
(m ) (in.) (mm) Year Vol. No.
Franklin, MI 2,160,845 24,719 2" to 6" 102 1994 3 9
Oakland County, MI 1,343,849 14,196 2" to 6" 102 1995 4 9
HDD
Pipe Diameter Trenchless Technology Project location Project cost
($CAN)
Pipe length
(m ) (in.) (mm) Year Vol. No.
Denton, TX 80,192 259 3", 8" 140 2000 9 9
Ormond Beach, Fla. 386,400 1,737 6" 152 1994 3 9
Anne Arundel County, Maryland 1,349,600 1,829 16" 406 1996 5 10 Austin, TX 2,800,000 1,103 24", 36" 762 2000 9 1 St. Charles County, MO 7,697,628 1,036 42" 1,067 1998 7 3 Massachusetts 2,338,000 625 42" 1,067 1997 6 11 Clearwater, Fla. 3,076,909 3,048 8", 12", 16" 305 1994 3 8
Sliplining
Pipe Diameter Trenchless Technology Project location Project cost
($CAN)
Pipe length
(m ) (in.) (mm) Year Vol. No.
Houston, TX 1,680,000 8,839 8", 10" 229 1994 3 2
Shreveport, LA 760,844 1,311 30" 762 1995 4 11
Knoxville, Tenn. 1,559,690 1,001 33", 36" 876 2000 9 2
San Diego, Calif 1,680,000 366 42" 1,067 1997 6 6
San Antonio, TX 2,053,506 1,149 72" 1,829 1995 4 8
Alburquerque, N.M. 3,080,000 2,591 42" into 54"" 1,372 2000 9 10
Las Vegas, Nev. 4,200,000 3,840 48" exist. 1,219 2000 9 10
Evansville, Ind. 9,655,552 3,815 93", 112" 2,604 1999 8 5 Northwest Ohio Region 3,628,374 2,499 36" to 60" 1,219 1999 8 12 Phoenix, Ariz. 1,386,000 1,525 38" 965 Galeziewski et al. 1995 Phoenix, Ariz. 1,302,000 1,684 30" 762 Galeziewski et al. 1995 Phoenix, Ariz. 644,000 874 28" 711 Galeziewski et al. 1995
Sliplining
Pipe Diameter Trenchless Technology Project location Project cost
($CAN)
Pipe length
(m ) (in.) (mm) Year Vol. No.
Phoenix, Ariz. 602,000 822 34" 864 Galeziewski et al. 1995
Phoenix, Ariz. 98,000 117 36" 914 Galeziewski et al. 1995
Phoenix, Ariz. 112,000 197 24" 610 Galeziewski et al. 1995 Phoenix, Ariz. 1,092,000 560 84" 2,134 Galeziewski et al. 1995
Pipe Bursting
Pipe Diameter Trenchless Technology Project location Project cost
($CAN)
Pipe length
(m ) (in.) (mm) Year Vol. No.
Kenmore, NY 176,835 296 8" with 8" 203 1995 4 9
Eagle County, CO 4,200,000 1,829 15" ups. to 26" 660 1995 4 1 Tulsa, Okla. 700,000 1,829 10" ups. to 20" 508 1996 5 11
Pipe Bursting
Pipe Diameter Trenchless Technology Project location Project cost
($CAN)
Pipe length
(m ) (in.) (mm) Year Vol. No.
Tacoma, WA 1,501,233 1,923 10" ups. to 15" 381 1997 6 3 Denver, CO 812,385 712 10" ups. to 13" & 16" 368 1998 7 3 Baytown, TX 2,252,600 5,243 6" & 8" ups. to 12" & 18" 381 1998 7 8
Kettering, Ohio 476,000 533 18" with 18" 457 2000 9 3
Houston, TX 1,705,893 8,513 6" ups. to 15" 267 1994 3 5 Wichita Falls, TX 2,799,852 13,716 6", 18" 305 1998 7 9
Pipe Jacking
Pipe Diameter Trenchless Technology Project location Project cost
($CAN)
Pipe length
(m ) (in.) (mm) Year Vol. No.
Houston, TX 5,544,644 1,628 60" 1,524 1996 5 8
Dallas, TX 1,211,406 67 60" 1,524 1997 6 1
Flint, MI - - 66" 1,676 1997 6 12
Flint, MI - - 54" 1,372 1997 6 12
Springfield, ILL 2,184,000 168 144" 3,658 1994 3 2
Relining
Pipe Diameter Trenchless Technology Project location Project cost
($CAN)
Pipe length
(m ) (in.) (mm) Year Vol. No.
Long Beach, Calif. 882,000 4,436 8 203 1994 3 5
Nashville, Tenn. 2,759,798 7,828 8", 10", 12" 254 1996 5 4
Glendale, Calif. 1,680,000 8,077 8", 10" 229 1999 8 9
San Diego, Calif. 107,800 262 - - 1994 3 5
Tallmadge, Ohio 189,955 914 8", 15" 292 1995 4 1
Denver, CO 1,660,187 10,892 8", 10", 12" 15", 18" 320 1999 8 6 Denver, CO 1,528,656 11,158 8", 10", 18" 305 1999 8 6
Open Cut
Pipe Diameter Trenchless Technology Project location Project cost
($CAN)
Pipe length
Open Cut
Pipe Diameter Trenchless Technology Project location Project cost
($CAN)
Pipe length
(m ) (in.) (mm) Year Vol. No.
Cook County, ILL 17,481,292 4,657 36", 72" 1,372 1993 2 4
Homestead, TX 2,286,339 665 12", 18" 381 1993 2 4
Denver, CO 1,208,166 2,298 8", 12" 254 Barsoom 1995
Denver, CO 1,721,758 3,366 8" 203 Barsoom 1995
Denver, CO 208,443 445 8", 10" 229 Barsoom 1995
Denver, CO 431,144 129 15" 381 Barsoom 1995
Phoenix, Ariz. 238,000 153 24" 610 Galeziewski et al. 1995 Phoenix, Ariz. 280,000 166 28" 711 Galeziewski et al. 1995 Phoenix, Ariz. 224,000 218 28" 711 Galeziewski et al. 1995 Phoenix, Ariz. 196,000 107 43" 1,092 Galeziewski et al. 1995 Denver, CO 276,455 470 8", 21", 24", 27" 508 Barsoom 1995 Denver, CO 763,231 420 15", 24", 27" 559 Barsoom 1995 Denver, CO 1,208,166 1,045 10", 18", 21", 24" 464 Barsoom 1995
Open Cut
Pipe Diameter Trenchless Technology Project location Project cost
($CAN)
Pipe length
(m ) (in.) (mm) Year Vol. No.
Other methods
Pipe Diameter Trenchless Technology Methods Project location
Project cost ($CAN)
Pipe length
(m ) (in.) (mm) Year Vol. No.
Spiral wound Venice, Calif. 3,738,000 1,585 45" 1,143 1997 6 5 Spiral wound Phoenix, Ariz. 103,600 66 28" 711 Galeziewski et al. 1995 Spot repair St. Louis, MO 3,778,450 2,208 102"x102",
120"x120"
2,819 1999 8 12
Point repair Pinewood, Ariz. 1,960,000 900 - - 1994 3 4
Grouting St. Louis, MO 1,260,000 5,870 24", 48", 84" 1,321 1996 5 7 Sewer evaluation Anderson, ON 350,000 3,536 8" to 15" 292 1996 5 8 Sewer evaluation Gwinnett County, GA 1,960,000 762,000 - 0 1996 5 12 Chemical cleaning Cheyenne, Wyo. 197400 3,048 4" 102 1997 6 5
MH rehabilitation Hampton, VA 71,806 101 - - 1996 5 9
MH rehabilitation Wichita Falls, TX 243,600 315 - - 1998 7 9
MH rehabilitation New Orleans, LA 2,142,000 1,100 - - 1999 8 8
Other methods
Pipe Diameter Trenchless Technology Methods Project location
Project cost ($CAN)
Pipe length
(m ) (in.) (mm) Year Vol. No.
MH new construction (poured on site) Ottawa, ON - - - - 1998 Yardsticks MH new construction (precast) Ottawa, ON - - - - 1998 Yardsticks
Appendix B: Building Cost Index History from 1915 to 2001 (ENR 2000)
Year BCI Year BCI Year BCI Year BCI
1913 100 1936 172 1958 525 1980 1941 1915 95 1937 196 1959 548 1981 2097 1916 131 1938 197 1960 559 1982 2234 1917 167 1939 197 1961 568 1983 2384 1918 159 1940 203 1962 580 1984 2417 1919 159 1941 211 1963 594 1985 2428 1920 207 1942 222 1964 612 1986 2483 1921 166 1943 229 1965 627 1987 2541 1922 155 1944 235 1966 650 1988 2598 1923 186 1945 239 1967 676 1989 2634 1924 186 1946 262 1968 721 1990 2702 1925 183 1947 313 1969 790 1991 2751 1926 185 1948 341 1970 836 1992 2834 1927 186 1949 352 1971 948 1993 2996 1928 188 1950 375 1972 1048 1994 3111 1929 191 1951 401 1973 1138 1995 3111 1930 185 1952 416 1974 1205 1996 3203 1931 168 1953 431 1975 1306 1997 3364 1932 131 1954 446 1976 1425 1998 3391 1933 148 1955 469 1977 1545 1999 3456 1934 167 1956 491 1978 1654 2000 3539 1935 166 1957 509 1979 1919 2001 3574