PFC/RR-83-3 DOE/ET-51013-65 UC-20
D-D FUSION NEUTRON SPECTRA MEASUREMENTS AND ION TEMPERATURE DETERMINATION AT ALCATOR C
William A. Fisher
Plasma Fusion Center
Massachusetts Institute of Technology Cambridge, MA 02139
February 1983
This work was supporte No. DE-AC02-78ET51013. and disposal , in whole ment is permitted.
d by the U.S. Department of Energy Contract Reproduction, translation, publication, use or in part by or for the United States
govern-ION TEMPERATURE DETERMINATgovern-ION AT ALCATOR C
by
William Andrew Fisher
B.S.E.P. The Ohio State University (1977)
M.S. Nuclr. Eng., Massachusetts Institute of Technology (1980)
Summitted to the Department of Nuclear Engineering in Partial Fulfillment of the Requirements of the Degree of
DOCTOR OF SCIENCE at the
MASSACHUSETTS INSTITUTE OF TECHNOLOGY January 1983
@ Massachusetts Institute of Technology
Signature of Author
Department of Nuclear Engineering, February 11,1983
Certified by:
Prof. S. H. Chen, Department of Nuclear Engineering
Certified by:
Prof. R. R. Parker, Department of Electrical Engineering
Accepted by:
Page 2
D-D FUSION NEUTRON SPECTRA MEASUREMENTS AND ION TEMPERATURE DETERMINATION AT ALCATOR C
BY
William Andrew Fisher
Submitted to the Department of Nuclear Engineering on February 11, 1983 in partial fulfillment of the requirements for the Degree of Doctor of Science in
Nuclear Engineering Abstract
A neutron spectrometer system has been designed, assembled, and used to measure the D-D neutron spectrum at Alcator C. The design of the shielding and collimation was critical to the successful measurement of the spectrum and involved an integral approach in which the neutronics of the Alcator C was exploited to obtain a successful system.
The system consists of a 3He ionization chamber mounted in a
multi-component shield system. Essentially the outermost part of the shield and collimator has been designed to moderate the MeV range neutrons to thermal energies. The inner part of the shield is designed to capture the thermalized neutrons with a minimum of gamma production. As a result, measurements during plasma discharges indicate that the ratio of the number of counts in the 2.45 MeV peak to the total number of neutron counts in the ion chamber is 1/67.
A count rate as high as 44 counts/sec in the 2.45 MeV peak has been attained and was limited by the production rate of the plasma. However, the ultimate limit on the count rate is estimated to be less than 100 counts/sec.
It is a known result that the 2.45 MeV peak width can be used to estimate the ion temperature for Maxwellian ion energy distributions. A technique for deducing the ion energy distribution from the neutron spectrum for a case of a
supra-thermal ion tail on a cold bulk plasma has been outlined. Neutron spectra have been measured at the Alcator C tokamak. The spectra show that there is little evidence of neutrons produced from photoneutron reactions, or electrodissintegration. Further the shape of the 2.45 MeV peak is consistent with the Gaussian shape predicted from theory.
The spectrometer resolution has been measured in calibrations to be 46 keV. This resolution has been sufficient to derive an ion temperature from the line width of the measured neutron
spectra. These line width derived ion temperatures are consistent with other ion temperature measurements and with doppler line broadening theory.
Thesis Supervisors:
Professor S.H. Chen, Deptartment of Nuclear Engineering Professor R.R. Parker, Department of Electrical Engineering and Head of the Alcator Fusion Group
Page 4
Acknowledgements
An experiment such as Alcator C is the result of the hard work of many dedicated individuals, from technicians who keep the machine
running to staff physicists who have often made valuable comments on this work. I thank all of them for their help. I would like to thank a few in particular.
Frank Silva and his crew were always available when the time came for them to move the shielding and many times helped far beyond the call of duty. Bob Childs and the staff of the vacuum shop were invaluable in the design of the accelerator needed for this project.
I thank Dick McNab of the Magnet Laboratory for his help in making Li targets for my calibration. The machine operators, Dave Gwinn, Bruce Lipschultz, and Ron Parker, for their patience in running the large number of discharges needed. The administrative staff, particularly Layla McKnight, for having a system that works well, which made my chores much easier.
I would like to thank Prof. Sow Hsin Chen for being a friend during my entire stay at M.I.T., and for his guidance in many steps of this thesis.
Outside M.I.T., I would like to acknowledge the help of Mr. Frank Chmara of Peabody Scientific for his help with the ion chamber and Dr. Dennis Slaughter at the Lawrence Livermore National Laboratory for his help with the calibration of the spectrometer.
Page 6
Prof. Ron Parker at Alcator. Ron had the insight to gamble that my estimates were correct and give me a chance to try.
I also thank Dave Gwinn, for pushing me into areas which I may not have explored otherwised. I would like to thank Dr. Catherine Fiore for her comments and support during the many difficult hours of plasma runs.
Finally, I would like to educating me to the tricks of Alcator graduate students who
ridiculous idea or complaint.
thank Willi Burke for his help in our text editor system, and all the always seem to have an ear for a
Table of Contents
Chapter I Introduction
1.1 The Alcator C Tokamak ... 16
1.2 Sensitivity of Ion Temperature to Plasma Conditions...18
1.3 Summary of Techniques of Neutron Spectroscopy...20
1.3.1 Integral Proton Recoil 1.3.2 Time of Flight 1.3.3 Nuclear Emulsions 1.3.4 3He Sandwich Detector 1.3.5 3He Ionization Chamber 1.4 Objectives and Outline...26
Chapter II Theory of Neutron Spectroscopy 2.1 Neutron Producing Reactions in Tokamaks...35
2.2 Total Neutron Measurements...39
2.3 Reactivity Calculations... ....- 41
2.4 Neutron Energy Spectrum Derivation...42
2.4.1 Bulk on Bulk Interactions 2.4.1.1 The Three Dimensional Maxwellian Ion Distribution 2.4.1.2 The Monoenergetic Ion Distribution 2.4.2 Tail on Bulk Interactions 2.5 Corrections to Line Width Derived Ion Temperatures...56
2.5.1 Spatial Profile Correction
2.5.2 Sawtooth Oscillations Correction 2.5.3 Time Integration Correction
Page 8
Chapter III The Spectrometer System
3.1 System Overview...86
3.2 3He Ion chamber...88
3.3 Collimation and Shielding...90
3.4 Spectrometer Performance...93
3.4.1 Energy Calibration with D(D,n)3He Reaction 3.4.2 Energy Resolution Calibration with Li(p,n)Be Reaction 3.4.3 Figures of Merit 3.4.4 Summary of Spectrometer Performance Chapter IV Analysis of Spectra 4.1 Sampling Error...110
4.2 Form of the Neutron Spectrum Data...112
4.3 Fitting Data with Good Statistics...115
4.4 Techniques for Fitting Data with Poor Statistics....117
4.4.1 Components of Fast Peak 4.4.2 Calculation from Formula Technique 4.4.3 Collapse and Fit Technique 4.4.4 Fitting using the Chi-square Statistic 4.4.5 Fitting using the "C" Statistic 4.5 Procedure for Deducing the Ion Temperature...124
Chapter V Measurements at Alcator C 5.1 Overview...133
5.3 "A" Port Measurements... 135
5.3.1 Discussion of Neutron Spectrum 5.3.2 Estimate of D-D to D-T Rate Ratio 5.3.3 Count Rate Effects on Spectrum 5.4 "C" Port Measurements...139
5.5 "E" Port measurements...141
5.6 Measurement Conclusions... 143
Chapter VI Summary and Suggestions for Future Work 6.1 Summary ... 169
6.2 Suggestions for Future work...171
References... . ... ... 174
Appendix A Equations for Table 2.1...179
Appendix B WEP Casting Information...180
Page 10
List of Figures
1.1 The Alcator Tokamak...29
1.2 Tin versus Ticx ... 30
1.3 Ti versus plasma density...31
1.4 Ti versus plasma current, 8 T...32
1.5 Ti versus plasma current, 10 T...33
1.6 Ti versus toroidal field...34
2.1 Effect of neutron producing processes on the neutron spectrum... . 69
2.2 Fig. 1 of Strachan and Jassby [1.15)...70
2.3 Neutron spectrum for the 3-D monoenergetic ion distribution... 71
2.4 Model for Tail on Bulk interaction...72
2.5 D-D reaction in the labortory coordinate system...73
2.6 Neutron spectrum for MEID, Eb=10 keV...74
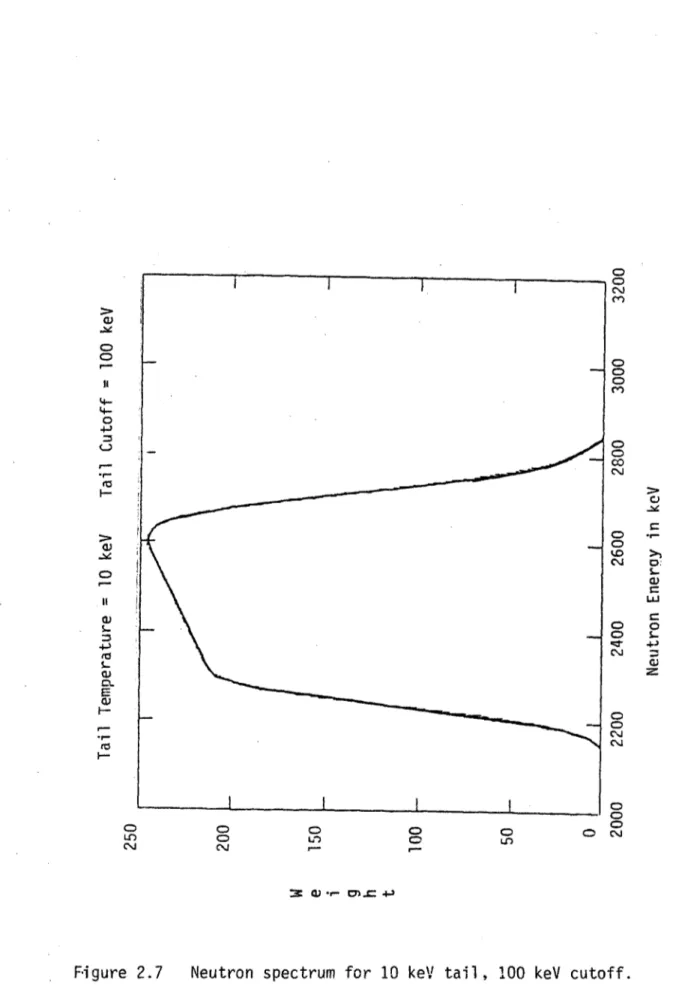
2.7 Neutron spectrum for 10 keV tail, 100 keV cutoff...75
2.8 Neutron spectrum for 10 keV tail, 10 keV cutoff...76
2.9 Neutron spectrum for 20 keV tail, 10 keV cutoff...77
2.10 Neutron spectrum for 30 keV tail, 20 keV cutoff...78
2.11 Neutron spectrum for 30 keV tail, 100 keV cutoff...79
2.12 Detector resolution convolved into neutron spectra of Maxwellian and monoenergetic ion distributions...80
2.13 Sawtooth model... 81
2.14 Sawtooth Oscillation on soft x-ray and total neutron signals... . 82
2.15 Neutron production versus minor radius and
resulting neutron spectrum for Gaussian Ti(r) profile...83
2.16 Neutron production versus minor radius and resulting neutron spectrum for flattened ion energy profile...84
2.17 Typical Plasma shot with time gate for neutron spectroscopy...85
3.1 Spectrometer top view...100
3.2 Spectrometer side view...101
3.3 Block diagram of spectrometer electronics...102
3.4 3He cross sections and ion chamber relative efficeincy...103
3.5 Spectrometer calibration response function...104
3.6 Mechanical description of ion chamber...105
3.7 Neutron spectrum calculated using the MCNP code...106
3.8 Qualitative effect of T on 2.42 spectrum peak shape...107
3.9 Variation of spectrum peak FWHM with T ... 108
3.10 Fit of calibration spectrum peak...109
4.1 Forms of fitting functions...128
4.2 Confidence of fit versus sigma for the "C" statistic technique...129
4.3 C statistic fit to uncollapsed data sum of 8-6-82...130
4.4 Thermal peak with fit, 8-6-82...131
4.5 Nine channel collapse of data and normallized
fit,
8-6-82...132Page 12
5.1 Ion chamber setup in water tank...148
5.2 Spectrometer setup under "E" port...149
5.3 Spectrometer setup at "A" port side...150
5.4 Log plot of spectrum for sum of shots, 3-3-82 through 3-11-82...151
5.5 D-D fusion peak for sum of shots, 3-3-82 through 3-11-82...152
5.6a D-D fusion peak, test 1, "A" port...153
5.6b Thermal peak, test 1, "A" port...154
5.7a D-D fusion peak, test 2, "A" port...155
5.7b Thermal peak, test 2, "A" port...156
5.8a D-D fusion peak, test 3, "A" port...157
5.8b Thermal peak, test 3, "A" port...158
5.9 Sum spectrum for "C" port...159
5.10 Computer fit of D-D fusion peak, 3-15-82, Ti=800
eV...
.... .... 1605.11 Computer fit of D-D fusion peak, 3-16-82, Ti=1050 eV... ... 161
5.12 Reduced width of fits from Figs. 5.10 and 5.11 plotted against
T
... 1625.13 Shot with a high hard x-ray level...163
5.14 Neutron spectrum for shot in Fig. 5.13...164
5.15 Shot with low hard x-ray level...165
5.17 Neutron spectra after nine channel collapse and
example fit-- -.... ... ... 167 5.18 Ion temperature drived from FWHM of spectra in
Page 14
List of Tables
1.1 Parameters of the Alcator C Tokamak...28
2.1 D-D Cross Section Values From Fits of Various Authors..61
2.2 Experimental Values of the D-D Cross Section...63
2.3 Reactivites Computed by Various Authors...64
2.4 Cross Section Error in Reactivity and Ion Temperature..65
2.5 Contribution of Density terms to Reactivity...66
2.6 Effect of Limiter q on Ti derived From the Peak Width.67 2.7 Correction Factor Versus Limiter q and q=1 Surface rs..68
4.1 Form of Peak Fitting Functions...126
4.2 Error of Calculated Sigma Technique...127
5.1 Results of shielding tests 1-3...146
Chapter I. Introduction
The fact that the fusion neutron spectrum could be used to study the ion energy distribution of a thermonuclear plasma has been known
since the early days of fusion research. In 1967 Lehner and Pohl [1.1] presented a paper in which most of the theory used today was detailed. Unfortunately, very little use has been made of this knowledge because of the difficulty in making high resolution
measurements of fusion neutrons. The work discussed here represents a successful attempt at such a measurement.
This chapter has been divided into four sections. The first section briefly describes the Alcator C tokamak, defining many of the terms to be used in subsequent chapters. Section 2 reviews how the
ion temperature is known to vary with plasma parameters and is meant to help the reader to appreciate the level of uncertainty to which the ion temperature is presently measured. The third section provides a summary of measurement techniques which have been used or proposed for fusion neutron energy measurements with emphassis on the technique chosen for the measurement here. The final section contains a
statment of the thesis objectives followed by an outline of the thesis structure.
Page 16
1.1 The Alcator C Tokamak
The Alcator C tokamak, built and operated at the Massachusetts Institute of Technology for the Department of Energy is a high field compact tokamak device. In such a device the plasma is produced in a
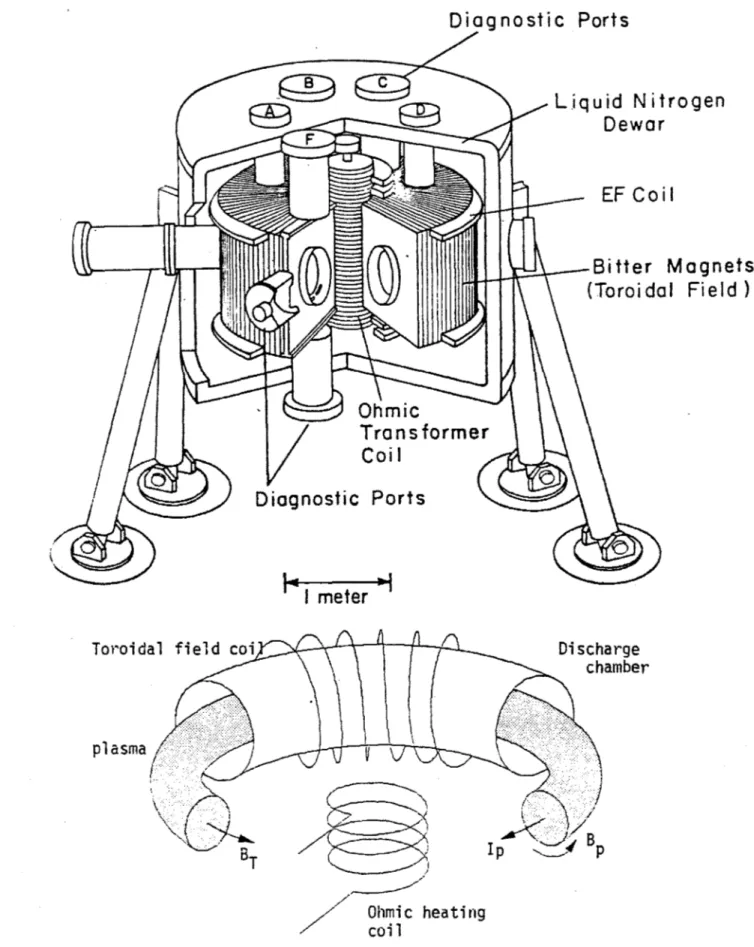
toroidal geometry in which the plasma is defined to have a minor radius, a, and a major radius R. These are illustrated in Fig. 1.1. In order to confine the plasma in a stable configuration both a large toroidal magnetic field and relatively smaller poloidal magnetic field are required. For Alcator C the toroidal field is provided by the Bitter magnet plates shown in Fig. 1.1 and the poloidal field is generated by the plasma current which also heats the plasma. It is useful to describe how a plasma discharge or shot is formed or run.
Initially the toroidal magnet field is energized, and then a large voltage is formed across the ohmic transformer coil in the center of the machine. The initiation of this voltage ionizes the 'fill gas' in the vacuum chamber resulting in the plasma which becomes the secondary of a transformer circuit coupled to the OH primary. The decay of the voltage drives the plasma current. As the plasma current increases additional gas is puffed into the plasma through one or two of the diagnostic ports. Eventually a steady state condition is reached during which the plasma current and density are constant. Because the OH power supply is finite, the duration of this constant plasma
condition is limited to a few hundred milliseconds; after which, the plasma current and density decline and the plasma ends. A large amount of power (up to 1 MW) is transferred to the plasma in the course of a shot and this power must be absorbed by the surrounding
structure. Such power loads could damage the vacuum chamber wall so a ring of molybdenum blocks surrounds the minor radius at two toroidal locations. These "limiters" define the plasma edge and take the large energy load.
The plasma is characterized by the steady-state plasma current
Ip, the steady-state line-averaged density ne, and the toroidal field BT. (The term line-average applies to a measurement which measures a quantity such as the density along a chord or line of the
plasma. For example the electron density is measured using laser interferometry and represents an average over the path the laser beam makes through the plasma.) The significant operating parameters of the machine are summarized in table 1.1. By adjusting BT, Ip and ne a variety of plasma physics problems can be studied. In particular, it
is possible to adjust the temperature of the ions in the plasma. The trend of the ion temperature with BT, Ip,and ne are discussed in the next section.
Alcator "C" operates at the highest magnetic field and density of any present day fusion device. Only one other tokamak, Frascati
Tokamak (FT) operates with a toroidal field greater than 5 T and central densities greater than 1x10²⁰ m-3. The higher density has
two advantages in terms of neutron spectroscopy. First, the neutron spectrum is dominated by the thermonuclear neutron production which is proportional to the density squared. At the Princton Large Torus
(PLT) where the density is an order of magnitude lower, about half of the neutrons are produced from non-thermonuclear reactions under ohmic
Page 18
heating conditions [1.2]. However, the higher density at Alcator C favors the production of thermonuclear neutrons and it is possible to obtained a thermonuclear neutron peak not distorted by
non-thermonuclear effects. Second, the higher density Alcator C ohmic discharges have a neutron production rate which is comparable with higher temperature beam heated plasmas. For example, Alcator C typically has an ion temperature of 1 keV for a high density shot while PLT will have an ion temperature between 2 and 5 keV for a neutral beam heated plasma. A lower ion temperature provides a more severe test of the diagnostic method and measurement resolution because the D-D thermonuclear peak is known from theory to broaden with increasing ion temperature. Thus Alcator C provides an ideal environment for the measurement of a high resolution neutron spectrum.
1.2 Sensitivity of Ion Temperature to Plasma Parameters
The ion temperature is a fundamental plasma parameter of great importance. As will be shown in Chapter II the fusion rate is a very strong function of the ion temperature. For Alcator C plasmas the ion temperature is believed to vary with only the minor radius and the ion temperature is characterize by a central (r=O) ion temperature.
Figures 1.2 through 1.6 illustrate the major trends of ion temperature with plasma parameters. The data presented in this section represents the work of the Alcator group as a whole and are not as present
published in a complete form. Reference [1.3] is a general review of the Alcator C experiment and contains Fig. 1.4. Most of the figures have be taken from an invited talk by R.R. Parker at the 1982 American
Physical Society Meeting (Figs. 1.2, 1.4, 1.5). Figures (Fig.1.3,1.6) have been obtained from a collection of figures used at an informal FT - Alcator tokamak workshop during the summer of 1982. In all cases Tin indicates the central peak ion temperature as determined by the
total neutron rate measurements, and Ticx refers to the ion temperature determined from the neutral particle charge exchange spectrum. These two diagnostics generally show agreement with each other as in indicated in Fig. 1.2, where Tin is plotted against Ticx for a large number of plasma shots. Figure 1.3 shows the trend of ion temperature with plasma density. Note that the ion temperature
is roughly constant over a wide density range. In Figs. 1.4 and 1.5 the trend with plasma current is shown for two different toroidal
fields. The central ion temperature tends to increase slowly with current and more strongly with toroidal field. The trend with
toroidal field is also shown in Fig. 1.6. There is a general increase in the ion temperature with toroidal field because the higher field allows a higher plasma current density without plasma instabilities developing. Note that in all the figures that the measurement of the ion temperature varies by at least 10%. As can be seen from this data, the ion temperature at Alcator C is typically around 1 keV. For the next section it is useful to anticipate the results of Chapter II in that the expected neutron feature which is to be measured is a Gaussian peak with a mean energy of about 2.45 MeV and a width of about 75 keV at full width at half maximum (FWHM).
Page 20
1.3 Summary of Techniques of Fast Neutron Spectroscopy
A number of techniques exist to measure neutron spectra. Not all are applicable to fusion neutron detection. Calvert and Jaffe [1.4] and Knoll [1.5] have good summaries of general techniques of neutron spectroscopy. Five major techniques have been used or proposed for fusion spectroscopy:
1. integral proton recoil
2. time of flight
3. interaction in nuclear emulsions,
4. 3He charged particle sandwich detectors, and
5. 3He ionization chambers.
1.3.1 Integral Proton Recoil
When a neutron scatters from hydrogen the proton energy is given
by EP = Encos2b. Thus for a given neutron energy, there is a continuum of proton energies. Knoll [1.5], for example, has shown that it possible to obtain the neutron energy distribution from a measured integral proton recoil distribution. Typically, a liquid
scintillant with a high hydrogen content is used as both a recoil medium and light source for a photomultiplier based electronics.
Using the light output for the most popular scintillant, NE213 [1.6], assumming perfect light collection, and a quantum efficiency of 20%
for the photomultiplier tube, the best resolution is limited by Poisson statistics to be 110 keV FWHM. In practice, light collection
is not perfect, and the a resolution of 160 keV (FWHM) at 2.45 MeV reported by D. Slaughter [1.7) appears to be near the practical limit of the method. Thus it can not be used to deduce the ion temperature for Alcator C where the line width of the fusion peak is less than 100 keV. However, when non-thermal conditions exist such as in beam
heated machines or when higher ion temperatures are obtained in later fusion devices the resolution may be sufficient.
Two attempts of note have been made to measure fusion neutron spectra with NE 213 based detectors. D. Pappas et al. [1.8] have measured the neutron spectrum at Alcator C using a NE-213 recoil counter. Unfortunately, the line width scaled from their results is on the order of 1.0 MeV , much greater than required to resolve the ion temperature from the neutron spectrum.
M. Chatelier et al. [1.9] has developed a NE-213 recoil
spectrometer for the TFR Tokamak. The spectrometer was optimized for the maximum count rate of 2 x10⁵ counts/sec. The resolution is greater than 200 keV and thus the spectrometer can not be used to determine the line width at Alcator. However, the TFR group has been able to measure neutron spectra from a spectrometer which was not collimated. They have found evidence of a peak at 2.5 MeV in discharges not dominated by high energy electrons, ( so called "run away electrons") and a spectrum dominated by gamma rays and
Page 22
1.3.2 Time of Flight
Time of flight based measurements, which have been used
extensively on laser pellet and plasma focus devices, are difficult to utilize on tokamak plasmas because of the absence of a well defined start time. However, there is a current proposal by Elevant [1.10] to use this technique . He obtains a start signal by scattering the
neutron in a NE-111 liquid scintillant [1.6] and obtains a stop signal by then capturing the scattered neutron in a NE-213 detector.
Elevant's calibrations showed that the energy resolution at 2.5 MeV could be as low as 4.5%, sufficient to resolve ion temperatures as low as 2 keV. The technique has a very low efficiency due to the need to separate the start and stop detectors by several meters and to have the first scatterer several meters from the plasma. Thus the overall efficiency is constrained to be on the order of 10-10 and this
technique will be useful only on very high neutron rate machines such as TFTR and JET.
1.3.3 Nuclear Emulsions
A technique in which the length and angle of the proton recoil tracks in a photographic emulsion are measured and related to the incoming neutron energy has been used at the ASDEX tokamak device during neutral beam heating. [1.11]. While statistical fluctuations in the range of the recoil proton limit the resolution to about 2.5 % the Asdex group claims a resolution of 4%. Again, this resolution is not sufficient to measure the thermonuclear peak at Alcator C. The
intrinsic efficiency is good, on the order of 0.4 and time resolution during a single plasma shot can be obtained through the use of movable
shielding which can be opened and closed in less than 20 msec.
The Asdex group has used the nuclear emulsion method to study thermal and non-thermal neutron emission during beam heating. They have obtained a line width as low as 190 keV yielding a claimed ion temperature of 1.75 keV with an error of approximately 50% . They have also observed unexplained non-thermal neutron spectra during their highest power (2.4 MW) hydrogen beam injection.
1.3.4 3He Sandwich Detector
3He sandwich detectors have been proposed for the Tokamak Fusion
Test Reactor (TFTR) experiment [1.12]. These detectors have a high pressure 3He gas cell sandwiched between two solid state charged
particle detectors. When a 3He(n,p)T reaction occurs in the gas cell, the charge particle energy is summed by the two detectors. Although this detector can tolerate moderate count rates (on the order of 105) but has an intrinsic efficiency of only 10-6. This detector may have sufficient resolution but it has not been demonstrated to my
knowledge. The resolution is claimed to be 2% by the TFTR group. However, the manufacturer only claims a resolution of 4% or 150 keV [1.13]. Nevertheless, the efficiency of the detector is still an order of magnitude too low for use at Alcator C. TFTR is expected to have much higher neutron rates and higher ion temperatures than
Page 24
choice even if the resolution turns out to be only 4%. As will be seen in the next section, the sandwich detector is expected to have a maximum count rate higher than the technique chosen here.
1.3.4 3He Ionization Chamber
The 3He ionization chamber used here [1.141 was chosen because it could provide the resolution required to measure the line width at Alcator C. The ion chamber which will be described in detail in Chapter III obtains the neutron energy by summing the energy of the charged particles from the 3He(n,p)T reaction in the active volume of
the gas.
The energy resolution has been measured to be 46 keV at 2.45 MeV and the measured intrinsic efficiency is 1.7x10⁻⁴. This efficiency
is 2 orders of magnitude greater than the sandwich detector. More important, at the time of the selection of the detector the resolution was known to be better than 60 keV at 2.45 MeV [1.15] making a ion temperature determination from the line width possible at Alcator C.
It is useful to outline the attempts which have been made to measure fusion neutron spectra with the 3He ion chamber.
Strachan et al. at PLT [1.15] have used the ion chamber to measure the fusion neutron spectrum during beam heated plasmas. They reported that due to pile-up of thermal neutron counts and gamma ray counts he was only able to obtain a maximum count rate of a few counts per plasma shot in the fusion neutron spectrum peak (typical shot count time of 200 msec). He was able to show that there was a
difference in the mean neutron energy for co-injection and counter injection of deuterium neutral beams, although there was a discrepancy in the mean neutron energies he measured and the predicted mean
energies. The shift was found to be 260 keV. During hydrogen neutral beam heating he found no such shift within the accuracy of his
measurement and reported that his mean energy was 2.41 ±.02 MeV for counter-injection, 2.42 ± .01 MeV for co-injection. He attributed the discrepancy between the theoretical peak energy of 2.45 MeV and his measurement to an energy scale calibration.
In a later paper on neutron flux measurements at PLT [1.161 Zanki et al. presented a spectrum measurement for a beam heated plasma which was used to estimate the amount of neutron scattering in the PLT
machine. No quantitative analysis of the spectrum parameters was presented.
Strachan and co-workers have also used the ion chamber to observe electro-disintegration neutrons at PLT [1.2]. For low density
ohmically heated PLT discharges, he found that the neutron spectrum was dominated by D(e,e',n)H and D(y,n)H neutrons. During
ohmically heated deuterium discharges with conditions of ne =
3x10¹⁹ m-3 and central ion temperature of 800 eV roughly half the production is due to thermonuclear neutrons. The spectrum he
presented for these conditions showed that the thermonuclear peak was distorted by the D(e,e',n)H continuum. Again, no attempt was made to deduce information from the peak.
Page 26
No examples of a neutron spectrum taken under ohmic heating conditions have been found other than that of Strachan at PLT [1.2] cited above. Strachan also appears to be the only other experimenter who has used the 3He ionization chamber for plasma neutron
measurements.
1.4 Objectives and Outline
The purpose of this thesis was to demonstrate the use of fusion neutron spectroscopy as a diagnostic tool at the Alcator C tokamak device. In particular, the objectives were to:
1. Assemble a neutron spectrometer capable of resolving the 2.45 MeV D-D fusion neutron peak.
2. Characterize the performance of the spectrometer.
3. Provide background theory to relate the neutron spectrum shape and magnitude to the ion temperature distribution.
4. Measure and interpret the neutron spectrum from Alcator C discharges.
Chapter II provides a review of the theory of neutron production and neutron spectroscopy in a fusion plasma. The first section
provides an overview of reactions which can and have produced neutrons other than the thermonuclear D-D neutrons of primary interest here. The important result of the section is that all of these "nonthermal" processes can be identified in a neutron spectrum measurement.
Sections 2 and 3 concern total neutron measurements and reactivity calculations and have been included to summarize how the neutron rate is used as a diagnostic and its limitations. Section 4 provides theory to relate the ion energy distribution to the neutron spectrum. The results for neutron spectra generated by bulk plasma has been
taken from the literature. The section on Tail on Bulk distributions is an extension of that work for case of a distribution suspected to cause very high neutron rates on the Alcator A tokamak. The final
section relates the theory to the actual experimental situation in that some modification of the theory is required to correct for the fact that measurements were made on an average of plasma conditions.
Chapter III describes the final design of the spectrometer system, the overall system performance in calibrations and outlines figures of merit which are useful in describing the performance.
Chapter IV outlines the special analysis techniques which were used to gain the maximum amount of information from the data at hand. Much of this section simply reviews techniques which were tried and why the analysis proceedure used was chosen. The final section provides an outline of the proceedure which was chosen to deduce the ion temperature from the line width.
Chapter V reports on the measurements done on the Alcator C machine. These measurements are presented in chronological order to indicate the iterative procedure which resulted in the final system design of Chapter III. The results of the measurements at "E" port, Section 5, represent the best set of neutron measurements and are a
Page 28
good indicator of the system limitations.
Chapter VI provides an overall summary of the significant results of this work and suggestions for future work.
Machine Parameters Design to date unit
Major radius minor radius Toroidal field Current Density Aux heating 4.6 Ghz Lower Hybrid 150-200 Ghz Ion Cyclotron 64 16.5 140 1000 2x10²¹ 4000 4-10 58 to 71 10 to 16.5 30 to 130 100 to 750 IxlO 9-1.3x10²' 0 to 750 0 Table 1.1
Alcator C Operating parameters
cm cm kG kA M- 3 kW MW
Diagnostic Ports
Liquid Nitrogen
z~f
5)Dewar
FEF Coil
Bitter Magnets
(Toroidal Field)
OhmicTransformer
Coi
IDiagnostic Ports
I meter
Toroidal field coi Discha
ch
plasmav
Ip p
Ohmic h coil eati ng
Figure 1.1 The Alcator C tokamak , top- artists conceptic; bottom- plasma, fields, and currents
rge amber
Page 30
1.00
<W
14<1.25
1.25
<i,4<
1.50
1.50
<n,
4
<1.75
0
A
0
z
0
U5
U_)
2E
w
LL
z
0
z
0
LL
U
ZD
U
z
0
1500
1000i
500
0
/6/O
Os
-0
,/ 0 00,500
ION
TEMPERATURE FROM
SPECTRA (eV)
1000
1500
FAST NEUTRAL
PFC -8239
Figure 1.2 Tin versus Ti cx
1.75 <i14
<2.00
oIOT,
D
2
_
/ / / / //
/ / / / / / / / 0 I I0 U a on
no
go
I 0 0*
SQ>
*
80
0 0 * 0 a i00 00 0 00 0 00
Ti versus plasma density x 0 o CL) 'p -C) -i .-0 0 0 IJ-I 0 L~J H U k
E
r', 0 U N 0 0 0 NO 000 N 0 0 00 U) c -4 oI
I
Figure 1.3LA
Lii
z
0
0
z
z
0
LIU
z
LUJ
PLASMA
Ti versus plasma current, BT = 8T
Page 32
3.0
2.5
2.0
1.5
1.0
0.5
0
0
100
200 300
400
1.00
<T
14
<1.25 o
_1.25<514<1.50
A
1.50<14<1.75
0
1.75<514<2.00
o
8T,
D
2
8
9500
-
-I
500 600 700
CURRENT I (kA)
PFC -8241 Figure 1.4I)
0*-CL
z
0
0
z
0
cc
0
-IJ
-LJ
z
Ud
1.00
<ii
14<1.25
o
1.25<ci
14
<I.50
1.50 <-n,4-<1.75
3.0
2.5
2.0
.Q-y
A
aJJ
0
100 200 300 400 500 600 700
PLASMA CURRENT I,(kA)
PC -62s37
Ti versus plasma current, BT = 10T A
0
1.75 <n
14<2.00
o
IOT,
D
MA
M
1.5
1.0
0.5
0
I
i
I
I
I
oI
I
I
I
I
I
Figure 1.5* 0 8*
Sto4.
ua3
opl0
0
<0
00-U-I- 1CV V x C. V V on 0
-rH N
W)*
0
Li V Vz
Jy-V V V V to co SN . ,I CN
Ti versus Toroidal Field
Page 34 0 0 0 0 0 .0 0
fn
CD 0 CD LUJm
0N N 0 V 0 0 to0
(AaX) I -T --- I - --F--I I 1. I Figure 1.6Chapter II Theory of Neutron Spectroscopy
2.1 Neutron Producing Reactions in Tokamaks
An important result of a neutron spectrum measurement is that it is possible to identify the physical process which generated the
neutrons from an analysis of the energy spectrum. While neutrons produced from D-D thermonuclear reactions are of primary interest, neutrons produced from non-thermonuclear origins may also be produced under certain plasma conditions. The purpose of this section is to identify the processes and indicate how they might affect the neutron spectrum. Five processes are known sources of neutrons in a Alcator C deuterium plasma discharge.
1. Photodisintegration of molybdenum occurs when supra-thermal electrons strike the limiter. The electrons produce photons which react in the limiter by the reaction 97Mo(y,n)96Mo.
This reaction, has a threshold energy of 6.8 MeV and electrons of at least that energy are required to produce neutrons from this reaction. Such supra-thermal electrons can be produced if the local electric field strength exceeds a critical value, Ec. Above this critical electric field the drag forces on the electron are less than the
accelerating force of the electric field and the energy of the electron can increase until relativistic energies are
Page 36
reached or until it is lost from the plasma. Knoefpel and Spong [2.1] have written a review paper on the subject of how plasma parameters affect the production and equilibrium
levels of these so called "run away electrons". They have suggested a number of scaling rules which are helpful in determining when a discharge will exhibit a run away electron dominated behavior. For tokamaks, the streaming parameter,
ue E 1/2
= - = I - (2.1)
vth Ec
where vth is the electron thermal velocity and ue is the electron drift velocity is often used. The drift velocity may be written as
ue = j/ene (2.2)
where the local values of the current density j and the electron density are used and e is the unit electric charge. For a typical high density discharge studied here, (ne 2x10²⁰ m~3, BT=8.25 T Te =1 keV) E = 0.06. Such a
discharge has been observed to have little evidence of run away electrons during the steady state portion of the
discharge if the initial gas density is high enough to avoid run away formation during the early stages of the discharge. Pappas et al. [2.2] studied the production of photoneutrons during the startup phase of Alcator C. Their measurements were done for hydrogen discharges so that deuterium related
sources (discussed below) would not interfere with the measurement. They found that the level of photoneutrons
produced at the limiter was 4 orders of magnitude below the expected D-D neutron production rates for similar deuterium plasma conditions. However, he also noted that if the gas programming were such that there was a low initial density then the photoneutron production could be as high as 1010 sec-1. This is the same order of magnitude as the
expected D-D rate. This same effect has been observed in the measurements done here. The mean energy of the neutrons
produced from photoneutron reactions is given by 1/4(Ep-Eth' [2.31, where E is the photon energy and Eth the threshold energy. Figure 2.1 shows the expected spectrum for the 97Mo(y,n)9GMo reaction for a 10 MeV beam of electrons. The maximum neutron energy occurs at the maximum photon
energy (10 MeV) minus the threshold energy.
2. Photodisintegration of deuterium is another process which occurs at the limiter. Deuterium sorbed on the limiter, produces neutrons by the reaction D(y,n)H . Again the
source of the photons is the supra-thermal electrons striking the limiter. The threshold for this reaction is 2.2 MeV. It is difficult to estimate the level of photodisintegration because it depends critically on the geometry. However, as an example, the level of neutron production has been
calculated for a 10 MeV beam striking a limiter with 10 monolayers of deuterium sorbed on it. The rate was found to
Page 38
be the same order of magnitude as was predicted for the
97Mo(y,n)96Mo reaction. The neutron spectrum expected for
a 10 MeV beam of electrons is shown in Fig. 2.1. Note that the neutron energies extend to energies greater than the neutrons from the 97Mo(y,n)96Mo process. This is due to the smaller threshold energy of the D(y,n)H reaction.
3. Electrodisintegration of deuterium is a volume process. The reaction is D(e,e',n)H. Again the reaction threshold energy is 2.2 MeV and the spectrum would be expected to be similar to the spectrum for photodisintegration of deuterium.
4. Thermonuclear fusion of deuterium is the process of interest here. The reaction D(D,n)3He produces a neutron with an
energy of 3/4(Q+Erel) where Q is a positive reaction energy of 3.27 MeV and Erel is the initial kinetic energy of the D-D pair. The details of the spectrum shape will be discussed later. The spectrum shown in Fig. 2.1 is expected for a typical Alcator C plasma. These neutrons can also scatter in the machine structure producing a continuum of neutron
energies below the peak.
5. Fusion of deuterium and tritium can produce a spectrum of neutron energies about 14.7 MeV. Tritium is produced in the D(d,p)T with a probability equal to the production of D-D neutrons. These neutrons would be expected to cause a background of neutrons above the D-D peak due to
[2.43 has measured the D-T rate to D-D rate ratio for PLT and found it to be between 10-3 and 10-4. An attempt will be made to estimate the ratio of the D-D rate to the D-T rate in Chapter V.
Figure 2.1 shows how each of the processes might affect a neutron spectrum. This figure can be compared to the spectrum measured by Strachan and Jassby [1.16] who used a 3He ionization of the same design as used here to measure the neutron spectrum for ohmic discharges at the Princton Large Torus (PLT). Their results,
reproduced in Fig. 2.2, were obtained at a plasma density roughly an order of magnitude lower than that used here, a factor which means that non-thermonuclear processes would be much more important. As will be seen later, thermonuclear D-D reactions dominated the neutron
spectra measured here.
2.2 Total Neutron Measurements
If the conditions are such that the neutron production is primarily due to the D(D,n)3He and one knows the energy of the reactants and the cross section of the D-D reaction then one can calculate the neutron production rate. Conversely, if the neutron production rate is known from a measurement then one can guess at reactant distributions which combined with the cross section would yield the measured neutron rate. The thermonuclear neutron rate is
Page 40
R = n2fff(V) f(V2) IvrelI 0(vrel) dij dV2 (2.3)
where n is the deuterium density, f(V1),f(V 2) are the distribution functions of the reacting D-D pair, vrel is the relative velocity,
1V1- 21, and O(vrel) the nuclear cross section.
The cross section for D-D has not been measured below relative energies of 7.5 keV and must be extrapolated to relative energies of importance here. Fortunately, the cross section for two charged particles is well modeled in this region and can be described by the Gamow equation A(Erel) (E(EreErel exp(-b//Erel ) Erel z1z2e2 b - /2pcz (2.4) hc
zle,z2e are the nuclei charges, and p is the reduced mass. A(Erel) is a slowly varying function of the relative energy
Erel-Several measurements of the low energy D-D cross sections (both branches) were made during the late 1940's and 1950's [2.5-2.10]. One measurement was reported on the proton branch in 1966 [2.11] All data was obtained by accelerating deuterium into stationary targets with a minimum beam energy of 13.1 keV for the neutron branch and 4 kev for the proton branch. The accuracy of these measurements ranges about 5 to 55%. Several authors have suggested fits for the neutron branch data [2.12-2.17] The calculated values for these fits are compared in table 2.1 and may be compared with the experimental values in table
2.2. For 1 keV plasmas the largest fraction of the neutron production results from reactions with equivalent laboratory energies of 6 kev.
In that range discrepancies on the order of a factor of two exist in the fits to the cross sections. The authors who were concerned with the low energy limit [2.16,2.17] used the cross section model above to guide their fit in the low energy region. They agree with each other well but have a 20% discrepancy at the first measured value. Thus the fits in this region should be considered to have an uncertainty of 20%.
2.3 Reactivity calculations
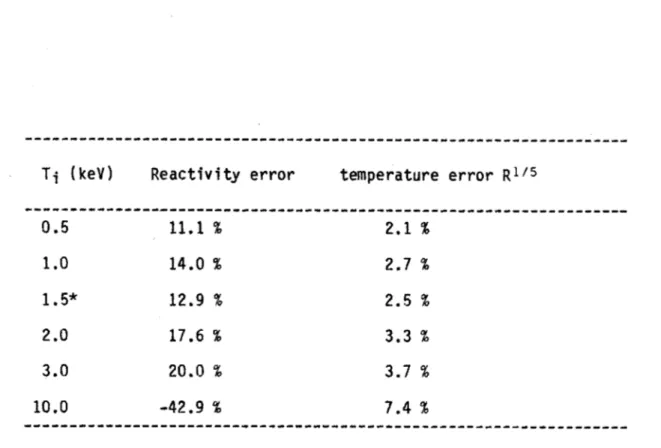
Of more use to plasma physics is the reactivity, <av>, which is just the integral in Eqn. 2.3 for a maxwellian ion energy distribution. Table 2.3 summarizes the reactivities computed by various authors [2.14-2.19]. Table 2.4 shows the discrepancy between the cross section values of Greene [2.17] (who was concerned with the low energy range) and the values in the plasma formulary [2.18] table which appear to be based on Thompson's cross section form. The fifth root of this discrepapancy is also computed as an approximation to the uncertainty in the temperature. While there are large uncertainties in reactivity, the corresponding uncertainty in the ion temperature is much smaller because the reactivity is such a strong function of the ion temperature. In the low energy range the uncertainty in the ion temperature due to the cross section uncertainty is at least 5% and
Page 42
While this uncertainty seems large, there are also large
uncertainties in the rate measurements themselves. Uncertainties in the effect of neutron scattering and absorption in the machine
structure, detector efficiency, and plasma volume corrections, all combine to make even the most careful rate measurements accurate only
to a 40% level or 7% on the temperature. More often the uncertainty in the rate is on the order of 100% and in temperature, 14%, for ion temperatures around 1 keV. Because relative temperature measurements are not subject to most of the large uncertainties above, relative temperature changes can be determined to a possible error of 5% due primarily to profile uncertainties. The formula given in the plasma formulary [2.18], multiplied by 0.5 to give the neutron rate,
R = 1.67x10~4 T.2/3 exp(-18.6Ti-1/3) cm3/sec (2.5)
where Tiis the ion temperature in keV, appears to be a good
approximation to the rate. For relative rate measurements near 1 keV, T5'3 is a useful approximation to Eqn. 2.5.
2.4 Neutron Energy Spectrum Derivation
The neutron spectrum contains more information than the total neutron yield. The integral over the neutron energy of the neutron spectrum would reduce to the total yield. However, the width, like the relative neutron rate, is only dependent on the rate of change of the slope of cross section and not on the absolute magnitude of the cross section. Further, the shape of the spectrum can yield important information on the nature of the ion energy distribution. The rest of
this chapter will be concerned with how one calculates the neutron spectrum from a given ion distribution. In Section 2.4.2 it will be shown that it is possible to obtain the ion distribution from the neutron spectrum under special conditions. The uncertainty of the measurement is confined to the uncertainty in the measurement of the width and in the calculation of the width from the temperature. The latter does depend as strongly on the ion energy distribution as does the total yield calculation. In the case of the energy spectrum measurement the shape of the spectrum can be used as a check while in
the case of the total rate measurements no such check is possible.
A general form for the neutron spectrum can be obtained by
applying the condition that the neutron have an energy 3/4(Q+Erel) in the center of mass coordinate system to Eqn. 2.3. At this point it is useful to envision the process of determining the laboratory energy as a two step process. First, the probability that a reaction occurs is determined by the relative energy of the D-D pair in the center of mass system of the pair. The energy of the neutron in this coordinate system is now constrained by kinematics to be 3/4(Q+Erel)- Second, the energy, or more correctly the velocity of the neutron in this center of mass coordinate system must be transformed to the laboratory system. To do so the velocity of the center of mass of the D-D pair is added to the velocity of the neutron in the center of mass
coordinate system. This process must then be repeated for each possible D-D pair. For each D-D reaction there is a single neutron
Page 44
energy in the center of mass system. In the laboratory system this single energy can take on a continuum of values dependent on the angle between the center of mass velocity vector and the velocity vector of the neutron in the center of mass system. Thus, one has a doppler broadened single energy line. While the procedure is straight forward in obtaining the neutron spectrum from the ion energy distributions the reverse is not uniquely possible. This is simply because the neutron energy is a function of a pair of ion energies, the energies of each of the reacting deuterons. If both of the deuterons are
allowed to have any energy then it would never be possible to obtain their individual energies from the resulting neutron energy. Thus the neutron spectrum can only be used to test if the observed spectrum is consistent with an assumed ion distribution. For Alcator C, two
particular cases of ion distributions are of interest, bulk-bulk interactions and tail-bulk interactions.
2.4.1 Bulk on Bulk Interactions
A bulk-bulk interaction is defined to be an interaction in which a particular ion distribution interacts with itself. The three
dimensional Maxwellian produced during ohmic heating is an example of a bulk-bulk interaction. To obtain the neutron spectrum due to a bulk-bulk distribution, following the two step procedure above, one
first forms a relative ion distribution from which the reaction probability and the neutron energy in the center of mass is
determined. For the second step, one must assume something about the nature of the original D-D pair velocity distribution and the velocity
distribution of the emitted neutrons in the center of mass coordinate system. The angular distribution of the emitted neutrons is known to be anisotropic even at low energy. Data from the cross section
measurements earlier F2.6] indicate that distribution of the neutron emission angle is given by
n(G) = n(0)[ 1+ B(Ebeam)COs2(a)] (2.6)
where B(E)= 0.31 + .0058 Ebeam, 6 is the angle of emission in the laboratory coordinate system and Ebeam is the energy of the
deuteron beam. This effect is not normally important because the ion distribution is isotropic for a Maxwellian plasma which implies that the neutron emission in the laboratory frame is also isotropic. This would not be true if the plasma species were polarized as suggested by Kulsrud [2.20] or if the plasma were heated by a deuteriu ion beam which would give the nuclei a preferred orientation. Data is not available on the angular distribution of the emitted neutrons for a polarized D-D reactions. The latest work is being done by Ad'yasevich
[2.21]. Here, all reactions will be assumed to be unpolarized and isotropic. The results for monoenegetic ion energy distribution discussed later are also applicable to the beam heated case.
Lehner and Pohl [1.1,2.14], Byrsk [2.22], and Williams [2.23] have all computed the neutron spectrum for the three dimensional Maxwellian using different approaches. Lehner and Pohl started with equation 2.3 and added the condition that the neutron in the center of mass coordinate frame has the energy 3/4(Q+Erel). After changing
Page 46
variables to cast the ion distributions in terms of center of mass velocity of the neutron , w, and the relative velocity of the D-D pair vrel, they obtained the relation
d2R n2(2En)1/2 S(W2-2Es/mn)
-/2 fff+f- vrel a(vrelO) dw dvrel
dSdEn (mn)3/2 V2Es/mn
= f( vn - w ± (vrel)/ 2 ) (2.7) where md is the deuteron mass, mn the neutron mass, and En the
energy of the neutron in the laboratory coordinate frame. The delta function selects only combinations of w and vrel which result in an
allowed energy of the neutron in the center of mass coordinate system, Es, which is equal to 1/2mnw2. This relationship is still not a
final form and Lehner and Pohl considered specific cases to reduce it further.
2.4.1.1 The Three dimensional Maxwellian Ion Distribution.
For the three dimensional Maxwellian, they found the general form of the distribution to be dR n2 -2o(v-vo)2 -=- /257/- <cyv> e dEn mdvo vo =/3Q/mn a = (md/2kT) (2.8) :! I
Note that this is just a Gaussian distribution. Lehner and Pohl have numerically evaluated the above equation and found that the full width at half maximum (FWHM) in keV is given by
AE = 82.5/ET (2.9)
where kT is the ion temperature in keV. Brysk r2.22] and Williams [2.23] found essentially equivalent results by different methods. Williams also evaluated the mean energy and found
<En> = + 1.5 mnkT/2md + A[kTb/2]2/'
X = 1-mn/2md (2.10)
In Eqn. 2.8, b is the coefficient in the Ganow form of the cross section
a(E0) -b//Erel
A(Erel) = - e (2.11)
Erel
Thus in principle, an accurate measurement of the mean energy of the neutrons could be used to determine the b coefficient in the cross
section. Unfortunately, the energy calibration was not accurate enough for such a determination here.
Lehner and Pohl evaluated a number of other cases of bulk-bulk interactions including one and two dimensional Maxwellian
distributions. These distributions yield non-sysmetric neutron spectra when viewed from a non-perpendicular direction. Interested readers are referred to Lehner's papers [1.1,2.14] for details. Beam
Page 48
heated plasma spectra have been computed by Scheffel [2.24].
2.4.1.2 The Monoenergetic Ion Distribution
Although physically unrealizable, the three dimensional
monoenergetic distribution is an interesting case because it provides a limit on the shape which the spectrum might take on. The
numerically calculated spectra from Lehner's paper are shown in Fig. 2.3. Note that the spectrum is roughly triangular in shape.
2.4.2 Tail on Bulk Interactions
A tail on bulk interaction is one in which a small portion of the bulk Maxwellian temperature distribution has a higher temperature as illustrated in Fig. 2.4. In this figure the tail is cut-off. Such a cut-off might occur in a plasma because high energy ions would not be confined to the plasma. While no examples of tail on bulk reactions have been observed at Alcator C to date, a high energy tail
interacting on the bulk plasma distribution was observed during the Alcator A Lower Hybrid Heating experiment [2.25].
As a neutron production mechanism such a tail can be important for particular tail temperatures and densities because the majority of neutrons result from the tail on bulk interactions. Such a condition can be obtained by examining the form of the rate equation
dR
-- - n1n2 <av> (2.12)
where ni is the bulk density and n2 the tail density, and where nl>>n2. The nin2 term dominates over the n12 term because the value of the cross section is much larger for the tail on bulk reactions. Table 2.5 illustrates such a case where n>>n2 and the n2
distribution is represented by ions all at the same energy, and the energy is much greater than the bulk temperature express in the same
energy units. Note that the tail on bulk reactions dominate.
In this approximation of only tail-bulk interactions, the tail ion energy distribution function, can be made up of a sum of
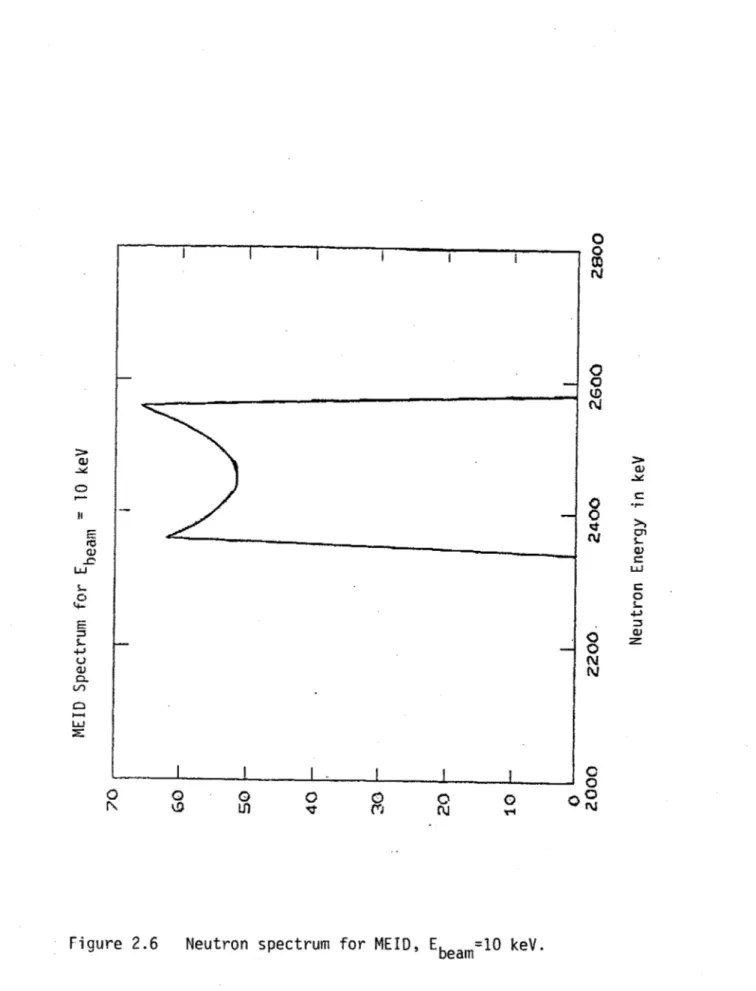
monoenergetic isotropic distributions (MEID) interacting with the bulk. This is a very useful simplification because the MEID interacting with the bulk is a very simple spectrum to calculate because the energy of the ion in the ni distribution can be ignored since the energy of the ni bulk ion is much less than the energy of the tail ion. This is just the case of a projectile interacting on a stationary target. It is useful to derive the neutron spectrum for this case because the D-D neutron reaction Q value is much larger than
the relative energy of the reacting D-D pair and a much simpler relationship than Eqn. 2.5 can be obtained. Further, the equations can be programmed in a straight forward manner in a computer program where the target velocity effects can be included.
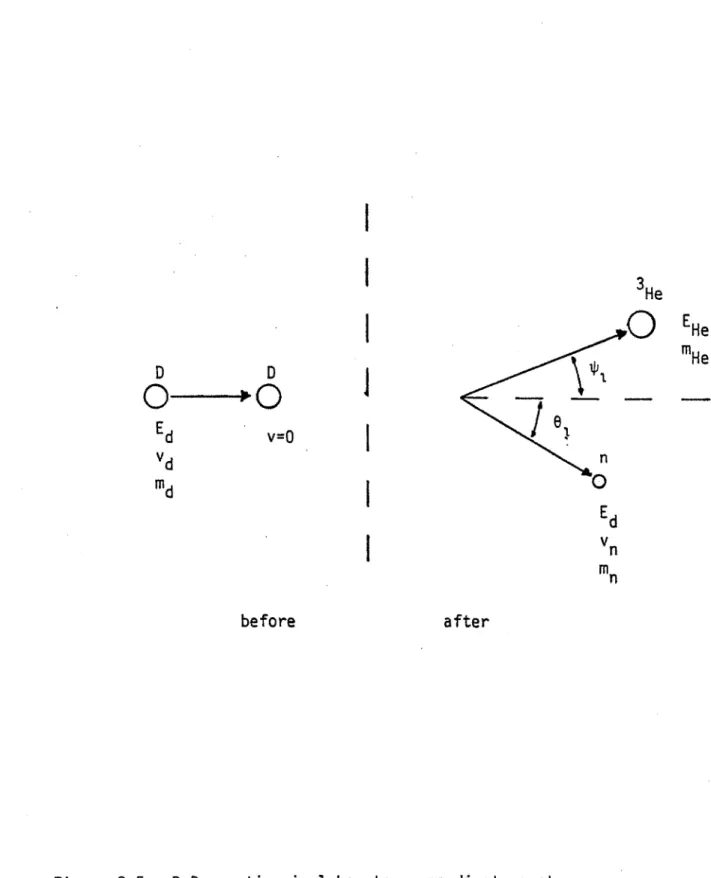
Consider the system shown in Fig. 2.5 for the reaction
D(D,n)3He. In the laboratory coordinate frame shown a stationary deuteron is struck by a deuteron with energy Ed=Ebeam and velocity vd. After the reaction, the neutron emerges with an energy En and
Page 50
velocity vn at an angle 01. The 3He nucleus with mass mHe,
has an energy EHe, and angle 'P. The total energy before the
reaction must be equal to the energy after the reaction minus the the
Q value or Ed=En + EHe - Q- Using conservation of momentum to
substitute for EHe one obtains
Q = En(l + mn/mHe) - Ed(l - md/mHe) - 2[MdEdmnEn] /2cose (2.13)
Solving for En in Eqn. 2.13,
En = ( u +FuZ + w )2 mHeQ + Ed(mHe-md) mHe+mn V mdmn Ed U e
cos
s mHe +Mfn (2.14)Since Q>>ED for cases simplified by keeping
mHe
En - Q ( 1
mn+mHe
of interest here, the above equation can be only terms which involve Q or Q1
/2 and (mlmn Ed + 2 cose) [mHe(mn+mHe)]
Q
(2.15) The derivative dEn mHe Ed mdmn - =-2 do mn+mHe mHe(mn+mHe) sine (2.16)will be of use later. The probability that a neutron will be emitted at an angle e is
a(vrel 6)
P(O) do = 2nsino - do (2.17)
G(vvel)
where c(vrel,6l) is the differential cross section and a(vrel) the total cross section. Again, because Q>>El, the
laboratory angle of neutron emission has been set equal to the center of mass emission angle. The correction factor for this is given in Profio [2.261. For a 10 keV ion incident on a stationary target the correction varies from 0.956 to 1.05 and tends to increase values in the 0 degree laboratory angle and decrease values for the 180 degree angle. Using the cross section relation [2.6], and B as in Eqn. 2.4,
a(vrel,O) 1 + B(vrel) cos20
- (2.18)
O(vrel) 4ir(1 + B(vrel) )
and noting that the probability of a neutron at energy En is do
P(En) = P(6) I --- 1 (2.19)
dEn
and using Eqns. 2.15, 2.16, 2.17
1 + B(vrel) cos26
2D(1 + B(vrel)) 2mHe ____
D = 2me/dmnEdQ (2.20).