Carbon Nanotube Electrodes for Capacitive
Deionization
ASSA SETINSTM EOF TECHNOLOGY
by
NOV J
2213
Heena K. Mutha
UBRARIES
Submitted to the Department of Mechanical Engineering
in partial fulfillment of the requirements for the degree of
Master of Science in Mechanical Engineering
at the
MASSACHUSETTS INSTITUTE OF TECHNOLOGY
September 2013
@
Massachusetts Institute of Technology 2013. All rights reserved.
A uthor ...
...
...
Department of Mechanical Engineering
August 20, 2013
Certified by... ...
,..
.
.
Evelyn N. Wang
Associate Professor
Thesis Supervisor
Accepted by...
1wDavid E. Hardt
Chairman, Department Committee on Graduate Theses
Carbon Nanotube Electrodes for Capacitive Deionization
by
Heena K. Mutha
Submitted to the Department of Mechanical Engineering on August 20, 2013, in partial fulfillment of the
requirements for the degree of
Master of Science in Mechanical Engineering
Abstract
Capacitive deionization (CDI) is a desalination method where voltage is applied across high surface area carbon, adsorbing salt ions and removing them from the water stream. CDI has the potential to be more efficient than existing desalination tech-nologies for brackish water, and more portable due to its low power requirements. In order to optimize salt adsorption in CDI, we need a better understanding of salt adsorption and the electrode properties involved in ion removal. Current materials are highly porous, with tortuous geometeries, overlapping double layers, and sub-nanometer diameters. In this work, we design ordered-geometry, vertically-aligned carbon nanotube electrodes. The CNTs in this study have 2-3 walls, inner diameter of 5.6 nm and outer diameter of 7.7 nm. The capacitance and charging dynamics were investigated using three-electrode cell testing in sodium chloride solution. We found that the material capacitance was 20-40 F/g and the charging time varies lin-early with CNT height. The data was matched with the Gouy-Chapman-Stern model indicating that porous effects were negligible. Charging rates of CNTs compared to microporous activated carbon fiber, show that CNTs are more efficient at charging
by weight. However, densification and surface functionalization will be necessary
to enhance CNT performance by planar area. Future work will involve investigating electrodes in a flow-through cell to use salt adsorption data to determine the influence on electrode thickness on salt adsorption in channel flow.
Thesis Supervisor: Evelyn N. Wang Title: Associate Professor
Acknowledgments
I would like to thank Professor Evelyn Wang for her guidance and encouraging support during this research study. I would also like to thank Jeremy Cho for discussing experimental set up, reviewing my thesis, and supporting me throughout this project. I would like to acknowledge Dr. Robert Mitchell and Professor Carl Thompson for the development of the carbon nanotube growth and use of instrumentation; Professor Gang Chen and Dr. Yuan Yang for use of their impedance analyzer; and Dr. Betar Gallant for her insights on the electrochemical work. I would also like to acknowledge Device Research Laboratory members and alumni Dr. Ryan Enright, Tom Humplik, and Dr. Nenad Miljkovic for their guidance regarding characterization of carbon nanotubes. Finally, I would like to wholeheartedly thank my family and friends for their support and love throughout this project.
I would like to thank the King Fahd University of Petroleum and Minerals in Dhahran, Saudi Arabia, for funding the research reported in this paper through the
Center for Clean Water and Clean Energy at MIT and KFUPM. In addition, this material is based upon work supported by the National Science Foundation Graduate Research Fellowship under Grant No. 1122374.
Contents
1 Introduction
1.1 M otivation . . . .
1.1.1 Multi-Stage Flash Desalination . . . . 1.1.2 Reverse Osmosis . . . .
1.1.3 Electrodialysis . . . . 1.1.4 Capacitive Deionization . . . .
1.2 Background . . . . 1.2.1 History . . . . 1.2.2 Carbon Materials in Supercapacitors . . . 1.3 Carbon Materials for CDI . . . . 1.4 Electric Double Layer Theory . . . .
1.5 Thesis Outline . . . . 2 Synthesis of Electrode and Preliminary Testing
2.1 CNT growth and characterization . . . .
2.2 Au-Au Self-Diffusion Bond . . . .
2.3 Electrochemical Characterization . . . .
2.3.1 Cell Set Up . . . .
2.3.2 Experiment: Cyclic Voltammetry (CV) . .
2.3.3 Experiment: Potentiostatic Testing . . . .
2.4 Experimental Results and Discussion . . . .
13 14 14 15 16 16 . . . . 18 .... ... 18 . . . . 20 . . . . 22 . . . . 25 . . . . 34 36 . . . . 37 . . . . 40 . . . . 41 . . . . 41 . . . . 43 . . . . 45 . . . . 46
3 CNT Electrode Design
3.1 Bonding Methods ...
3.1.1 Optimizing Au-Au Diffusion Bond.
3.1.2 Au ...
3.1.3 Conductive Tape ... 3.1.4 Au-Sn Bond ...
3.1.5 Conductive Epoxy ...
3.1.6 Summary ...
3.2 Contact Resistance Measurement
3.2.1 Impedance Spectroscopy
3.2.2 Results and Discussion . . . 3.3 Corrosion Resistance of Electrodes 3.4 Summary . . . .
4 Characterization of CNT Electrodes in NaCl Solutions 4.1 Experiment: Capacitance of CNT electrodes . . . . 4.1.1 Experimental Setup . . . . 4.1.2 Results and Discussion . . . . 4.2 Role of Counter Electrode in Setup . . . . 4.3 Charging Dynamics of Electrodes . . . . 4.3.1 Experimental Setup . . . . 4.3.2 Results and Discussion . . . . 4.4 Conclusions . . . .
5 Conclusions and Future Work 5.1 Future Work . . . . 5.1.1 Increase Capacitance . . . 5.1.2 Further Parameterization . 5.1.3 Flow Cell . . . . 50 50 . . . . 50 . . . . 56 . . . . 56 . . . . 57 . . . . 57 . . . . 58 . . . . 58 . . . . 59 . ... 60 . . . . 62 . . . . 63 64 . . . . . 64 . . . . . 65 . . . . . 66 . . . . . 69 . . . . . 71 . . . . . 71 . . . . . 71 . . . . . 75 77 78 78 78 79
A CNT Synthesis 86
A.1 System Setup ... ... 86
A.2 Safety ... 87
A.3 Sample Preparation ... ... 87
A.4 Tube Preparation . . . . 87
A .4.1 Growth . . . . 88
List of Figures
1-1 Multi-Stage flash system. Seawater enters low pressure chambers, is flashed and the vapor is collected to produce freshwater. Adapted from
[1]. . . . . 15
1-2 Reverse osmosis system. High pressure water flows across a semi-permeable membrane rejecting salt ions. Adapted from [1]. . . . . 16 1-3 Electrodialysis. An electric field is applied across ion-selective
mem-branes, seperating anion and cations from freshwater. Adapted from [1]. . . . . 17
1-4 Capacitive deionization process. a) Water enters cell, b) Potential is applied, ions adsorbed, desalinated water purged through, c) Voltage
is removed and cycle is refreshed. . . . . 18 1-5 Test prototype developed by Welgemoed and Schutte [2]. This is 1/4 0th
the size of an actual stack. Scale bar: 300 mm. . . . . 20
1-6 Ion confined in carbon structure (blue). Anion (red) density is higher at positively charged surface. Figure adapted from [3]. . . . . 22
1-7 Carbon materials used in CDI. a) carbon nanotubes (inset: TEM im-age, scale bar: 100 nm), b) activated carbon cloth (inset: TEM imim-age, scale bar: 250 nm), c) carbon aerogel matrix, d) ordered mesoporous carbons (inset: TEM, scale bar: 100 nm). Figure adapted from [1]. . 23 1-8 Ion distribution at a charged surface. 00 = 10 mV, c, = 10 mM . . . 28
1-9 The double layer is divided into 3 parts: the Stern (or compact) layer, the diffus layer described by Gouy-Chapman, and the bulk solution. . 29
1-10 The diffuse layer charge given by Poisson-Boltzmann (PB), modified
PB (mPB) and compact double layer theory (CDL). mPB and CDL show that charge asymptotes at higher potentials, rather than infinitely increasing as with PB. Adapted from [4]. . . . . 32 1-11 The diffuse layer charge given by the modified Poisson-Boltzmann
(MPB), over time. Variables: e = , = 2a'c_,. As double layer
thickness and/or steric effects increase, the weakly nonlinear approxi-mation no longer holds. Adapted from [5]. . . . . 33
2-1 Parameters for electrode material. The electrode should have a tunable height, H and diameter, D. It should also be highly conductive. . 36
2-2 CVD growth of VACNTs. a) Growth substrate is prepared with
alum-nia and iron, b) substrate is placed in furnace in He/H 2 environment
at elevated temperature, c) VACNTs grown on catalyst with ethylene. 38
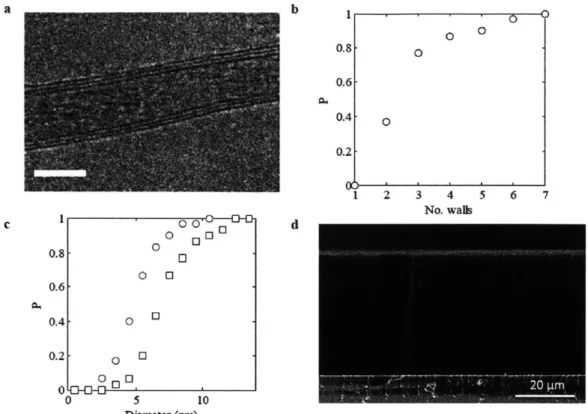
2-3 Characterization of CNTs. (a) TEM of CVD grown VACNT, Scale
bar: 5 nm. (b) Cumulative distribution of CNT wall number. (c) Cumulative distribution of the CNT inner (circle) and outer (square) diameters. (d) SEM of CNT carpet. Figure adapted from [6]. .... 39
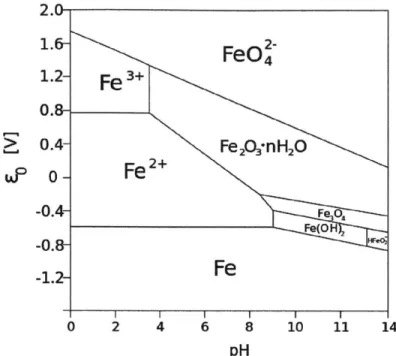
2-4 Pourbaix diagram of iron in water. In CDI operating conditions, with applied electrode potentials 0-1 V vs. SHE and solution pH between
5-7, iron corrodes forming rust, Fe203. Figure from [7] . . . . 40
2-5 Gold-gold diffusion bond process. a) Process steps for transfer of CNTs, b) Temperature profile in furnace, c) CNT electrode on gold substrate. Figure from [6]. . . . . 42
2-6 Three electrode cell set up. a) Beaker schematic, b) potentiostat schematic adapted from [8]. The potential, VWE is monitored be-tween the reference (RE) and working electrode (WE), while current flows between the working and counter electrode (CE). WE-CNTs,
2-7 Potential profile across an electrochemical cell. The potential drops at the EDL of the working electrode, measured by the potential between the reference and working electrode. There is negligible potential drop in the solution, and then an additional potential drop at the EDL of the counter electrode. . . . . 44
2-8 CV scan schematic of electrode materials . . . . 45
2-9 Potentiostatic testing: current response to a held potential value . . . 46 2-10 CV scan of CNT carpet, height 21 Mm. Electrode, tested in varying
solutions of NaCl, did not exhibit Faradaic peaks. v = 30 mV/s. . . . 47 2-11 Potentiostatically-measured capacitance normalized by electrode plane
area for (a) 20 mM, (b) 50 mM, (c) 70 mM and (d) 90 mM. The red circle, green triangle and blue square symbols correspond to step po-tentials of 100 mV, 200 mV and 300 mV above the OCV, respectively.
Figure from [6]. . . . . 48 2-12 FIB cross section of transferred CNT carpet. The clean, tubular
ge-ometry of the CNTs is not maintained during the diffusion-bonding process. ... ... 49
3-1 Critical force to induce first-order buckling of column . . . . 51 3-2 CNT slipping. a) Yap et al. [9] showed the deformation of CNTs under
uniaxial compression. b) Our SEM of transferred CNTs exhibiting buckling similar to step 6. . . . . 52 3-3 CNT carpet does not show buckling under small applied torque . . . 52
3-4 CNT transfer at various temperatures. There is 100% transfer at 540*C
and 270 'C. Carpet looks more aligned at 270 *C. 30 N-cm torque was applied. . . . . 53
3-5 The bending of the plate under a load from the bolt. The 1/8" plates bend upto 50 tim, damaging the carpet. Doubling the plate thickness reduces the deflection, 6, to less than 1 micron. . . . . 54
3-6 Successful transfer of CNTs using gold diffusion bond. T=270*C, torque=30 N-cm. . . . . 55 3-7 Gold-gold bond. High temperature melted the gold, forming a weak
bond. Scale bar: 1cm . . . . 56 3-8 Delaminated carpet taped with copper tape to substrate. Scale bar: 1cm 56 3-9 AuSn bonding process. Similar to Au-Au bonding, except with an
additional piece of tin foil . . . . 57 3-10 Epoxying CNT carpet to substrate. Nickel and Silver epoxies were
studied. . . . . 57 3-11 Transfer methods that were successful: gold diffusion bonding, epoxy
methods, and gold-tin bonding . . . . 58 3-12 RC circuit model of a 3-electrode cell. a) Circuit model, b) Impedance
plot for circuit . . . . 59 3-13 Impedance testing results. Model fitting is shown with lines. . . . . . 60
3-14 Contact resistance for bonding methods. Error bars depict the varia-tion in calculavaria-tion from the model fitting. . . . . 61 3-15 CV scan for different bonding methods. 20 mM NaCl, sweep rate: 15
m V /s. . . . . 62
4-1 Specific charge of CNT electrodes. a) CNT height 5 pm, b) CNT height 22 pm, c) CNT height 52 pm. . . . . 65
4-2 Specific charge as a function of height in 5 and 20 mM NaCl solutions. Electrode applied potential was 300 mV. Error bars arise from variation in the calculation of charge. . . . . 67
4-3 Fitting GCS model to charge data. a) GCS fit with am = 540 m2/g,
b) GCS fit with am = 320 m2/g. CNT heights:
El
= 5,Q
= 22, andA = 52 ym. Specific capacitance is 7-8 F/g and CST = 3-6 /LF/cm2. . 6 8
4-4 CV scans of various counter electrodes in 20 mM NaCl. Counter
elec-trodes: a) Y-Carbon cloth, b) Pt mesh, c) CNT, d) Pt foil. WE: CNT electrode and RE: Ag/AgCl electrode. . . . . 70
4-5 Current response due to a potential step VWE = 250 mV in 125 mM
NaCl solution . . . . 72
4-6 Mean capacitance of CNT electrodes. Samples were tested in NaCl solution. . . . . 73
4-7 Charging time constant for CNTs for varying a) carpet heights and b) NaCl solution concentrations. . . . . 74 4-8 Optimizing capacitance and charging time constant. a) Capacitance
per planar electrode area divided by time constant, b) Capacitance per mass divided by time constant. Data collected in 125 mM NaCl solution. ACF data from [64]. . . . . 75 A-1 Set up of CNT samples in double growth furnace . . . . 89
List of Tables
2.1 CVD growth parameters for chapter 2 experiments . . . . 38 3.1 Appled torque on jig translated to axial force . . . . 51 3.2 Experiment summary for transfer methods . . . . 63
Chapter 1
Introduction
Over 1.2 billion people lack access to potable freshwater, and an additional 2.6 billion people have little or no sanitation for their water [10]. Twenty-six countries do not have an adequate supply of safe drinking water for its people [1]. Industrial over-consumption of water is leading to overdrawn and contaminated aquifers, creating saltwater intrusion into the already limited potable water supply. It is predicted that in the next 30 years as global climates warm, glaciers in the Himalayas will recede, severely limiting access to drinking water for an additional 1.5 billion people in In-dia, China, and Southeast Asia [10]. Domestically, while the US has had a steady consumption of water in recent decades, a growing concern for droughts and urban population growth has resulted in efforts to increase our freshwater supply [11]. 98% of the world's water is in the form of brackish and seawater, defined as having
1,000-35,000 ppm salt (concentrations of 10-600 mM NaCl) respectively. Desalination is
one method to increase our fresh water supply, generate access for all and develop water security.
In this chapter, we outline existing desalination technologies, assessing their ben-efits and shortcomings for energy-efficient and clean desalination. We consider capac-itive deionization, a newer technique for desalination, reviewing the research that has been done and the opportunities to develop and optimize this technology.
1.1
Motivation
Desalination generates over 37 million cubic meters of potable water per day world-wide [11]. In order to serve populations that need potable water, its important to keep the costs of water desalination low. This can be achieved by minimizing the en-ergy consumed and the pretreatment required for production of drinking water. The minimum energy required to desalinate arises from reversing the Gibbs free energy of mixing salt and water, which is approximately 1.1 kWh/m3 for seawater and 0.1 kWh/M3 for brackish water. If the efficiency of a theoretical system (actual energy consumed compared to the minimum) is even 50%, the system will consume 2.2 kWh for every m3
seawater desalinated. Assuming a per capita consumption of water is 50 liters, then the per capita energy consumption is only 0.25 kWh. This is only a small fraction of energy consumption in many countries (3.2 kWh per capita in China and
30 kWh per capita in the US) [10]. In addition to removing salt, desalination
sys-tems must remove metals, bacteria, and other pollutants found in seawater. This can be done either through the desalination process or through additional pretreatment, which can generate pollution or reduce the efficiency of the plant.
There are three main approaches to desalination technology: phase change, seper-ation mechanisms, and charge-based desalinseper-ation [1]. Within these approaches, the most widely used technologies are multi-stage flash, reverse osmosis, and electrodial-ysis.
1.1.1
Multi-Stage Flash Desalination
Multi-stage flash (MSF) is a phase change method for desalination, comprising 44% of the world's desalination capacity. In MSF systems, seawater enters low pressure chambers, where it is flashed to steam and the vapor is collected seperate from the brine, as shown in Figure 1-1. Pretreatment of water for this type of system is minimal, because the vapor is seperated from the contents in the brine, but this process is very inefficient, consuming 23.9-96 kWh/m 3 [1].
Multi Stage Flash Steam inSewtrI
Distill te out
Figure 1-1: Multi-Stage flash system. Seawater enters low pressure chambers, is flashed and the vapor is collected to produce freshwater. Adapted from [1].
1.1.2
Reverse Osmosis
A less energy intensive method for desalination is reverse osmosis (RO), making up
41% of the world's desalination capacity, but 80% of the number of installed plants. RO is a seperation method, where high pressure water flows across a semi-permeable membrane which allows water to pass through but sterically excludes solvated salt ions, as shown in Figure 1-2. In RO, the energy consumed for desalination is pro-portional to the salt concentration, minimally requiring enough energy to reverse the Gibbs energy of mixing. RO is much more efficient than MSF, consuming an average of 3.6-5.7 kWh/m 3 for brackish to seawater, respectively, operating at 20-30% effi-ciency [1]. The best reported RO membrane, desalinating seawater, consumes 1.58 kWh/M3 with 42% efficiency [10]. However, RO has many challenges: there is bio-fouling and scaling of the membranes, flow rates are limited due to concentration polarization at membranes, and there are challenges with the membrane in rejecting salt ions at high feed concentrations [10, 1, 12]. In order to prevent fouling of mem-branes, the feedwater undergoes intense pretreatment which can be energy-consuming and additionally contaminate water [101.
Reverse Osmosms
Seawa Il H
~
sh water
out """"""""""Sri
Figure 1-2: Reverse osmosis system. High pressure water flows across a semi-permeable membrane rejecting salt ions. Adapted from [1].
1.1.3
Electrodialysis
Desalination can be challenging because its very process and energy intensive. Charge-based methods for desalination could reduce some of these demands, requiring little pretreatment. Currently, charge-based methods such as electrodialysis comprise 6.1% of the world's desalination capacity. Electrodialysis is a method where electric fields are applied across membranes, driving salt ions to migrate across ion-exchange mem-branes, and desalinating the bulk stream, see Figure 1-8. This method reduces effects from scaling and concentration polarization through the applied electric field and mixing [1]. However, pretreatment is required to prevent fouling of the membranes.
1.1.4
Capacitive Deionization
Capacitive deionization (CDI), as shown in 1-5 is an emerging charge-based desalina-tion method. In CDI, a potential is applied across high-surface area electrodes. This polarizes the electrode, causing salt ions to adsorb on the surface, and the charge is stored in the electric double layer (EDL). The electric double layer will be
de-Feed Water
Cation selective
j
Anion selectivemembrane membrane
=-P'Fresh Water
+Concentrate
Figure 1-3: Electrodialysis. An electric field is applied across ion-selective membranes, seperating anion and cations from freshwater. Adapted from [1].
scribe in detail in section 1.4. The bulk, desalinated water is purged through, and the potential is removed regenerating the cycle. Generally, the flow of water is past these porous electrodes, though research has also examined the development of flow-through electrodes [13] or by dipping/removing anode-cathode wires into a stagnant solution [14].
The main difference between electrodialysis and CDI is that the former is a flow-through continuous process whereas the latter is a charge-discharge process. CDI is advantageous over electrodialysis because it does not require membranes and can remove charged molecules of higher molecular weights, such as bacteria. This can significantly reduce the amount of pretreatment necessary. Because it requires lower pressure than RO, CDI can be more efficient (reported efficiencies are as high as
75-90% [15]) in brackish water regimes and more portable. The potential required for
operation is minimal, usually less than 1.23 V to prevent electrolysis. It has been demonstrated that this energy could be provided sustainably by microbes, similar in concept to a microbial fuel cell [16].
a) b) re--- --- C)
Figure 1-4: Capacitive deionization process. a) Water enters cell, b) Potential is applied, ions adsorbed, desalinated water purged through, c) Voltage is removed and cycle is refreshed.
In order to optimize CDI, there are many areas of investigation required: an ap-propriate electrode material needs to be designed for the process, the cell needs to be designed for continuous flow processes, and the design for energy recovery needs to be developed [17]. This thesis focuses on the design and optimization of appropri-ate electrode mappropri-aterials for CDI, focusing on the influence of electrode thickness on charging time scales. We will first examine the extensive work done to develop CDI, both in the literature and developing theory.
1.2
Background
1.2.1
History
The study of capacitive deionization (CDI) began in the early 1960s and 70s [18,
19, 20].
In 1961, Arnold and Murphy investigated demineralization, showing that graphite electrodes could remove salt from water through the adsorption of ions onto the electrode surface[18].
Caudle et al. studied demineralization using carbon elec-trodes finding that functionalization of the carbon surface with oxygen can make it more cation and anion responsive[19].
They conducted the first major series of bench-scale testing, finding that in low solution concentrations, NaCl and metals such as Fe (II) and Mn (II) typically found in brackish water, could be removed from feedwater and partially regenerated to prevent electrode fouling[19].
general criteria for CDI systems: the adsorption rate of ions should be fast, the ohmic drop in the material should be minimal, and the applied potential should be large enough for the carbon to behave as an ion exchanger [20]. The experimental work of Johnson and Newman was discontinued due to instablities in the anode [17]. However, they calculated that it would be possible to create low-cost desalination devices, with high surface area materials, estimating that materials with surface areas of 230 m2/cm 3 would be sufficient [20].
In the 1980s, Oren conducted extensive studies of water desalting, using the same principles, under the name of electrochemical parametric pumping. Through his system, Oren et al. studied the influence of potential, electrolyte concentration, and the charging mechanisms in a carbon material with specific surface area of 100
m2/g [21, 22, 23, 24}. Oren also demonstrated that these electrodes could remove
bacteria through electroadsorption [25]. E. Coli has a negatively charged surface
membrane, which is adsorbed onto polarized electrodes. The bacteria can also be desorbed during discharge, reducing fouling of the electrode [25]. These endeavors showed that CDI could desalinate brackish water without the need for additional pretreatment. However, the research was abandoned due to degradation of electrode performance during experimentation.
As high surface area carbon materials were developed in the 1990s, scientists renewed interest in CDI. At Lawerence Livermore National Laboratory (LLNL), re-searchers built a prototypical CDI stack using carbon aerogel as the electrode material
[26, 27, 28, 29, 30]. Carbon aerogels do not require a binder, minimizing resistance in
the material. In addition, aerogels have between 400 and 1100 m2/g specific surface area, promising for full-scale CDI. Richardson et al. estimated, based on labora-tory experiment, that desalinating 1000ppm solution with carbon aerogel would only consume 0.02 kWh//m3 [27].
Welgemoed and Schutte, developed a 1/40th size prototype of a CDI system [2]. At a flow rate of 50 mL/min, they were able to desalinate a feedstream from 1000 pS/cm to 23.4 pS/cm. The energy cost calculated at 0.6 kWh/M3 is much higher than what Richardson predicted [2, 27], due to inefficiencies which may be overcome
Figure 1-5: Test prototype developed by Welgemoed and Schutte [2]. This is 1/4 0th
the size of an actual stack. Scale bar: 300 mm. through energy recovery.
In the past 40 years, it has been demonstrated that CDI can be effective for water desalination. The technology can remove salt, metals, and bacteria. At present, there are a few companies around the world using CDI in industry, with Voltea in the Netherlands the most developed. Materials and design optimization has limited the development of CDI as a more widely used desalination technology. Understanding ion transport and adsorption on high surface area carbon electrodes is instrumental to the optimization of CDI.
1.2.2
Carbon Materials in Supercapacitors
The goal in CDI design is to maximize ion removal from the bulk of the solution. The goal in supercapacitor design is to increase electrical energy storage. These goals are both achieved by increasing the capacity of the double layer. Thus, electrode design in CDI and supercapacitors are similar. As a result, much of the work on material development and modeling for supercapacitors can inform design for CDI.
of 1V, would have an excess charge at the surface of 10 pC/cm2. In terms of ions stored at the surface, this would be equivalent to 1.036 x 10¹⁰ ions/cm2. A material that has a specific surface area of 1000 m2
/g, or a specific capacitance of 10 F/g, would only require 50 g of material to desalinate 1 L of 3000 ppm saline water [17]. This suggests that increasing capacitance of the material and its specific surface area available for ion adsorption, can maximize the salt removal per unit volume of a CDI cell. Extensive research on supercapacitors have studied the enhancement of these material properties.
In the late 1980s, carbon materials were documented as having capacitances be-tween 2 to 60 pIF/cm2 [31], or for materials with specific surface areas of 100 m2/g
that is 2-60 F/g. These materials were tested in a variety of electrolytes, with a variety of testing methods (for more information on testing methods see section 2.3). This variation of testing conditions can lead to a large variation of measured capaci-tance. In recent years, capacities of carbon materials have been documented as high as 100-200 F/g in organic electrolytes and upto 300 F/g in aqueous solutions [32]. Increasing the specific surface area, tuning the porous structure, surface treatment, and functionalization can enhance the capacity of carbon materials tremendously [32]. Adsorption of ions onto electrode materials can be specific and non-specific. Surfaces functionalized with oxygen groups provide sites for protons to ionically bond, leading to higher material capacitance but less cyclability [31].
Pore size can have dramatic effect on capacity. Salt dissolves in water when H20 molecules are attracted to the charge ions and surrounding it, forming a solvation shell. The solvated salt ion typically has diameters of 7-8
A.
It has been previously found that 2-5 nm pores (mesopores) are optimal for using the available surface area of the electrode material [32]. However, sub-nm pores still can contribute to capaci-tance, suggesting that partial ion desolvation can occur [32]. Recent MD simulations show that this desolvation is possible in confined pores, due to charge compensation provided by the electrode surface [3], shown in Figure 1-6.The chemical treatment of the surface can enhance capacitance substantially. Car-bon materials are typically hydrophobic; functionalization can increase wetting for
Figure 1-6: Ion confined in carbon structure (blue). Anion (red) density is higher at positively charged surface. Figure adapted from [3].
better capacity. Oxidation can enhance surface area and wettability, therefore enhanc-ing specific capacitance [33]. In the case of carbon nanotubes, nitric acid treatment or fluorine heat trematment can add functional groups enhancing capacitance seven-fold [33], due to higher specific adsorption and reduced hydrophobicity. In addition,
creating carbon-oxide composites with MnO2 and RuO2, utilizes pseudo-capacitance
to store charge in the double layer Faradaically. These composites yield specific ca-pacitances of 150 F/g and higher [32, 33], typically 10-50 times the material's original
capacity [34].
Material developments in supercapacitor research can be directly adapted in CDI research. Increasing surface area, tuning pore size, and functionalizing carbon ma-terials can enhance capacitance and ultimately salt removal. These insights from supercapacitor work can inform the development of high performing CDI materials.
1.3
Carbon Materials for CDI
Studies over the past 20 years have examined a variety of carbon materials for CDI. Through increasing surface area, tuning pore size, and functionalizing the surface, researchers have strived to find the best electrode material for CDI. Materials inves-tigated have included carbon aerogels, cloths, nanotubes, mesoporous and
carbide-2Um
b
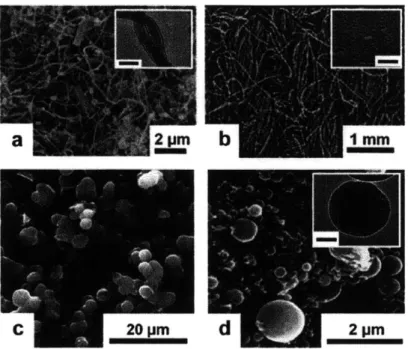
Figure 1-7: Carbon materials used in CDI. a) carbon nanotubes (inset: TEM image, scale bar: 100 nm), b) activated carbon cloth (inset: TEM image, scale bar: 250 nm), c) carbon aerogel matrix, d) ordered mesoporous carbons (inset: TEM, scale bar: 100 nm). Figure adapted from [1].
derived materials. These carbonaceous materials have been shown to have typical double layer capacities between 10 - 35 pF/cm2 [35], which for high surface area
materials (for example 500 m2/g) can lead to specific capacitances of 50-175 F/g.
Increasing the electrical capacitance also increases its salt adsorption. Here we will discuss the research of materials used for CDI systems.
Carbon aerogel (CA), shown in Figure 1-7 is a three-dimensional structure, typi-cally synthesized using a sol-gel process, transforming precurors such as resorcinol and formaldehyde into a highly porous network [36]. As Farmer found, CAs have high sur-face area (400-1100 m2/g), good structural strength, and high conductivity due to its interconnectivity. Aerogels typically have mesopores (3-30 nm) and interstitial pores. Many researchers have continued to study CA for CDI [37, 13, 38, 39, 40, 41, 42]. Recent studies have shown capacitances of 130 F/g in 250 mM NaCl solution [13]. However, the large number of sub-nm pores, which are not necessarily optimal for ion adsorption, have driven researchers to investigate carbon materials with more
mesoporous features.
Activated carbon cloth (ACC), shown in Figure 1-7, is woven from activated carbon fibers that are synthesized from phenolic resin. Surface area can be as high as
2500 m2/g [43]. Surface treatment using acid etch, increases the hydroxyl, carboxyl, and carbonyl groups, leading to faster kinetics during desalination [44]. Incorporating titania into the material significantly enhances electrosorption which is reversible with polarity [45, 46]. Carbon cloths have been cited to have capacities ranging from 20
F/g [22] to 100 F/g [35].
Carbon nanotubes (CNTs), shown in Figure 1-7, are grown in a chemical vapor deposition process, typically having pores only in the mesoporous range (2-50 nm). While CNTs have low surface area (1000 m2/g), the mesopores suggest that the
surface area is available for ion adsorption. CNTs have been studied in many electrode synthesis forms: in composites with nanofibers [47, 48], with binders [49, 50], and with ion-selective membranes [51]. While, CNTs have a lower surface area than ACC
(0.08 vs 0.5 M2), Sun et al. showed that their CNT-CNF composite had the same
performance. Yang et al. showed that CNTs have specific capacities from 100 F/g (untreated surface) upto 140 F/g following surface functionalization [51]. CNTs could be promising for a material with appropriate pore structure for CDI.
Ordered mesoporous carbons (OMCs), showns in Figure 1-7 are synthesized to have high surface area (1500 m2/g) and mesopores from 3-25 nm [1]. Li et al., showed
that OMCs have upto double the specific capacitance than that of ACCs, with upto
180 F/g capacitance in 100 mM NaCl solution [52].
In contrast to OMCs, carbide-derived carbons (CDCs) have been studied to un-derstand the effect of sub-nm pores on capacitance [53]. Surprisingly, CDCs also have higher salt adsorption than ACCs, suggesting that sub-nm pores contribue substan-tially to ion storage.
Material geometry, surface properties, and the CDI operating parameters play a strong role in ion adsorption. While research has focused on optimizing surface area, it has become clear that the porosity and chemistry of the surface influence salt removal. In order to understand the physics of the charge storage in the double layer,
we turn to the theory for more insight.
1.4
Electric Double Layer Theory
In CDI, salt removal occurs through the storage of ions in the electric double layer
(EDL). The physics of the EDL can provide insight into the relevant material
pa-rameters for desalination. The theory provides insight into how much salt can be removed during a CDI cycle. In this section, we study the basic Gouy-Chapman theory [54], its limitations, and work that has extended the model. Finally, we look at implications of the theory on electrode design.
When a potential is applied at an electrode surface, 0o, charge builds up at the surface. At the electrode-solution interface, at x = 0, counterions from the solutions
build up at the surface to balance the excess electrical charge of the electrode. Moving away from the surface, as x -+ o, this ion concentration decreases, returning to bulk concentration, co,. This is the formation of the double layer, depicted in Figure 1-9.
The distribution of ions at the surface can be characterized by considering the Gibbs free energy of the solution:
dG = -sdT +vdP + pjdNj + E dqi (1.1)
where G is the Gibbs free energy, s is enthalpy, T is temperature, v is volume, P is pressure, p is chemical potential, Nj is the number of particles of type j, V) is
potential, and q is charge. The electrical charge can also be equated in terms of the ion concentration, qj = zeNi, where z is the ion valence and e is the elementary charge. In a solution at equilibrium, the Gibbs free energy should be constant. Assuming no change in temperature and pressure, we find that equation 1.1 can be simplified to a sum of the electrochemical potential:
0 = E (pi + zei)dN (1.2) For dilute, ideal solutions the chemical potential is a function of concentration, given
from chemistry as:
p (x = + kT In (c(x)) (1.3)
where 1L is the reference chemical potential and k is the Boltzmann constant. The chemical potential is a function of x because the ion concentration is varying in x. At equilibrium, combining equations 1.2 and 1.3, for equilibrium at two points in solutions, x1 and X2:
W + kTln(c(xi)) + zey(xi) = + ± kTln(c(x2)) + zeP(x2) (1.4)
Simplifying, we arrive at the Nernst equation:
n C(2) -ze [(V)(x2) - (Xi)](
Lc(x1)J kT
and the Boltzmann distribution:
C(X2) = c(xi)exp
{Tze[(X
2) - ?P(Xl)} (1.6)In order to relate charge and potential we use Poisson's equation. Derived from Gauss' law, Poisson's equation gives:
d 2 Pe
(1.7)
dx2 E
where charge density pe = ciziF and e is the permittivity. The boundary conditions
for this system are:
(x- 00) = 0 (1.8) P(X = 0) = 00 (1.9)
Summing from the surface of the electrode to the bulk of the solution (x = 0 to
x -+ oo), and combining equations 1.7 and 1.6, we arrive at the Poisson-Boltzmann
Poisson-Boltzmann equation is:
d2p Fcooz . zep
d 2 = sinh( Ze)
(1.10)
dx2
6kT
The above analysis was conducted independently derived by Gouy and Chapman, and comprises the Gouy-Chapman (GC) theory.
To calculate the surface charge density, we integrate equation 1.10 f
i
d2i40Pedx = -el dx (1.11)
While the Poisson-Boltzmann can be solved numerically, we can solve it analytically in the low potential limit, when the surface potential is much smaller than the thermal voltage b0
<
0T = - = 25 mV. The Poisson-Boltzmann can be linearized:e
d
24b
_?$-x = (1.12)
dx2
A 2where AD is the thickness of the double layer, or the distance over which the surface charge is screened. In an electrolyte, the Debye length is given by:
kTe
AD f ke-TE (1.13)
VzeFc,,,,
or the thickness of the double layer. Integrating this, we find the surface charge density is:
(1.14)
AD
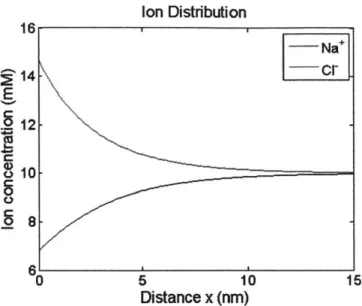
Figure 1-8 depicts the ion distribution at a polarized surface. At a surface where the applied potential is 10 mV we see larger counterion concentration at the surface, but co-ions also remain. The power required to adsorb counterions is also used to repel co-ions. Finally, we observe that the double layer thickness, or the region where there is an excess of ions compared to the bulk, has a physical thickness of about
10 nm. The Debye length varies from 1-10+ nm depending on the concentration of
Ion Distribution
16 Na+ M14 crE
~12
0 0 5 10 15Distance x (nm)
Figure 1-8: Ion distribution at a charged surface. 5o = 10 mV, c, = 10 mM
there may be overlapping double layers which limit salt adsorption for the measured surface area.
The Gouy-Chapman theory makes many assumptions. One assumption is that ions are infinitely small. At larger applied voltages k0
>
K, an absurdly large number of ions can pack onto the surface, which is not physically possible due to the molecular size of ions. In order to correct for this, Stern introduced a compact layer, as shown in Figure 1-9. Stern's modification gives a compact layer, where there is a linear drop in potential and specific adsorption of ions on the surface, and a diffuse layer, which follows Gouy-Chapman theory. There are two potential drops in the double layer:AV = A*D ±
A+s
8 (1.15)The potential drop in the Stern layer is given by Gauss' law:
Aot =F (1.16)
Ct
where+
vwI~
+
q
+
U-+
+
A4'ST
L4D
*+iX
tM
47;
IkAI I I II'it
Stern
++
Diffuse
Figure 1-9: The double layer is divided into 3 parts:
the diffus layer described by Gouy-Chapman, and the
the Stern (or compact) layer, bulk solution.
+
+
Bulk
which we get by integrating 1.11 over the diffuse layer.
While the Chapman-Stern model makes some improvement over the Gouy-Chapman theory, the assumptions that hold in dilute solutions at low potentials break down at higher voltages. The GCS model gives some insight into the physics of the electric double layer, for example its thickness and capacity at an electrode surface for a given potential. However, there are more effects that need to be considered to apply this model to analyzing salt removal in CDI.
The salt stored on the electrode surface was derived by Bazant's group, using
GCS theory and mass conservation [55]. By integrating the concentration of ions
stored in the double layer, as the double layer forms over time, they arrive at the salt adsorption density, w [56]:
W = 8ADco sinh2
A D (1.18)
This accounts for the effects of ions diffusion from the neutral bulk solution to the excess charge in the EDL. The efficiency, or the amount of salt ions stored compared to the electrical charge density is then just [56, 571:
WAPD
a= = tanh (1.19)
0- 4
This efficiency shows that for increasing salt concentration solutions, where the po-tential drop in the diffuse layer decreases, the efficiency of the system also decreases. This leads the CDI cell to become very inefficient at large bulk solution concentra-tions. Thus CDI is considered efficient in the brackish water regime. Charge efficiency can also be used to study the dynamics of adsorption and desorption of ions in CDI
[57], as well as determine the specific area of a material available for salt storage [56].
The Gouy-Chapman-Stern model is a dilute solution theory, which has a very limited account for steric effects. The Boltzmann distribution is used to describe ion concentration in solution as logarithmic; as potential exceeds the thermal voltage there are non-linear effects which break the assumption that the solution is dilute at the surface. Consider this: the maximum concentration of ions at a highly charged
surface is cmax = a-3 where a is the molecular spacing [4].Using the Nernst equation, eqn 1.5, with x1 = 0 and x2 = oo, the maximum potential at the surface is given as
[4]:
kT i~)=kT Cma
C ln(a3coo) = - ln(max)
(1.20)
ze ze coo
For a bulk solution concentration of 10 mM, spacing of 3
A,
and z = 1, the maximumpotential is only 330 mV [4]. In fact, the solution is no longer dilute beyond surface potentials between 25-200 mV. In CDI, voltages are typically applied between
500-1000 mV across the electrode surface. The basic double layer theory does not remain
valid in this regime; newer models and numerical tools are necessary to characterize the double layer.
In addition, the Dukhin number which determines the relative importance of con-ductivity in the diffuse layer compared to the bulk, breaks down at larger voltages. The Dukhin number, assuming Gouy-Chapman theory, has the form:
Du - = 4AD sinh2(zeVD (1.21)
aL L 4kT
A large Dukhin number where the surface conductivity is higher than the bulk, but
with thin double layers (AD
<
L), requires that the potential V)D be much larger than the maximum potential possible. The assumptions of the GCS do not hold for this thin double layer assumption [4].Recent modeling efforts have tried to account for steric effects [4, 5]. Bazant's group derived a formula for the compact double layer based on steric effects at the surface [4]:
q = -sgn(VD)2zecOOAD In [I
+
2v sinh(
2kT (1.22)where v = 2a3coo is the volumetric parameter. Figure 1-10 shows how their compact
double layer accounts for charge build up at the surface for a given applied potential. Unlike the Poisson-Boltzmann, this model asymptotes to limited charge build up at the surface. They also show that when steric effects are large the weakly non-linear approximations made from the Nernst-Planck equations do not hold, as shown in
04 mPB .. .,CDL 10 '/ V= 0.00005 162
v
=0.005
10 -0V
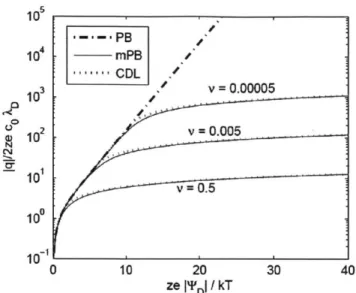
= 0.5 10 101 0 10 20 30 40 ze I'DI / kTFigure 1-10: The diffuse layer charge given by Poisson-Boltzmann (PB), modified PB (mPB) and compact double layer theory (CDL). mPB and CDL show that charge asymptotes at higher potentials, rather than infinitely increasing as with PB. Adapted from [4].
Figure 1-11 [5]. The model begins to account for steric effects, but is only valid for flat parallel plate electrodes, not accounting for the complex geometry of porous electrodes.
Biesheuvel and Bazant [581 developed models to describe the nonlinear dynamics of desalination in porous electrodes. Due to the complexity of porous geometry, they simplified their model by using the Gouy-Chapman-Stern model, and neglecting steric effects. Typically, the double layer model assumes that the bulk concentration stays constant. However, in capacitive deionization, there is a large depletion of ions from the solution. By studying the dynamics in pores, and assuming that there is a mass-transfer layer where ions are transported from solution into porous electrodes, Biesheuvel and Bazant find that there are two time scales for charging electrodes: a supercapacitor, short charging-time regime, TC, and desalination, a long charging-time
scale rD:
rc - 2 (1.23)
(II) 0.4 -0.2 0.1 0 0 10 20 30 t 0.06 e-0.01,- 3 0.04 MPB 0.02 - Weakly Nonlinear 0 0 10 20 30 t 4 3 *2 S - 0 .1 0* , 'u=10 0 0 10 20 30 (b) t 0.4 0.3 0.2 e = 0.01 0.1 V-10 0 0 10 20 30 (d)
t
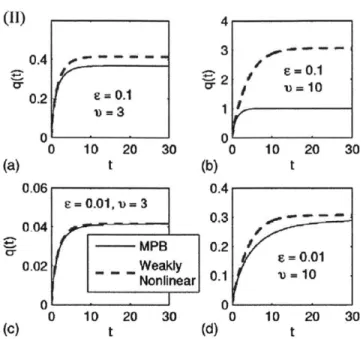
Figure 1-11: The diffuse layer charge given by the modified Poisson-Boltzmann (MPB), over time. Variables: e = ', v = 2a0cO. As double layer thickness and/or steric effects increase, the weakly nonlinear approximation no longer holds. Adapted from [5].
L 2
TD e
De
(1.24)
where hp is the ratio of pore volume to pore area, De is the diffusivity of the ions in bulk solution, and Le is the pore thickness. In the desalination regime, the ions stored in pores are largely comprised of counterions, and there is almost complete co-ion depeltion leading to desalination [58]. This model can inform the selection of porous materials, though they do make the assumption that the double layer thickness is smaller than the pore diameters.
In order to optimize salt adsorption in CDI, we need a better understanding of salt adsorption and the electrode properties involved in ion removal. Current materials are highly porous, with tortuous geometeries, overlapping double layers, and sub-nm diameters. In this thesis, we aim to investigate porous materials and identify appropriate double layer models to describe the salt adsorption.
(a)
1.5
Thesis Outline
CDI is a promising, portable desalination technology, especially for demineralization of brackish water. Thus far, development has focused on synthesizing high-surface area materials and modifying the surface properties to maximize ion storage and re-moval from the bulk. However, the physics of double layer charging can limit the charge storage: overlapping double layers; steric effects due to inaccessible pores, high solution concentrations, large applied voltages, and charge inefficiencies as so-lution concentration increases. In order to develop parameters for the optimal CDI electrode, we strive to use a simple, characterizable geometry, to experimentally in-vestigate capacitance and charging/discharging dynamics of an electrode material. Here, we study vertically aligned carbon nanotubes that have mesoporous diameters and interspacing, and are ideal to study the effects of pore lengths and solution con-centrations on capacitance. The goal of this work is to describe the experimental results with an appropriate double layer model.
In chapter 2, we discuss the synthesis and characterization of vertically aligned carbon nanotube electrodes for water desalination. We grow multi-walled carbon nanotubes (CNTs) using chemical vapor deposition. Electrodes are synthesized using a gold-gold diffusion bond method to transfer the CNTs onto a conductive substrate. Electrodes are characterized using electrochemical testing.
In chapter 3, we optimize electrode bonding methods for the material. We inves-tigate the use of gold diffusion bonding, conductive epoxies, and gold-tin bonding to transfer CNTs onto a current collector. The resistance and corrosion reactions are in-vestigated using impedance spectroscopy and cyclic voltammetry. A low temperature gold-gold diffusion bond is best for CDI studies.
In chapter 4, we characterize the electrodes electrochemically. Potentiostatic test-ing is used to determine the capacitance and double layer chargtest-ing behavior of the CNTs. The results are fitted to the Gouy-Chapman-Stern model. The charging ki-netics are studies as a function of solution concentration and varying CNT height. Comparing to a previous study, we find that CNTs are competitive with existing
high-surface area carbon materials.
Chapter 2
Synthesis of Electrode and
Preliminary Testing
This study seeks to investigate the physics of double-layer charging, in order to opti-mize CDI electrode materials. Ultimately, we are interested in determining how pore length and diameter affect the ion removal in CDI, and use that to inform models for double layer charging in porous electrode. In this study, we investigate vertically aligned carbon nanotubes (VACNTs) which have an ordered, easily-modeled geome-try; pores with diameters of 1-10+ nm; tunable heights between 1-1000 pm; and high conductivity. In addition, they have relatively high surface area of ~500 m2/g, which allows for measuring electrical response easily.
In this chapter, we cover the synthesis and characterization of VACNTs. We then
D
H
Figure 2-1: Parameters for electrode material. The electrode should have a tunable height, H and diameter, D. It should also be highly conductive.
use this material as an electrode, and conduct beaker testing to study its capacitive properties.
2.1
CNT growth and characterization
VACNTs were grown using a chemical vapor deposition process on a silicon wafer growth substrate, shown in Figure 2-2. Silicon wafers with 140 nm of SiO2 were
cleaned using 3:1 Piranha acid, rinsed with DI water, and spun dry. The cleaned wafers were prepared using electron-beam deposition, by sequentially depositing alu-mina (A120 3), the diffusion barrier, and iron, the growth catalyst. For the experiments
conducted in this chapter, the alumina thickness was 20 nm and the iron was 5 nm. The wafer was cleaved into 1 cm x 1 cm pieces using a diamond scribe. 4-5 pieces were then loaded into a 1 inch tube furnace.
In the furnace, the temperature is elevated between 650 *C and 750 'C. Hydrogen and helium flows over the substrate, removing oxides from the surface and forming catalyst sites. Once the furnace reaches the target growth temperature, the samples are annealed for 3-5 minutes. Growth begins when ethylene is introduced to the gas mixture, and carbon burns onto the catalyst sites forming nanotubes. In some cases, oxygen is also used to enhance the growth of CNTs. Following growth, the CNTs are cooled down for ~10 minutes in helium, and then removed from the furnace. Gas flow rates, growth temperature, and annealing times can all have an effect on the height and diameter of the CNTs.
In this chapter, CNTs were grown using a single furnace set up. However, samples studied in subsequent chapters were grown using a double furnace set up. While the growth process remains the same, the additional furnace is used to preheat the flowing gases and to thermally crack the ethylene, breaking the carbon bonds, for high quality
CNT growth. The CVD parameters for this experiment are given in Table 2.1 This CVD procedure was developed by Professor Carl's Thompson group at MIT. The
detailed growth procedure is given in Appendix A.
a)
Fe
A1203Si
b)-He
H2T=650-750C
c) ====.
C
2H
4-=
He
-=H
2T=650-750
0C
Figure 2-2: CVD growth of VACNTs. a) Growth substrate is prepared with alum-nia and iron, b) substrate is placed in furnace in He/H 2 environment at elevated
temperature, c) VACNTs grown on catalyst with ethylene.
growth parameter furnace temp anneal time H2 flow rate He flow rate C2H4 flow rate value 750 *C 3 min 400 sccm 100 sccm 200 sccm
a b I 0.8 0.6 0.4 0.2 1 2 3 4 5 6 7 c ' o dNo. walb 1 00 0.8- 0 0 0 0.6 0.4 0 0 0.2 0 0 0 0 0 5 10 Diameter (mn)
Figure 2-3: Characterization of CNTs. (a) TEM of CVD grown VACNT, Scale bar:
5 nm. (b) Cumulative distribution of CNT wall number. (c) Cumulative distribution
of the CNT inner (circle) and outer (square) diameters. (d) SEM of CNT carpet. Figure adapted from [6].
(JEOL 2010 FEG Analytical Electron Microscope), Figure 2-3a. The CNTs are 2-3
walled, with an inner diameter of 5.6 ± 2 nm and outer diameter 7.7 +2 nm, shown in Figure 2-3b and c. The TEM characterization was conducted by Dr. Robert Mitchell. Carpet heights were measured using scanning electron microscopy (SEM) (FEI XL30
FEG ESEM and Zeiss Ultra55 systems). Brunauer Emmett Teller (BET) surface
analyzer was used to characterize the specific surface area of the CNT carpets, which is approximately 540 m2/g.
The VACNTs have been easily characterized using microscopy and materials anal-ysis methods. We have synthesized high-surface area, mesoporous, ordered carbon structures for the study. However, the iron catalyst that the CNTs are grown on is a challenge for the electrochemical testing. Studying the Pourbaix diagram given in Figure 2-4, we see that for a pH between 5 and 7 (typical pH of saline solutions), and
0 0 0
0
2.0-Fe
4
1.2-
Fe
3+
0.8->0.4-
Fe26gn H20
WP
0 -
Fe
2+pH
Figure 2-4: Pourbaix diagram of iron in water. In CDI operating conditions, with applied electrode potentials 0-1 V vs. SHE and solution pH between 5-7, iron corrodes forming rust, Fe203. Figure from [7]
for typical operating potentials between 0-1 V with respect to the standard hydrogen electrode (SHE), the iron reacts with water producing rust. This Faradaic reaction creates two problems: 1) the capacitance measurements are adversely affected by on-going corrosion reactions which draw large currents, and 2) the catalyst is corroded away easily, leaving no binding material between the CNTs and the substrate. In order to avoid corrosion of the electrode material, the iron catalyst must be removed. We developed a transfer method using gold-gold self-diffusion bonding in order to re-move the CNTs from the growth substrate and bind it to a different, clean, conductive substrate.
2.2
Au-Au Self-Diffusion Bond
Gold-gold diffusion bonding was used to transfer CNTs from the growth substrate onto a non-corrosive current collector [6]. Gold-gold diffusion bonding, also referred to as thermocompression in the literature, has been used previously by several groups
using pressure and temperatures as low as 150 *C to bond CNTs to a substrate
[59, 60, 61].
To transfer the CNTs, a 20 nm adhesion layer of Ti and a 200 nm of Au was ebeam deposited onto the VACNTs and the transfer substrate, a piece of titanium. The gold interfaces on the CNTs and transfer substrate were then placed in contact, and pressure was applied using a stainless-steel pressure jig. The pressure jig was made up of 1/8" stainless steel plates, machined with holes for two 1/4-20" bolts in-house. The jig was tightened down with 2 bolts, with an applied torque of 120 N-cm. The jig was placed in a hydrogen furnace, where the temperature was ramped to 540
0
C at a ramp rate of 8 0C/min. The temperature was held for 30 min. Following cooling, the jig was removed from the furnace, and the growth substrate containing the iron catalyst was lifted-off using a blade. This leaves behind uncapped, catalyst-free CNTs on a Au current collector. This procedure is depicted in Figure 2-5.
2.3
Electrochemical Characterization
Having synthesized carbon nanotube electrodes our goal is to study its electrochemical properties. In order to characterize the double layer charging of the electrodes, we need to ensure no Faradaic reactions are occuring. In addition, we want to study the capacitance of the electrodes, in order to understand the optimal electrode properties for CDI. Here we will discuss the experimental set up and testing methods in order to evaluate the electrode.
2.3.1
Cell Set Up
In this study, we used beaker testing to study the CNT electrodes. In a simple two-electrode cell, the sample being tested, the working two-electrode, is dipped in solution with a reference electrode which completes the cell. A potential is applied across this cell and the current is measured. However, in this system we only know the cell potential, not the potential drop across the electrode. The reference electrode must be capable of maintaining the applied potential and drawing the current required to
b
ITM
Si CNT away Au - A1203 + Fe t CL) EU P_ T= 25 *C
Td 540 *CA
8 */IminTf125*'C ti Timeblade
t2Figure 2-5: Gold-gold diffusion bond process. a) Process steps for transfer of CNTs, b) Temperature profile in furnace, c) CNT electrode on gold substrate. Figure from [6].


![Figure 1-5: Test prototype developed by Welgemoed and Schutte [2]. This is 1 / 4 0 th the size of an actual stack](https://thumb-eu.123doks.com/thumbv2/123doknet/14200655.479883/20.918.245.646.139.456/figure-test-prototype-developed-welgemoed-schutte-actual-stack.webp)
![Figure 2-6: Three electrode cell set up. a) Beaker schematic, b) potentiostat schematic adapted from [8]](https://thumb-eu.123doks.com/thumbv2/123doknet/14200655.479883/43.918.254.648.139.378/figure-electrode-cell-beaker-schematic-potentiostat-schematic-adapted.webp)
