HAL Id: hal-02134864
https://hal.archives-ouvertes.fr/hal-02134864
Submitted on 20 May 2019HAL is a multi-disciplinary open access archive for the deposit and dissemination of sci-entific research documents, whether they are pub-lished or not. The documents may come from teaching and research institutions in France or abroad, or from public or private research centers.
L’archive ouverte pluridisciplinaire HAL, est destinée au dépôt et à la diffusion de documents scientifiques de niveau recherche, publiés ou non, émanant des établissements d’enseignement et de recherche français ou étrangers, des laboratoires publics ou privés.
Experimental study and modeling of phase equilibrium
of the methanol–tripalmitin system: application to palm
oil transesterification with supercritical methanol
Winatta Sakdasri, Ruengwit Sawangkeaw, Yaocihuatl Medina-Gonzalez,
Séverine Camy, Jean-Stéphane Condoret, Somkiat Ngamprasertsith
To cite this version:
Winatta Sakdasri, Ruengwit Sawangkeaw, Yaocihuatl Medina-Gonzalez, Séverine Camy, Jean-Stéphane Condoret, et al.. Experimental study and modeling of phase equilibrium of the methanol– tripalmitin system: application to palm oil transesterification with supercritical methanol. Indus-trial and engineering chemistry research, American Chemical Society, 2016, 55 (18), pp.5190-5199. �10.1021/acs.iecr.5b04588�. �hal-02134864�
Experimental Study and Modeling of Phase Equilibrium of the
Methanol
−Tripalmitin System: Application to Palm Oil
Transesteri
fication with Supercritical Methanol
Winatta Sakdasri,
†Ruengwit Sawangkeaw,
‡Yaocihuatl Medina-Gonzalez,
§Séverine Camy,
§Jean-Stéphane Condoret,
§and Somkiat Ngamprasertsith
*
,†,⊥†Fuels Research Center, Department of Chemical Technology, Faculty of Science, Chulalongkorn University, 254 Phayathai Road,
Pathumwan, Bangkok 10330, Thailand
‡The Institute of Biotechnology and Genetic Engineering, Chulalongkorn University, Institute Bldg. 3, 254 Phayathai Rd.,
Pathumwan, Bangkok 10330, Thailand
§INPT, UPS, Laboratoire de Génie Chimique UMR CNRS 5503, Université de Toulouse; 4, Allée Emile Monso, F-31030 Toulouse,
France
⊥Center of Excellence on Petrochemical and Materials Technology, Chulalongkorn University, 254 Phayathai Road, Pathumwan,
Bangkok 10330, Thailand
ABSTRACT: The phase behavior of the methanol−palm oil system was first experimentally assessed in the temperature range of 363−393 K and pressure range of 1−4 MPa. Second, comparative modeling of the phase equilibrium of the methanol−tripalmitin system was performed using the Peng−Robinson equation of state (PR EoS) with second-order modified Huron−Vidal (MHV2) mixing rules, in combination with the universal functional activity coefficient model (UNIFAC) and the universal quasi-chemical (UNI-QUAC) excess Gibbs free-energy model. The agreement between experimental and modeling results was found to be satisfactory when MHV2 mixing rules are used in combination with the UNIQUAC model. Finally, the thermodynamic
model was applied to predictfluid phase equilibria of palm oil transesterification with supercritical methanol. From the isochoric method in the temperature range of 373−693 K and the pressure range of 1−16 MPa, the model was found to predict global mixture behavior.
1. INTRODUCTION
The production of biofuels from lipid-based biomasses such as vegetable oil and/or animal fats is becoming attractive, because of diminishing fuel reserves and various environmental issues. The transesterification reaction in supercritical alcohol (SCA) has been extensively studied in recent years to produce biofuels, particularly biodiesel. SCA does not require any catalysts or auxiliary chemicals and does not generate significant waste.1 From a technical point of view, this catalyst-free route is considered to be more technically efficient than conventional catalytic biodiesel processes, because it provides a faster reaction rate, offers a higher-purity product, and involves a simpler separation and purification step.1−4
Knowledge of phase equilibria among the compounds involved in the transesterification reaction (i.e., alcohol, triglycerides, diglycerides, monoglycerides, fatty acid esters, and glycerol) is necessary to control the possible phases that coexist in the reactor, thereby enabling the elucidation of the
optimal operating conditions for biodiesel production via the SCA process. In the past decade, the multicompound phase equilibrium, including the binary phase equilibrium of alcohol− triglyceride (reactant system),5−8 alcohol−monoglyceride and alcohol−diglyceride (intermediate system),9 and alcohol−fatty acid esters and alcohol−glycerol (product system),10have been widely investigated. However, the studies on ternary and quaternary systems are few. For example, Glisic et al.8measured the vapor−liquid equilibrium of methanol−triolein, and Fang et al.7 have reported the binary phase equilibrium data for supercritical methanol (SCM)−C18 methyl esters. In a
previous study,11 we used literature-reported vapor−liquid equilibrium data for methanol−triolein, methanol−methyl oleate, and methanol−glycerol binary systems to develop a thermodynamic model for predicting the conversion of triglycerides during the SCM transesterification reaction performed in a continuous tubular reactor. We observed that an equation of state/Gibbs free energy (EoS/GE) approach
with the well-known Peng−Robinson (PR) EoS and non-conventional second-order modified Huron−Vidal (MHV2) mixing rules could predict the conversion of triglycerides along the reactor with acceptable precision.
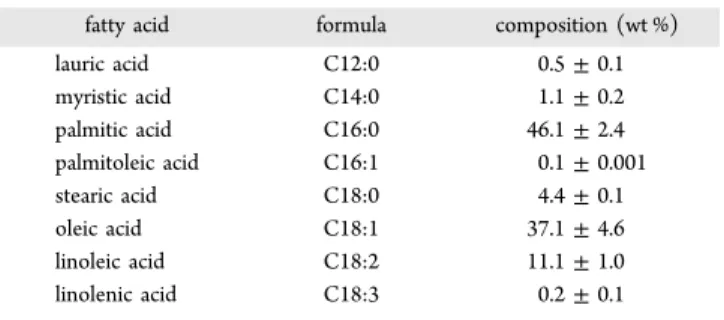
Palm oil (PO) is a promising feedstock for biofuel production, because of its low cost and high productivity per unit of planted area. Moreover, the use of PO as a biofuel feedstock is increasing, particularly in Asian countries, because it is easy to cultivate in tropical countries such as Malaysia, Indonesia, and Thailand.12 As indicated by its fatty acid composition (Table 1), PO is mainly composed of palmitic acid
(42−48 wt %) and oleic acid (37−40 wt %), with minor contents of linoleic acid (9−10 wt %), stearic acid (∼4 wt %), and myristic acid (∼1 wt %). As discussed previously, the phase equilibria of the methanol−tripalmitin system, which is necessary for developing the biofuel production of PO in SCM, has not yet been reported in the literature. Therefore, the first objective of the present study was to investigate the phase behavior of the methanol−PO system. The measurements were performed at temperatures ranging from 363 K to 393 K and at pressures ranging from 1 MPa to 4 MPa. We used low temperatures to limit the influence of a possible
trans-esterification reaction (which occurs at temperatures over 423 K). The obtained experimental data were then compared and modeled with the same approach used as that used in our previous study concerning triolein.11
With respect to the first objective, we used the thermody-namic model to determine favorable operating conditions for the homogeneous phase transesterification of PO with SCM. For this purpose, the three binary subsystems (i.e., methanol− tripalmitin, methanol−methyl palmitate, and methanol−glycer-ol) were considered to predict the phase envelope of the reaction mixture. Finally, we investigated the experimental data obtained via a so-called isochoric method in the temperature range of 373−693 K and the pressure range of 1−16 MPa to ascertain the selected thermodynamic model.
2. MATERIALS AND METHODS
2.1. Materials. PO and analytical-grade methanol (99.5%) were supplied by Morakot Industries Co., Ltd. (Thailand) and Sigma-Aldrich, respectively. For the gas chromatography (GC) analysis of the product samples, analytical-grade methyl heptadecanoate (99.5%, Fluka) was used as an internal standard and n-heptane (99.5%, Fisher) was used as an analytical solvent. The fatty acid composition of PO is summarized inTable 1. For the determination of the distribution of fatty acids, American Oil Chemists’ Society Method No. AOCS Ce2-66 was applied to prepare a fatty acid methyl ester (FAME) sample.13 The glyceride methyl ester content in the FAME sample was determined on the basis of the gas-chromatograph peak area; GC was performed on Shimadzu Model GC-14B equipped with a capillary column (DB-WAX) and a flame ionization detector. The temperatures of the injector and detector were set to 250 °C. The column temperature was initially set to 180°C with a holding time of 8 min and then increased to 200°C at a heating rate of 10 °C min−1.
2.2. High-Pressure Experimental Apparatus. The phase behavior of the methanol−tripalmitin (PO) system was measured in a high-pressure variable-volume cell (Top Industries S.A., France). This setup is classically used in the determination of thefluid−liquid phase transition of mixtures on the basis of the synthetic method,14as described thoroughly elsewhere.15However, for the purpose of this study, where the Table 1. Fatty Acid Composition of Palm Oil
fatty acid formula composition (wt %)
lauric acid C12:0 0.5± 0.1 myristic acid C14:0 1.1± 0.2 palmitic acid C16:0 46.1± 2.4 palmitoleic acid C16:1 0.1± 0.001 stearic acid C18:0 4.4± 0.1 oleic acid C18:1 37.1± 4.6 linoleic acid C18:2 11.1± 1.0 linolenic acid C18:3 0.2± 0.1
Figure 1.Schematic of the experimental apparatus. Legend: (1) high-pressure cell, (2) piston, (3) CCD camera, (4) monitor, (5) ATRfiber probe, (6) pressure gauge, (7) thermocouple, (8) FTIR spectrometer, and (9) FTIR spectrum for monitoring.
mutual solubility of compounds is low, the cell was adapted to determine the in situ concentration of phases at equilibrium using a Fourier transform infrared (FTIR) spectroscopy method. This technique allows direct determination of the equilibrium concentration of methanol in a PO-rich phase. A diamond attenuated total reflection (ATR) fiber probe was positioned at the top of the cell such that the fiber was in contact with only the PO-rich phase. All spectra were recorded using a Bruker Tensor 27 FTIR spectrometer (Bruker Optics, Inc.) in the wavenumber range of 580−3600 cm−1. The experimental setup is shown inFigure 1.
To perform a measurement, wefirst filled the bottom of the cell with ∼12.0−15.0 mL within an accuracy of ±0.1 mL (0.30−0.37 mol) of PO, corresponding to half of the total cell volume, and a magnetic bar was placed inside the cell. The tip of the diamond ATRfiber probe was then immersed in PO, and a consecutive spectrum of pure PO was recorded. Following this, ∼12.0−15.0 mL within an accuracy of ±0.1 mL (0.01− 0.02 mol) of methanol was added to completely fill the cell volume. The methanol-to-oil molar ratio in the cell was∼24:1. The cell was tightly closed and then heated to the desired temperature using a heating-bath circulation thermostat (Model CC-304B, Huber, Inc.). Pressure was increased via manual movement of a piston. The system was maintained at the desired temperature and pressure for at least 3 h; FTIR spectra of methanol in the PO-rich phase were then obtained. During the stabilization of the measuring conditions, a small decrease in the pressure between 1 bar and 5 bar was observed and was compensated by moving the piston. The system was considered to have reached equilibrium when at least three consecutive spectra scanned at 30 min intervals showed no substantial difference in absorbance. These solubility experiments were performed in the temperature range of 363−393 K and at pressures up to 4 MPa.
2.3. High-Temperature, High-Pressure Experimental Apparatus for Transesterification Reaction. For biofuel production under supercritical conditions, the phase behavior of transesterification between methanol and PO was studied in a constant-volume apparatus (isochoric method). This isochoric method has been used to determine accurate densities and phase transitions for biofuel production from several types of vegetable oil using SCA.16−19 The cell was composed of stainless steel tubing (closed at both ends) with 9.52 mm outer diameter (o.d.), 1.24 mm thickness, and 58 cm length; the total volume of the cell at room temperature was 22.58 mL. The pressure was measured with a Wika pressure gauge with an uncertainty of±0.1% (63.50 mm, lower mount, 6.35 mm NPT fitting, and a working pressure of 0−34.5 MPa). Temperature was monitored by a Type K thermocouplefitted directly inside the cell. The uncertainty of temperature measurement is±1.5 °C in the range of −40 °C to 375 °C and ±0.004T in the range of 375°C to 1000 °C. The mixture of methanol and PO at a constant molar ratio of 12:1 was added into the cell, while global density values (total mass/reactor volume) were varied between 0.535 g cm−3to 0.618 g cm−3by adjusting the total quantity of reactants. The density is accurate to±0.005 g cm−3. The measurement cell was covered with aluminum foil and placed in an electrically heated tubular furnace. The cell temperature was slowly heated at 2 °C min−1to the desired final temperature. The total heating duration of one experiment was 3−4 h. The pressure was recorded as the temperature was increased from 373 K to 693 K to obtain the pressure− temperature (P−T) curve or isochoric line. The experiments
are repeated at least three times and are reproducible to approximately±0.005.
2.4. Data Processing for the Determination of Solubility of Methanol in PO. The equilibrium concen-tration of methanol in the PO-rich phase was deduced from recorded FTIR spectra according to the Beer−Lambert law, as shown ineq 1:
ε
= × ×
A L C (1)
where A is the sample absorbance, ε the molar extinction coefficient (L mol−1cm−1) of the compound of interest, L the optical path length (cm), and C the sample concentration (mol L−1). In the FTIR spectra of methanol, the height of the peak at ∼1010 cm−1was selected to determine the concentrations, as
illustrated in Figure S1 in the Supporting Information. Note that the peak height was used as an analytical response instead of the peak area to minimize the error from the baseline correction of the integrated area. An aqueous solution of methanol with a known concentration was first measured by FTIR to determine the product of the molar extinction coefficient and the optical path length (ε × L) for methanol. We emphasize that the signal at 1010 cm−1 in the FTIR spectrum of methanol was observed at the same position in the spectrum of the PO-rich phase.
Finally, the mole fraction of methanol in the PO-rich phase for phase equilibrium data was calculated as
= + x C C C MeOH MeOH
MeOH palm oil (2) where CMeOHis the concentration of methanol, as determined by FTIR measurements, and Cpalm oilis the concentration of PO
determined on the basis of the molar density of PO as a function of temperature, as obtained from the literature.20 Esteban et. al reported that the molar density of PO increases at a rate of 0.0052 g L−1per 10 K (increasing by <2%) when the temperature increases between 363 K and 393 K.20Thus, this calculation assumes that no change occurs in the molar density of PO, as a consequence of methanol solubilization in the PO-rich phase. This methodology has already been demonstrated to reliably determine the solubility of epoxides in CO2,21water in CO2,
22
and glycerol in CO2.
23
2.5. Phase Equilibrium Modeling. In this study, phase equilibrium modeling was performed using PR EoS.24In our previous study,11we demonstrated that PR EoS with MHV2 mixing rules properly describes the experimental fluid phase equilibria of an oil−alcohol−ester−glycerol quaternary mixture at high pressures. This approach, referred to as the EoS/GE mixing rules, allows the application domain of the cubic equation of state to be extended to mixtures involving polar compounds. Because the MHV2 mixing rules are based on the computation of the excess Gibbs energy at zero pressure, an activity coefficient model is required in addition to the equation of state. In this study, the UNIversal QUasi-Chemical (UNIQUAC) activity coefficient model was compared with the UNIversal Functional Activity Coefficient (UNIFAC) predictive group contribution model. The well-known PR EoS is given by = − + − ⎛ ⎝ ⎜ ⎞ ⎠ ⎟ P RT v b a T v bv b ( ) 2 2 2 (3) The expression of the EoS parameters (i.e., the attractive term a(T) and the covolume (b)) is dependent on the chosen
mixing rules. In the general case of the modified Huron−Vidal (MHV) mixing rules, the attractive term is obtained by solving
∑
∑
∑
α− α + α − α = + ⎛ ⎝ ⎜ ⎞ ⎠ ⎟ q z q z g RT z b b ( ) ( ) ln i i i i i i E i i i 1 2 2 2 0 (4) where α = a bRT (5) α = a b RT i i i (6)∑
= = b z b i n i i 1 (7) ω ω = × + + − − ⎛ ⎝ ⎜⎜ ⎞ ⎠ ⎟⎟ a R T P T 0.45724 [1 (0.37464 1.5422 0.266992 )(1 )] i c i c i i i r 2 , 2 , 2 2 (8) = ⎛ ⎝ ⎜⎜ ⎞ ⎠ ⎟⎟ b RT P 0.0777960739 i c i c i , , (9)In the case of PR EoS, q1=−0.4347 and q2=−0.003654 for MHV (implicit calculation ofα). An activity coefficient model must be chosen to determine the value of the excess Gibbs energy at zero pressure (reference pressure), g0E. At their initial
development, the authors of the MHV mixing rules coupled PR EoS with the UNIFAC predictive activity coefficient model, leading to a predictive approach to using cubic EoSs. In this study, the MHV mixing rules are used with the original UNIFAC model and with the UNIQUAC activity coefficient model. When the UNIQUAC model is employed in the mixing rule, two binary interaction coefficients (Aijand Aji) must be
fitted to the experimental data. The fitting of binary interaction coefficients obtained by minimizing an objective function based on the relative difference between experimental and calculated methanol mole fraction, with the Simulis Thermodynamics add-in (PROSIM S.A., France), inserted into an MS-Excel worksheet.25
The ability of the aforementioned approach to model the methanol−tripalmitin (PO) thermodynamic behavior has been compared. For the UNIQUAC model, the molecular volume (ri) and molecular surface area parameters (qi) for each pure
compound are required. These parameters can be estimated according to the group-contribution method of Bondi:26
∑
ν = = ri R k k i k 1 ( ) (10)∑
ν = = qi Q k k i k 1 ( ) (11) where vk(i)is the number of groups k in molecule i and RkandQkare the UNIFAC subgroup parameters given inTable 2. The values of riand qiare given inTable 3for all of the components
used in this study.
Finally, the mean average absolute relative error (AARE) was calculated to evaluate the ability of the model to represent experimental data, according toeq 12:
∑
= − × = N x x x AARE (%) 1 100 i N i i i p 1 exp cal exp p (12) where xiis the molar solubility fraction of methanol in PO andNpis the number of experimental values.
3. RESULTS AND DISCUSSION
3.1. Solubility of Methanol in the PO-Rich Phase. The experimental concentrations (in mol L−1) of methanol in the PO-rich phase in the temperature of 363−393 K and the pressure range of 1−4 MPa, as obtained from FTIR experiments, are presented in Table 4. At constant pressure, methanol solubility in the PO-rich phase increases with increasing temperature; that is, the miscibility of both compounds is enhanced at higher temperatures. These data exhibit the same trend as the experimental results for methanol−sunflower oil and methanol−triolein systems reported by Glišić et al.8 and Tang et al.,5 respectively. The methanol mole fraction in the PO-rich phase (xi) deduced from
solubility experimental data is also reported inTable S2. 3.2. Phase Behavior Modeling for the Methanol−PO System. To simplify the modeling of the methanol−PO binary systems, tripalmitin was selected as a single pseudo-triglyceride for representing real PO. A single pseudo-triglyceride was estimated by using group contribution methods, as proposed in the literature.19,27,28 The calculation of this single pseudo-triglyceride is given in theSupporting Information. The content of triacylglycerol in palm oil is 4.0%−10.5% of trisaturated and 41%−59% of disaturated−monounsaturated compounds.29 Furthermore, the estimated critical properties of tripalmitin and triolein were almost unity, because of the large molecular structure. According to the pseudo-triglyceride assumption, employing tripalmitin as the model compound is adequate for modeling the methanol−PO system. The critical properties of tripalmitin and other compounds (i.e., methyl palmitate, methanol, and glycerol) used in this study were estimated by a group-contribution method;30 the results are presented in Table 5.
In this study, the thermodynamic models of PR with conventional quadratic mixing rules, MHV1-UNIFAC, PR-MHV2-UNIFAC, and PR-MHV2-UNIQUAC, were used to correlate the experimental data. As previously mentioned, this fitting was performed by minimizing the objective function with the Simulis Thermodynamics MS-Excel add-in; the results are shown inFigure 2. The calculated AARE values are presented inTable S2in the Supporting Information.
Figure 2 shows the comparison of the experimentally calculated phase equilibria for methanol−tripalmitin binary system. As previously mentioned, PR, PR-MHV1-UNIFAC, Table 2. UNIFAC Group Volume and Surface Area Parameters Used in this Studya
main group subgroup Rk Qk
CH2 CH3 0.901 0.848 CH2 0.674 0.540 CH 0.447 0.228 CC CHCH 1.117 0.867 COOC CH2COO 1.676 1.420 OH OH 1.000 1.200 CH3OH CH3OH 1.431 1.432
and PR-MHV2-UNIFAC models are predictive, while binary interaction parameters for the MHV2-UNIQUAC model must be fitted from experimental data. The obtained binary interaction coefficients, as a function of temperature, are shown in Table 6. The results show that the PR-MHV2-UNIQUAC model gave the best correlation, with a minimum average absolute relative error of 5.58%, followed by PR, PR-MHV2-UNIFAC, and PR-MHV1-UNIFAC with relative errors of 16.26%, 44.09%, and 50.89%, respectively. The use of experimental data to fit binary interaction parameters for UNIQUAC model logically leads to better predictions with this latter. Moreover, it must be noticed that the UNIQUAC model uses the molecular volume (ri) and molecular surface area parameters (qi) for each pure compound, while the UNIFAC
model uses only the component group and subgroup matrices stored in the databank. Consequently, the UNIQUAC model has more potential to address compounds of very different sizes. As proposed by Casas et al.,31the UNIQUAC model also gives satisfactory representation of experimental data for three binary systems of soybean oil and methanol (oil−methanol, oil−glycerol, and FAMEs−glycerol). In our previous study,11 the PR-MHV2-UNIQUAC model was successfully employed to evaluate the phase equilibrium of the methanol−triolein binary system with a relative error of <5%. Moreover, in the same study, we reported that the PR-MHV2-UNIQUAC model was appropriate for application to the methanol−methyl oleate
and methanol−glycerol systems, where the relative errors were 3% and 10%, respectively.31
Finally, the objective of the next phase of this study was to apply the PR-MHV2-UNIQUAC model to predict the phase behavior of the transesterification reaction of PO with SCM for the biofuel production. Since the transesterification reaction has three steps, the intermediate compounds of monoglyceride (MG) and diglyceride (DG) will occur. Likozar et al.32−34 reported that the presence of those intermediates dominate the phase equilibrium in the biodiesel production using the Table 3. Parametersriandqifor the Studied Systems, as Calculated from Data in Table 2andeqs 10and11
compound UNIFAC group assignment ri qi
tripalmitin 1 [CH] 3 [CH3] 41 [CH2] 3 [CH2COO] 35.829 29.172
methyl palmitate 2 [CH3] 13 [CH2] 1 [CH2COO] 13.147 10.984
methanol 1 [CH3OH] 1.431 1.432
glycerol 1 [CH] 2 [ CH2] 3 [OH] 4.796 4.908
Table 4. Experimental Data of Methanol Solubility in the Palm-Oil-Rich Phasea temperature (K) pressure (MPa) CMeOH (mol L−1) standard deviation, SD 363 1 0.6859 ±0.0083 383 1 0.6876 ±0.0157 393 1 0.7599 ±0.0167 363 2 0.6052 ±0.0090 383 2 0.6607 ±0.0099 393 2 0.7073 ±0.0150 363 4 0.5649 ±0.0011 383 4 0.7227 ±0.0058 393 4 0.7230 ±0.0534
aThe uncertainties of temperature, pressure, and C
MeOHare±0.2 K, ±
0.02 MPa, and±0.005 mol L−1, respectively.
Table 5. Characteristic Parameters Used in the Peng− Robinson Equation of State (PR EoS) for Pure Compounds
compound Tc(K) Pc(MPa) Vc(cm3mol−1) ω
tripalmitina 965.00 0.25 2947.90 0.14
methyl palmitatea 717.63 1.26 1007.10 0.21
methanolb 512.60 8.01 118.00 0.57
glycerolb 850.00 7.50 264.00 0.56
aCompounds are estimated from a group contribution method (and precisely estimated using a corresponding method such as Lydersen or Joback).42bPrecise data are taken from a databank (DiPPr, if taken from Simulis Thermodynamics software).
Figure 2.Experimental (dotted lines) and calculated (solid lines) T−x diagrams for the methanol−tripalmitin system at (a) 1 MPa, (b) 2 MPa, and (c) 4 MPa. Error bars represent the standard deviation between experiments.
Table 6. Calculated Binary Interaction Coefficients for the UNIQUAC Model
binary mixture A12(K) A21(K)
methanol−tripalmitin 0.007 + 0.05T 1505 + 0.07T
methanol−methyl palmitate −5703 + 12.60T 1694− 3.65T
homogeneous catalytic process. However, the influence of MG and DG was suspended in this work, because of their short life span under the supercritical conditions and their low concentration in the mixture. Moreover, sampling of the reaction mixture in real time could disturb the equilibrium, because of the small volume of the reactor in this work. To simplify the modeling, only four main compounds involved in the transesterification reaction were considered: alcohol, triglyceride, fatty acid esters, and glycerol. Consequently, the binary interaction parameters corresponding to the methanol− methyl palmitate and methanol−glycerol binary subsystems were deduced on the basis of the correlation with experimental data from the literature.10,35 The comparisons of the experimentally calculated phase equilibria for methanol−methyl palmitate and methanol−glycerol binary systems are shown in Figures 3a and 3b, with average absolute relative errors of
6.48% and 2.65%, respectively. In addition, binary interaction coefficients, as a function of temperature, fitted for each binary system, are also given in Table 6. The values of the binary interaction coefficients for the methanol−methyl palmitate system were observed to be very similar to those for the methanol−methyl oleate system reported in our previous study.11This similarity is probably because characteristic critical parameters of methyl oleate differ only slightly from those of
methyl palmitate (i.e., Tc= 764 K, Pc= 1.28 MPa, Vc= 1016 cm3mol−1, andω = 0.20).
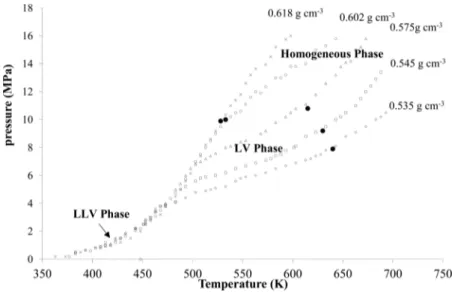
3.3. Phase Behavior Modeling of Biofuel Production from PO with SCM. With the objective of determining the appropriate operating conditions ensuring a homogeneous phase in the reactor, the P−T behavior for methanol and PO systems was characterized using the isochoric method in the temperature range of 373−693 K and the pressure range of 1− 16 MPa. In this study, an initial methanol-to-palm-oil molar ratio of 12:1 was chosen for investigating the behavior of the reaction system, whereas the global density values were varied between 0.535 g cm−3 and 0.618 g cm−3. In the previous study,16the 12:1 ratio has been reported as an optimal molar ratio for the biofuel production from PO with SCM at high temperature. The using of small molar ratio reflected in a lower energy requirement for methanol preheating, pumping, and recovery compared over that of conventional SCM processes with a methanol-to-oil molar ratio in the range of 40:1−42:1.36 The P−T diagram of the experimental trajectories line (empty dots), including the phase-transition points (black dots) at each global density, is shown inFigure 4. For global density values of 0.535, 0.545, and 0.575 g cm−3, the experimental P−T lines were separated into three sections, depending on their slope, in a manner similar to that observed in the phase transition studies by Velez et al.17,18and Valle et al.37These authors proposed that the P−T lines can be used to determine the phase transition from the heterogeneous region to the homogeneous region. In thefirst section (temperature below 500 K), the pressure increase accelerates with increasing vapor pressure of methanol.38 According to the direct observations of this phase transition in a double-window cylinder reactor, as reported by Valle et al.,37 liquid−liquid− vapor (LLV) equilibria occur at this low temperature. When the reaction temperature approaches the critical temperature of methanol (∼230 °C), and depending on the global density of the mixture, a smaller slope is observed, denoting the second section. In this second section, Valle et al. observed the occurrence of liquid−vapor (LV) equilibria, because of the complete miscibility of both liquid phases. From the intersection of thefirst and second sections, the phase change from the LLV equilibrium phase to the LV equilibrium phase is indicated as thefirst transition point. Finally, a single phase is observed in the third section. In this case, the points corresponding to the second phase transition were obtained from the intersection between the second and third sections, which indicates the phase change from the heterogeneous to the homogeneous region. For example, at a global density of 0.535 g cm−3, the transition to a homogeneous phase occurs at 613 K and 7 MPa, as also shown inFigure 4(black dots).
The P−T lines display different behaviors at higher global densities of 0.602 and 0.618 g cm−3. A rapid increase in pressure with temperature was observed in the second section. In this case, the LV equilibria were not observed, probably because of the expansion of the liquid phase that filled the reactor volume. As reported by Barrufet and Eubank,39 this observation corresponds to the isochoric colinearity phenom-enon at the cricondentherm temperature (CT). Therefore, the experimental results imply that only a phase transition from the heterogeneous region to the homogeneous region was obtained for the highest global density.
According to the best-fitted thermodynamic model insection 3.2, we predicted the phase envelope using the PR-MHV2-UNIQUAC model. The predicted phase envelopes for Figure 3.Experimental (dotted lines) and calculated (solid lines) P−x
diagrams for (a) the methanol−methyl palmitate (experimental data were obtained from Xu et al.35) and (b) methanol−glycerol binary system (experimental data were obtained from Shimoyama et al.10).
reactants only (dashed line) and mixtures of reactants and products at given palm-oil conversion rates (solid lines) of the transesterification reaction are also shown inFigure 5. In the transesterification reaction of PO and methanol, the system evolves from reactants (i.e., tripalmitin and methanol) tofinal products (i.e., methyl palmitate, glycerol, and remaining methanol) when 100% conversion of PO is achieved. For calculation of the phase equilibria of mixtures involving reaction products, methyl palmitate is used to represent FAMEs produced by the transesterification reaction. Therefore, the phase equilibrium of the methanol−tripalmitin binary system was considered in the case of a mixture of reactants only, with a methanol-to-oil molar ratio of 12:1. Note that the prediction of the P−T line was examined with LLV equilibria functions available in the Simulis Thermodynamics software. As evident in Figure 5, the prediction is in good agreement with the experimental trajectory of the LLV region at temperatures <500 K.
For additional details on the physical state of the mixture in the reactor, the phase envelope evolution was constructed using different product compositions. The global molar composition of final product mixtures was obtained by assuming different PO conversion values, varying between 10% and 100%, which results in the global mixture compositions summarized inTable 7.19As an example, for 100% conversion, the methanol−methyl palmitate and methanol−glycerol binary interaction parameters were used to predict the phase envelope of the ternary mixture (methyl palmitate−methanol−glycerol) on the basis of the PR-MHV2-UNIQUAC model, using the critical properties reported inTable 5.
As shown inFigure 5, the predicted phase envelopes define two regions, corresponding to an LV zone (enclosed area) and a homogeneous zone corresponding to the observed reaction products. The results demonstrate that all the phase envelope predictions of the PR-MHV2-UNIQUAC model match well with the measured data in the LV region under moderate conditions. Independent of the mixture composition, the Figure 4.Pressure−temperature (P−T) curves for the methanol and palm oil systems with a molar ratio of 12:1; solid circles (●) denote the phase-transition points. Data are shown as means±1 SD, as derived from three independent repeated measurements.
Figure 5. Phase behavior of supercritical transesterification for methanol and palm oil. Reactant phase envelopes (dashed line), product phase envelopes (solid line), and critical points (■) were predicted by the PR-MHV2-UNIQUAC model. The experimental trajectories (empty dots) and transition points (●) are shown for the methanol and palm oil system with a molar ratio of 12:1.
system can be considered as homogeneous at temperatures above 623 K and pressures above 10 MPa. In addition, the critical points of mixtures were predicted; the results are included in Figure 5. The critical temperature increases from 539.03 K to 662.29 K with increasing PO conversion, corresponding to methanol consumption via the transester-ification reaction (Table 7). This result is consistent with a report stating that the critical point of such reaction mixtures increases with increasing methanol content in the reaction mixture.40However, a minimal change in the critical pressure was narrowly observed in the range of 8.14−11.27 MPa. With respect to the phase envelope prediction, this observation suggests that temperatures and pressures greater than 662.29 K and 11.27 MPa, respectively, ensure that the reaction is conducted in the homogeneous phase during the entire reaction time. Moreover, the PR-MHV2-UNIQUAC model was applied to construct the predicted phase envelopes for the biodiesel production of sunflower oil with a methanol-to-oil molar ratio of 40:1, as shown inFigure S2 in the Supporting Information. Note that the experimental data derived from the literature and triolein was selected as a single pseudo-triglyceride for representing real sunflower oil.17 The result also shows that the predictions of both reactant and product are in good agreement with the measured data. Therefore, the PR-MHV2-UNIQUAC model can be applied to explore the operating conditions to guarantee that the reaction runs in a single-phase system as far as the reaction proceeds. Moreover, starting from a high-density mixture ensures that the system will not cross into the LV zone during the reaction, which is desirable from a chemical engineering viewpoint, particularly if a continuous process is envisaged.
4. CONCLUSION
In this study, the phase equilibrium of the methanol−palm oil (PO) binary system was experimentally investigated and modeled using several thermodynamic models, including the PR-MHV1-UNIFAC, UNIFAC, and PR-MHV2-UNIQUAC EoS/GE approaches. Tripalmitin was used as the pseudo-triglyceride to represent PO, which was estimated by using group contribution methods, when correlating the experimental data. The PR-MHV2-UNIQUAC model was demonstrated to give the best-fit equilibrium data, with a minimum average absolute relative error of 5.58%. In addition, the PR-MHV2-UNIQUAC model was used to predict the phase behavior during the transesterification reaction of PO to biofuel using SCM. The phase envelope predictions gave a good qualitative agreement with experimental data for both reactants and products obtained using the so-called “isochoric
method”. Therefore, PR-MHV2-UNIQUAC is a suitable model for process design to ensure a single-phase operation in the reactor. To proceed with the feasibility of thermodynamic model for the process design of the biofuel production with SCA, further studies of the entire reaction phase equilibrium data, including the reactant system, intermediates system, and product system, should be envisaged.
■
ASSOCIATED CONTENT*
S Supporting InformationThe Supporting Information is available free of charge on the ACS Publications websiteat DOI:10.1021/acs.iecr.5b04588.
The spectra change in the PO-rich phase with temper-ature at 1 MPa (Figure S1); pressure−temperature (P− T) curves for the methanol and sunflower-oil systems with a molar ratio of 40:1; description of the calculation method used for the single pseudo-triglyceride; the typical fatty acid composition (mole fractions, xi) of commercial palm oil (PO) and the number of CH2(ni)
and CH=CH (mi) functional groups (Table S1); and
experimental and predicted mole fraction of methanol in a PO-rich phase (XMeOH) for phase equilibrium data of
the methanol−tripalmitin binary system and the average absolute relative error (Table S2) (PDF)
■
AUTHOR INFORMATIONCorresponding Author
*Tel.: +6622187678. E-mail:somkiat.n@chula.ac.th.
Notes
The authors declare no competingfinancial interest.
■
ACKNOWLEDGMENTSThis study was sponsored by The Thailand Research Fund (TRF) and Chulalongkorn University, under the Royal Golden Jubilee Ph.D. Program and supported by Franco-Thai Scholar-ship (granted by French Government).
■
NOMENCLATUREList of Abbreviations
EoS = equation of state gE= excess molar Gibbs energy
MHV1 =first-order modified Huron−Vidal mixing rules MHV2 = second-order modified Huron−Vidal mixing rules PR = Peng−Robinson
UNIFAC = universal functional activity coefficient model UNIQUAC = universal quasi-chemical model
List of Symbols
a = energy parameter in the physical term of Peng− Robinson equation of state
b = covolume in Peng−Robinson equation of state Aij, Aji= binary interaction parameter in UNIQUAC model
T = temperature (K) P = pressure (MPa)
qi = van der Waals area in the UNIQUAC formulation ri= van der Waals volume in the UNIQUAC formulation
q1, q2= constants in the MHV2 mixing rules R = universal gas constant
x = mole fraction
Subscripts
c = critical 0 = zero pressure Table 7. Product Composition for the Phase Envelope
Modeling at a Methanol-to-Oil Molar Ratio of 12:1
Product Composition (mole fraction)a
Critical-Point Prediction
conversion (%) TP MeOH FAME GL TC(K) PC(MPa)
10 0.07 0.90 0.02 0.01 528 9.9 20 0.06 0.88 0.05 0.02 539 9.3 30 0.05 0.85 0.07 0.02 560 10.7 50 0.04 0.81 0.12 0.04 601 11.3 80 0.02 0.74 0.18 0.06 638 9.5 100 0.00 0.69 0.23 0.08 662 8.1
aTP is tripalmitin; MeOH is methanol; FAME is methyl palmitate; and GL is glycerol.
i, j = components Greek Letters θ = UNIQUAC parameter τ = UNIQUAC parameter ω = acentric factor Superscripts E = excess
■
REFERENCES(1) Saka, S.; Kusdiana, D. Biodiesel fuel from rapeseed oil as prepared in supercritical methanol. Fuel 2001, 80, 225.
(2) Kusdiana, D.; Saka, S. Effects of water on biodiesel fuel production by supercritical methanol treatment. Bioresour. Technol. 2004, 91, 289.
(3) Xin, J.; Imahara, H.; Saka, S. Oxidation stability of biodiesel fuel as prepared by supercritical methanol. Fuel 2008, 87, 1807.
(4) Demirbaş, A. Biodiesel fuels from vegetable oils via catalytic and non-catalytic supercritical alcohol transesterifications and other methods: A survey. Energy Convers. Manage. 2003, 44, 2093.
(5) Tang, Z.; Du, Z.; Min, E.; Gao, L.; Jiang, T.; Han, B. Phase equilibria of methanol−triolein system at elevated temperature and pressure. Fluid Phase Equilib. 2006, 239, 8.
(6) Shimoyama, Y.; Iwai, Y.; Jin, B. S.; Hirayama, T.; Arai, Y. Measurement and correlation of vapor−liquid equilibria for methanol + methyl laurate and methanol + methyl myristate systems near critical temperature of methanol. Fluid Phase Equilib. 2007, 257, 217.
(7) Fang, T.; Shimoyama, Y.; Abeta, T.; Iwai, Y.; Sasaki, M.; Goto, M. Phase equilibria for the mixtures of supercritical methanol+ C18 methyl esters and supercritical methanol+α-tocopherol. J. Supercrit. Fluids 2008, 47, 140.
(8) Glišić, S.; Montoya, O.; Orlović, A.; Skala, D. Vapor-liquid equilibria of triglycerides−methanol mixtures and their influence on the biodiesel synthesis under supercritical conditions of methanol. J. Serb. Chem. Soc. 2007, 72, 13.
(9) Anikeev, V.; Stepanov, D.; Yermakova, A. Thermodynamics of Phase and Chemical Equilibrium in the Processes of Biodiesel Fuel Synthesis in Subcritical and Supercritical Methanol. Ind. Eng. Chem. Res. 2012, 51, 4783.
(10) Shimoyama, Y.; Abeta, T.; Zhao, L.; Iwai, Y. Measurement and calculation of vapor−liquid equilibria for methanol + glycerol and ethanol + glycerol systems at 493−573 K. Fluid Phase Equilib. 2009, 284, 64.
(11) Sawangkeaw, R.; Satayanon, W.; Bunyakiat, K.; Camy, S.; Condoret, J.-S.; Ngamprasertsith, S. Continuous Production of Biodiesel with Supercritical Methanol: A Simple Compressible Flow Model for Tubular Reactors. Int. J. Chem. React. Eng. 2011, 9, 9.
(12) Shinoj, S.; Visvanathan, R.; Panigrahi, S.; Kochubabu, M. Oil palm fiber (OPF) and its composites: A review. Ind. Crops Prod. 2011, 33, 7.
(13) Sallee, E. M.AOCS Methods Ce 2-66, Ca 2a-47, and Cd 1-25. In Official Methods and Recommended Practices of the American Oil Chemists’ Society, 6th Edition; AOCS Press: Champaign, IL, 2010.
(14) Brunner, G. Gas Extraction: An Introduction to Fundamentals of Supercritical Fluids and the Application to Separation Processes; Springer: New York, 1994.
(15) Camy, S.; Pic, J. S.; Badens, E.; Condoret, J. S. Fluid phase equilibria of the reacting mixture in the dimethyl carbonate synthesis from supercritical CO2. J. Supercrit. Fluids 2003, 25, 19.
(16) Sakdasri, W.; Sawangkeaw, R.; Ngamprasertsith, S. Continuous production of biofuel from refined and used palm olein oil with supercritical methanol at a low molar ratio. Energy Convers. Manage. 2015, 103, 934.
(17) Velez, A.; Hegel, P.; Mabe, G.; Brignole, E. A. Density and Conversion in Biodiesel Production with Supercritical Methanol. Ind. Eng. Chem. Res. 2010, 49, 7666.
(18) Velez, A.; Pereda, S.; Brignole, E. A. Isochoric lines and determination of phase transitions in supercritical reactors. J. Supercrit. Fluids 2010, 55, 643.
(19) Hegel, P.; Mabe, G.; Pereda, S.; Brignole, E. A. Phase Transitions in a Biodiesel Reactor Using Supercritical Methanol. Ind. Eng. Chem. Res. 2007, 46, 6360.
(20) Esteban, B.; Riba, J.-R.; Baquero, G.; Rius, A.; Puig, R. Temperature dependence of density and viscosity of vegetable oils. Biomass Bioenergy 2012, 42, 164.
(21) Foltran, S.; Cloutet, E.; Cramail, H.; Tassaing, T. In situ FTIR investigation of the solubility and swelling of model epoxides in supercritical CO2. J. Supercrit. Fluids 2012, 63, 52.
(22) Oparin, R.; Tassaing, T.; Danten, Y.; Besnard, M. Structural evolution of aqueous NaCl solutions dissolved in supercritical carbon dioxide under isobaric heating by mid and near infrared spectroscopy. J. Chem. Phys. 2005, 122, 094505.
(23) Medina-Gonzalez, Y.; Tassaing, T.; Camy, S.; Condoret, J. S. Phase equilibrium of the CO2/glycerol system: Experimental data by
in situ FT-IR spectroscopy and thermodynamic modeling. J. Supercrit. Fluids 2013, 73, 97.
(24) Peng, D.-Y.; Robinson, D. B. A new two-constant equation of state. Ind. Eng. Chem. Fundam. 1976, 15, 59.
(25) Baudouin, O.; Dechelotte, S.; Guittard, P.; Vacher, A. Simulis® Thermodynamics: An open framework for users and developers. Comput.-Aided Chem. Eng. 2008, 25, 635.
(26) Kontogeorgis, G. M.; Folas, G. K. Thermodynamic Models for Industrial Applications: From Classical and Advanced Mixing Rules to Association Theories; John Wiley & Sons: New York, 2009.
(27) Espinosa, S.; Fornari, T.; Bottini, S. B.; Brignole, E. A. Phase equilibria in mixtures of fatty oils and derivatives with near critical fluids using the GC-EOS model. J. Supercrit. Fluids 2002, 23, 91.
(28) Hegel, P.; Andreatta, A.; Pereda, S.; Bottini, S.; Brignole, E. A. High pressure phase equilibria of supercritical alcohols with triglycerides, fatty esters and cosolvents. Fluid Phase Equilib. 2008, 266, 31.
(29) Richard, D.; Brien, O. Fats and Oils, Formulating and Processing for Applications; CRC Press: Boca Raton, FL, 2004.
(30) Sales-Cruz, M.; Aca-Aca, G.; Sánchez-Daza, O.; López-Arenas, T. Predicting critical properties, density and viscosity of fatty acids, triacylglycerols and methyl esters by group contribution methods. In Proceedings of the 20th European Symposium on Computer Aided Process Engineering; Elsevier BV: Amsterdam, 2010.
(31) Casas, A.; Rodríguez, J. F.; del Peso, G. L.; Rodríguez, R.; Vicente, G.; Carrero, A. Liquid−Liquid Phase Equilibria for Soybean Oil Methanolysis: Experimental, Modeling, and Data Prediction. Ind. Eng. Chem. Res. 2014, 53, 3731.
(32) Likozar, B.; Levec, J. Transesterification of canola, palm, peanut, soybean and sunflower oil with methanol, ethanol, isopropanol, butanol and tert-butanol to biodiesel: Modelling of chemical equilibrium, reaction kinetics and mass transfer based on fatty acid composition. Appl. Energy 2014, 123, 108.
(33) Likozar, B.; Levec, J. Effect of process conditions on equilibrium, reaction kinetics and mass transfer for triglyceride transesterification to biodiesel: Experimental and modeling based on fatty acid composition. Fuel Process. Technol. 2014, 122, 30.
(34) Likozar, B.; Pohar, A.; Levec, J. Transesterification of oil to biodiesel in a continuous tubular reactor with static mixers: Modelling reaction kinetics, mass transfer, scale-up and optimization considering fatty acid composition. Fuel Process. Technol. 2016, 142, 326.
(35) Xu, J.; Liu, Q.; Yan, T.; Wang, Y.; Fang, T. Vapor−Liquid Equilibrium for Methanol + Methyl Palmitate near the Critical Temperature of Methanol. J. Chem. Eng. Data 2016, 61, 1229.
(36) Sawangkeaw, R.; Teeravitud, S.; Piumsomboon, P.; Ngamprasertsith, S. Biofuel production from crude palm oil with supercritical alcohols: Comparative LCA studies. Bioresour. Technol. 2012, 120, 6.
(37) Valle, P.; Velez, A.; Hegel, P.; Mabe, G.; Brignole, E. A. Biodiesel production using supercritical alcohols with a non-edible vegetable oil in a batch reactor. J. Supercrit. Fluids 2010, 54, 61.
(38) Haynes, W. M. CRC Handbook of Chemistry and Physics; CRC Press: Boca Raton, FL, 2013.
(39) Barrufet, M. A.; Eubank, P. T. New physical constraints for fluid mixture equations of state and mixture combining rules. Fluid Phase Equilib. 1987, 37, 223.
(40) Anitescu, G.; Deshpande, A.; Tavlarides, L. L. Integrated Technology for Supercritical Biodiesel Production and Power Cogeneration. Energy Fuels 2008, 22, 1391.
(41) Magnussen, T.; Rasmussen, P.; Fredenslund, A. UNIFAC parameter table for prediction of liquid−liquid equilibriums. Ind. Eng. Chem. Process Des. Dev. 1981, 20, 331.
(42) Simon, R. H. M. Estimation of critical properties of organic compounds by the method of group contributions. A. L. Lyderren. Engineering Experiment Station Report 3. College of Engineering, University of Wisconsin, Madison, Wisconsin (1955). 22 pages. AIChE J. 1956, 2, 12S.