Publisher’s version / Version de l'éditeur:
Cold Regions Science and Technology, 16, July 3, pp. 271-279, 1989-07-01
READ THESE TERMS AND CONDITIONS CAREFULLY BEFORE USING THIS WEBSITE. https://nrc-publications.canada.ca/eng/copyright
Vous avez des questions? Nous pouvons vous aider. Pour communiquer directement avec un auteur, consultez la première page de la revue dans laquelle son article a été publié afin de trouver ses coordonnées. Si vous n’arrivez pas à les repérer, communiquez avec nous à PublicationsArchive-ArchivesPublications@nrc-cnrc.gc.ca.
Questions? Contact the NRC Publications Archive team at
PublicationsArchive-ArchivesPublications@nrc-cnrc.gc.ca. If you wish to email the authors directly, please see the first page of the publication for their contact information.
NRC Publications Archive
Archives des publications du CNRC
This publication could be one of several versions: author’s original, accepted manuscript or the publisher’s version. / La version de cette publication peut être l’une des suivantes : la version prépublication de l’auteur, la version acceptée du manuscrit ou la version de l’éditeur.
Access and use of this website and the material on it are subject to the Terms and Conditions set forth at
A new concept of frost-heave characteristics of soils
Svec, O. J.
https://publications-cnrc.canada.ca/fra/droits
L’accès à ce site Web et l’utilisation de son contenu sont assujettis aux conditions présentées dans le site LISEZ CES CONDITIONS ATTENTIVEMENT AVANT D’UTILISER CE SITE WEB.
NRC Publications Record / Notice d'Archives des publications de CNRC:
https://nrc-publications.canada.ca/eng/view/object/?id=ae787116-0371-4309-a8ee-27b588da90ef https://publications-cnrc.canada.ca/fra/voir/objet/?id=ae787116-0371-4309-a8ee-27b588da90ef--
Ser
T H 1N 2
1
d National ResearchConsel
nationaln
o.
161
7
'
Council Canada de recherches Canadac. 2
BLDG Institute for Research in lnstitut de recherche en
Construction construction
A New Concept of Frost-Heave
Characteristics of Soils
by
0.
J. Svec, 6 r
-
u
Reprinted from
Cold Regions Science and Technology
NRC
-
ClSTiI R C
'I
Vol. 16, No. 3, 1989 p. 271-279
(IRC Paper No. 1617)
L I B R A R Y
N9V
29
1 9 9
~ I ~ L I O T H @ Q U E
I R C
c*. "-
!c18TI
I
---.-.
u C I . L x - - NRCC 30895Canad2
W 3 3 / 6 /
On apporte des am~liorations au concept des essais de susceptibilite
au gel d i n de rendre cornpte des mtcanismes complexes de
soulBvement des sols sous l'effet du gel. Le principal objectif vise est
de definir une meilleure tvaluation, en laboratoire, du potentiel des
sols au niveau soulivement dii
au
gel, en particulier pour la
Cold Regions Science and Technology, 16 ( 1989) 27 1-279
Elsevier Science Publishers B.V., Amsterdam - Printed in The Netherlands
A
N E W C O N C E P T O F FROST-HEAVE CHARACTERISTICS O FSOILS
Otto
J.
SvecInstitute for Research in Construction, National Research Council of Canada, Ottawa, Ont. K 7A OR6 (Canada)
(Received December 5, 1988; revised and accepted February 10, 1989)
ABSTRACT
Improvements are being developed to the concept offrost-susceptibility testing in order to reflect com- plex frost-heaving mechanisms of soils. The main objective is to develop a better laboratory assessment of the frost-heave potential of soils, specifically for road construction applications.
INTRODUCTION
The classification of soils according to their frost- susceptibility has been used in the design of roads and airfields to minimize damage occurring due to frost action. To determine the frost-susceptibility index to a satisfactory level of confidence, addi- tional freezing tests are often required.
Problems with commercial tests stem from re- quirements that the tests must be simple, of short duration and inexpensive. On the other hand, it is very difficult to handle a complex problem by sim- ple means. In fact, such an approach could often lead to erroneous and misleading results.
BACKGROUND
A comprehensive survey of transportation de- partments throughout the world by Chamberlain ( 198 1 ) revealed that most agencies are using their own unique frost-susceptibility criteria. In addi- tion, freezing tests employed for this purpose are poorly designed and executed; only frost heave or thaw weakening, rather than both, are considered. As a result, the frost-susceptibility index does not
represent the actual heaving or thaw-weakening po- tential, particularly for marginally frost-susceptible soils. Recognizing this problem, Chamberlain
(1987), of the Cold Regions Research and Engi- neering Laboratory (CRREL), developed and pro- posed a new five-day freezing test. Its main feature, other than improved equipment and data acquisi- tion and control, is that it requires two freeze-thaw cycles and the California Bearing Ratio (CBR) test. The frost-susceptibility index is then defined as the heave rate at the end of the first eight hours of each two-day freeze-thaw cycle. The repetition of the freeze-thaw cycle accounts for the changes in sus- ceptibility to frost heave in frost virgin material. The CBR test, which is performed after the second thaw, yields the thaw-weakening index. The important feature of this new test is that the results of both tests are then used to determine the frost-heave potential.
NEEDS AND OBJECTIVES
The drawback of all tests used today is that the thermal boundary conditions are chosen not be- cause they reflect the freezing conditions in the ground as they occur in nature, but rather to pro- vide a convenient testing procedure. For example, the temperature gradient used in the newest CRREL freezing tests is 0.4 "C cm-
'.
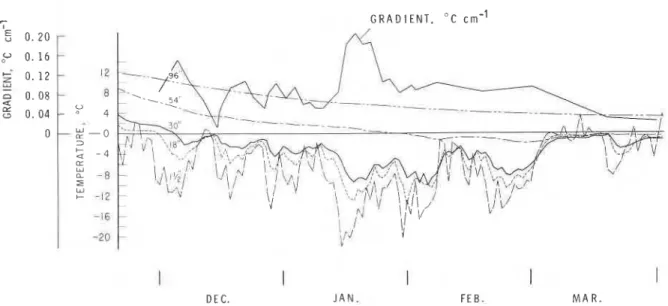
Such high gradients do not occur in nature frequently and, moreover, if they do, are only of short duration. This claim is supported in Fig. 1. The figure shows temperatures at several depths under the centreline of a street in Sudbury, Ontario (Penner, 1966), as well as the temperature gradient in the subgrade across the 0" CI
I
I
I
I
D E C. J A N . F E B . M A R .
Fig. 1. Temperature distribution and the gradient across 0°C isotherm in the soil under a street in Sudbury, Ontario - typical winter conditions.
isotherm. It is apparent that an interval between 0.0
and 0.15 "C cm-
'
would cover the entire winter pe-riod. Similar gradients were calculated from obser-
vations by Penner ( 1967), describing an experi-
mental project
-
an insulated roadway located onthe NRC Campus in Ottawa.
Another argument supporting the need for a bet- ter testing procedure can be put forward: the frost- heave rate in standard tests is usually calculated at a time in the test that is specified to suit the working environment. Because the frost-heave function has a logarithmic shape, and because the point on this curve where the frost-heave rate is calculated, is chosen rather arbitrarily (based on the number of hours of a working day) the resulting frost-suscep- tibility index might not represent the worst poten- tial to heave. Moreover, the argument that such a procedure would provide a relative index does not hold either, because the heave function has differ- ent characteristics for different soils. In other words, as the temperature gradient changes during a stan- dard frost-heave test, so does the rate of the heave. In spite of the above comments, it has to be recog- nized that the new CRREL freezing test represents a significant step forward in the difficult process of improving frost-heave testing for road construction. This paper presents initial results of a study that
may lead to the development of an advanced frost- susceptibility testing procedure. The proposed test is based on more realistic assumptions and should be able to determine the worst frost-heave condi- tions for a particular soil. The new procedure will require better laboratory equipment but it could re- sult in a shorter test duration. Since the influence of load on frost heave in a road application can be considered negligible, the role of overburden pres- sure is not discussed in this paper.
ICE-LENS FORMATION
Frost heave in soils has been studied since the late twenties. Even the first experiments demonstrated that frost heave is caused not only by freezing of in- situ pore water but also by freezing of the migratory water. The latter process is known as ice segregation and is characterized by the growth of ice lenses at the "segregation" freezing temperature, which is a few tenths of a degree below the freezing point. The water flow towards an ice lens is induced by suction pressures developed within the "freezing fringe", a partly frozen zone between the zero-degree iso- therm and the growing ice lens.
sonably well understood, but their quantitative de- scription and prediction is not yet possible. This is mainly due to difficulties in obtaining adequate ex- perimental measurements and verification. The de- scription below gives some insight into this problem.
RYTHMIC ICE-LENSING
It has been demonstrated by many researchers that pore-water migration depends on the capillary characteristics of a particular soil, chemical poten- tial, osmotic forces, pneumatic and elevation heads, overburden pressure, etc., and that the main agent generating the suction potential is the change in the adsorbed water layer surrounding the soil particles. As this water layer freezes and becomes thinner, a negative pressure within the layer is generated. It has been commonly assumed that the water con- tent, suction pressure and soil hydraulic conductiv- ity vary exponentially in the freezing fringe. During the growth of an ice lens the segregation tempera- ture as well as the ice-lens location remain constant due to the release of latent heat. The zero-degree isotherm, however, moves as continuing cooling takes place. Consequently, the width of the freezing fringe increases and, therefore, the overall "effec- tive" hydraulic conductivity decreases. The water flow towards the ice lens can be calculated as a product of the hydraulic conductivity and the suc- tion potential. Since the suction potential remains more or less constant, it is the low hydraulic con- ductivity and the "long" path through the freezing fringe that will eventually retard the water move- ment. At such a time, the lack of latent heat at the ice-lens surface will result in a fast freezing. During this process, only the in-situ water will change phase. This is possible because the cold part of the freezing fringe has been partially depleted of water. The en- tire fringe then moves further, with continuing cooling until a new segregation location, with suit- able thermal and hydraulic conditions, develops.
TEMPERATURE GRADIENT
The above description of the segregation process can also explain the important influence of the tem-
perature gradient on the rate of heave. The segre- gation temperature, i.e. the temperature of the growing ice lens on its active boundary, can be con- sidered constant with respect to changes in the tem- perature gradient (Konrad and Morgenstern, 1980). This temperature is unique for a given soil, i.e. it depends on soil type, percentage of fines, porosity, etc., and certainly on the overburden pressure. Therefore, the segregation temperature is depen- dent on suction pressures in the adsorbed water lay- ers or, in other words, on the waterlice pressure dif- ferential which can be described by the Clausius/ Clapeyron equation:
where ATis the segregation temperature (i.e. differ- ence between the freezing point of water and the temperature of the growing ice lens, P is the pres-
sure, p is the density, To is the absolute temperature
of the waterlice transition, and subscripts "w" and "i" refer to water and ice respectively.
The total suction potential can be calculated from Eq. 1:
This equation is valid only for solute-free water and at steady thermodynamic equilibrium. If an equiv- alent hydraulic conductivity, K , can be assumed in the freezing fringe, then the rate of water migration, v, can be calculated from Darcy's law:
where: Po is the suction potential at the frozenlun- frozen interface, and d is the thickness of the freez- ing fringe. Since the segregation temperature is in- dependent of the temperature gradient, both the hydraulic conductivity and the suction potential are functions of temperature only. Thus the water flow towards the growing ice lens and the heave rate are functions of the depth of the freezing fringe, d, i.e. a function of the path the water has to migrate through.
274
SEGREGATION POTENTIAL
Instead of using the complex factors present in Eq.
3 and because there are serious difficulties associ- ated with their determination, Konrad and Mor- genstern ( 198 1 ) proposed an engineering parame- ter called "Segregation Potential", SP. The definition of SP is based on their experimental ob- servation: at the time of formation of the final ice lens, the flow of water, v, is proportional to the ther- mal gradient in the frozen soil, so:
Konrad and Morgenstern ( 198 1 ) considered the influence of rate of cooling on SP and concluded that it is not appreciable. It will be demonstrated below that this assumption is not always valid. If the influ- ence of cooling is analyzed as an effect of tempera- ture gradient and the frost penetration as two inde- pendent variables, i.e.:
where X is the frost penetration; then the impor- tance of the rate of cooling can be observed.
RATE OF COOLING
The importance of the rate of cooling can be ex- plained as follows: at a constant temperature gra- dient, a T / d z , the rate of frost penetration is di- rectly proportional to the rate of cooling. At low cooling (i.e. frost-penetration) rates, once the ice- segregation site is established, the rate of heave is also low because the freezing fringe is very thick. The low frost-penetration rates do not act to force the segregation site to relocate. As well, the latent heat is able to keep the thermodynamic processes relatively steady. The amount of time required to relocate the ice-segregation site (i.e. start of a new ice lens) is relatively very long. In the middle range of frost-penetration rates, the above process is faster which, in a dynamic sense, allows a thinner freezing fringe to form. Moreover, the segregation tempera- ture decreases with the increase in penetration rate (Konrad, 1989 )
.
A thinner freezing fringe accom- panied by a lower segregation temperature will re-sult in a higher rate of heave. In the high range of frost-penetration rates, the freezing process be- comes so fast that there is not enough time to estab- lish significant water flow between successive loca- tions of ice segregation sites. As a result, the heave rate must decrease.
RAMPING TEST
In the vast majority of experimental freezing tests, the one-step freezing technique, with constant, one- step boundary conditions, is used. The disadvan- tage of this test was discussed above. The testing procedure proposed here is based on the so-called "ramping" technique, first introduced by Myrick et al. ( 1982) and later by Penner and Eldred ( 1985 ).
With this technique, the temperature at the cold and warm ends of the sample are simultaneously de- creased according to a pre-programmed function. If the temperatures of both ends follow the same lin- ear function of time, a "ramp", then the frost heave vs. time will also be a straight line. The rate of heave then clearly becomes a constant. In other words, a constant cooling rate results in a constant heave-rate. It is shown below that the rate of heave, however, is highly dependent on cooling rate.
The presented technique, which takes advantage of the above fact, is an attempt to predict the frost heave characteristics of a particular type of soil in the worst conditions.
EXPERIMENTAL APPARATUS
The frost heave cell (Fig. 2 ) used in this study was developed by W.A. Slusarchuck of Hardy and Associates, and later significantly modified by E.
Penner and D. Eldred ( 1985) of the National Re-
search Council of Canada. In addition, the freezing experimental procedure is now fully computer con- trolled with automatic data acquisition and pro- cessing. All the freezing tests are run unattended ex- cept during the start-up.
Because a detailed description of the freezing cell can be found in Penner ( 1986), only its main fea- tures will be mentioned in this paper. The freezing of the soil sample proceeds from the bottom up. The
WGKR SUPPLY +ro SAMPLE
HEAVE TRANSFER PIPE
4
I-
-
COLD S Z ' - 'SPIRAL COOLING GROOVE COOLING L l O U l DFig. 2. NRC freezing cell.
main advantage of such an arrangement is the re- duction in side friction along the Teflon-coated wall of the unfrozen part of the specimen. This proce- dure works very well for fine-grained soils, but for coarse-grained dirty gravels that may be considered for the subbase of roads, modifications will be re- quired. All the thermistors used in the cell for both data acquisition and experiment control are indi- vidually calibrated with an overall error of less then 0.005 "C. A direct-current displacement transducer is used for measurements of total heave with an ac- curacy of k0.002 mm. The water intake, due to suction induced by freezing, is measured by a com- puter-monitored electronic scale. Its sensitivity is in the order of
+
0.3 cm3, which is equivalent to k 0.01 mm of frost heave. The warm and cold tempera-tures of the side boundaries are controlled by cir- culating brine through heat exchangers in the cell. The temperature of the brine is conditioned by re- frigerated liquid baths and computer controlled with a minimal increment of 0.005"C day-'. Any pre- scribed functions can be imposed as these two boundary conditions. Linearly decreasing tempera- tures ("ramping"), have been used for all of the ex- periments performed in this study. The major ad- vantage of this method is that the resulting frost- heave function, except at the initial stage, is a straight line.
The freezing cell is placed inside an environmen- tal chamber. A steady temperature in the chamber is provided by air circulation, and controlled at about k 0.1 " C. The constant temperature environ-
ment around the cell is important for minimizing horizontal heat-flow from the sample as well as any other thermal fluctuations.
In order to determine the location and tempera- ture of the growing ice lens, a portable Philips 200 KV X-ray generator is employed. Svec (1986) found that by using a computer-image analyzer, the locations of ice lenses, their temperatures, and their development, can be better observed and evaluated.
FREEZING TEST PROCEDURE
Soil samples are prepared from a slurry (about 2% above the liquid limit moisture content) by consolidating the sample under 400 kPa vertical stress and allowing it to rebound under 20 kPa. The prepared sample consists of a 2.5 cm saturated sand layer (Ottawa sand C-109) above the cold side o- verlain by a 7.5 cm thick layer of the test soil. Be- fore the test can begin, a required thermal gradient has to be established. The sand layer plays an im- portant role in this task, as explained below. In all of the tests reported in this paper, the O.O°C iso- therm coincides with the sandlsoil interface.
Fine-grained saturated soils must be consider- ably supercooled in order to initiate ice crystalliza- tion. Normally a third temperature bath, set at
-
10°C, is used to provide fast supercooling of the cold side of the sample. As the temperature of the cold side slowly decreases, a detailed direct temper- ature monitoring (on the PC screen) is underway. As soon as the crystallization begins, characterized by rapid temperature rise due to the release of the latent heat, the circulation of supercooling liquid is stopped. Because deep supercooling must be used to initiate crystallization, and because the required testing temperature gradient is very small (0.035 and 0.05 "C cm-' ), a sample without a sand layer requires a long stabilization time. If the sand layer is used at the bottom of the sample (the cold side), the gradient can be established before the crystalli- zation and the sand layer can be frozen with little disturbance. Once the ice crystals are present in the sand layer, supercooling will not occur.Two sets of tests were performed based on two constant temperature gradients: 0.035 and 0.05"C cm-
'.
Additional tests with higher temperature gra-dients up to 0.15 or 0.20°C cm-' will be under- taken in the near future.
RESULTS
All the tests were done using the same soil, clas- sified as clayey silt with a trace of sand. The grain- size distribution curve for the soil is shown in Fig. 3. The first set of experiments using a constant gra- dient of 0.035" C was done using the same sample. After each test, this sample was mechanically and thermally reconditioned. In other words, after each test the sample was thawed, consolidated again by the pressure of 400 kPa and allowed to rebound at the testing pressure of 20 kPa. In this manner the initial conditions of individual tests nearly exactly matched, in a mechanical sense, the initial condi- tions of the original sample. In fact, after the entire set was completed, the initial height of the sample ( 10.0 cm) was only 0.2 mm smaller and the differ- ence in water content was within 1%. It has to be pointed out, however, that for soils containing sig- nificant clay fines, the soil frost-heave characteris- tics after one freeze will not be exactly the same as before freezing. The tests were done in more or less random order as far as cooling rates progression is concerned (see the test numbers in Fig. 4).
It can be seen that both the frost-heave rate and the Segregation Potential, SP, are functions of the cooling rate. As shown in Fig. 4, the heave-rate function has a distinct peak (0.73 mm day-
'
), after which the heave rate drops to zero. The freezing fringe (the zone that water has to traverse to feed the ice-lens growth) at this gradient is very thick. Therefore, not only is the heave rate relatively low with respect to higher gradients as shown below, but also the entire active period (the cooling range) is short.For the second set of experiments a 0.05 "C cm-
'
gradient was chosen. It was also decided that a fresh sample would be prepared for each individual test. On several occasions, however, the second test was performed to see whether the freezelthaw cycle will be a necessity in the future. It was concluded (based on two cycle tests) that a fast freezelthaw cycle should be performed before a "valid" test. Since a road structure and its subgrade are subjected to sea-I
E O U I V A L E N T G R A I N D I A M E T E R (MU)I
NO. OF MESHES PER. I N ( U S.S S I E V E S E R I E S )/
S I Z E OF O P E N I N G (IN>]G R A I N S J Z E (MMJ
C L A Y
1
F I N E S I L T c o ~ n s c ~ I N C S A N D c o ~ a s r C ~ U E[
GRAVEL c o ~ n s rFig. 3. Grain-size distribution curve of soil used for this study.
I I sonal freezing and thawing, at least a two-cycle test
Fig. 4. Heave rate vs. cooling rate (penetration rate) - test series I with temperature gradient of 0.035"C cm-
'.
is justified.
Figure 5 shows results of the second set based on the 0.05"C gradient. Results on Fig. 5 are qualita- tively very similar to those on Fig. 4 (0.035"C
cm- 'gradient) except that: ( 1 ) the cooling range is
much larger; ( 2 ) the heave rate is significantly higher; and (3) the entire function is not as dra- matic as in the case of the 0.035"C gradient. The peak heave-rate reached 3.4 mm day-', almost a fivefold increase over the 0.73 mm day-' observed for the 0.05 "C temperature gradient. These results clearly demonstrate that the cooling rate as a func- tion of temperature gradient as well as the frost- penetration rate are all key factors in frost-suscep- tibility testing.
PROPOSED FROST-SUSCEPTIBILITY TEST Based on these initial results the author is propos- ing the following concept for frost-heave suscepti-
C O O L I N G R A T E , " C d a y - '
Fig. 5. Heave rate vs. cooling rate (penetration rate)
-
test series I1 with temperature gradient of 0.05 "C cm-'.bility testing of soils for the road construction industry.
Similar testing as described above, i.e. sets of ex- periments based on constant temperature gra- dients, e.g. 0.05, 0.10, 0.15 and 0.20°C cm-', and increasing cooling (frost-penetration) rates will be performed for major soil types. For each type, a set of four functions (or more, depending on the num- ber of selected gradients), will be generated. These functions, whose form will be similar to those in Figs. 4 and 5, will then be assembled into a three- dimensional graph. Using splines or some other ex- trapolation technique, a 3-D surface envelope will then be constructed (see Fig. 6). By selecting a thermal gradient and cooling rate that would lead to the worst frost-heaving conditions, a proper freezing test will be designed. The resulting peak heave-rate, as well as the peak SP of a particular soil belonging to a major soil type, will represent its highest possible potential to heave, and will be called the "Critical Segregation Potential", CSP. In addi- tion, the information shown in Fig. 6, together with thermal numerical analysis, could be used to esti- mate the total heave for a particular site and design. Similarly, as suggested by Chamberlain ( 1987), the freezing test should consist of two freezelthaw cycles, followed by a CBR test.
6T
-
SZ
r CSP
Fig. 6. Envisaged 3-D envelope (heave rate h, cooling rate T, temperature gradient aT / a z - the data base) for a particular soil group.
DISCUSSION
It is obvious that to introduce this new advanced technique to engineering practice will require gen- erating the data base. The data base (the 3-D charts) will include experimental results performed only on major soil groups, i.e. will reflect behaviour of a typical representative soil type. It is expected that the differences (in gradients and cooling rates rep- resenting the peak heave-rate region) among spe-
cific soils within a major soil group, will not be sub- stantial. This information will serve in selecting the required test conditions. In addition, the data base together with a mathematical model could be used for frost-heave predictions in a particular site.
The advantages of the above described procedure are:
-
Selected conditions (the temperature gradient and the cooling rate, i.e. "ramping") from 3-D charts will ensure detection of the highest possi-ble potential for heave. By the same token, this method will allow estimation of actual frost heave under specific site and environmental conditions.
-
The resulting frost heave is independent of thetimes at which the calculation is done, because
the frost-heave function in the proposed test is a straight line (except during the initial period).
-
The selected test will be justifiably fast and ofshort duration because there is experimental evi- dence that the peak heave-rate occurs at higher cooling rates.
Other than the generation of the data base, there is only one disadvantage: the proposed test requires more sophisticated equipment. This minor disad- vantage should be weighed against the fact that de- cisions based on the determination of the frost-sus- ceptibility of subgrade soils and materials used in road construction, have a significant influence on the huge expenditures for maintaining and further developing Canada's road infrastructure.
SUMMARY
An advanced experimental technique for deter- mining maximum frost-heave potential is pre- sented. Based on the experimental evidence from two series of tests, a new method for determining frost-susceptibility has been proposed. This study is only the first phase of the author's research pro- gram and should serve to stimulate discussion in re- search and user communities.
ACKNOWLEDGEMENT
The author wishes to acknowledge the dedicated technical assistance of Mr. D.E. Eldred in carrying out these studies. This paper is a contribution from the Institute for Research in Construction of the National Research Council of Canada.
REFERENCES
Chamberlain, E.J., 1981. Frost susceptibility of soil, review of index tests. CRREL Monogr., 81-2.
Chamberlain, E.J., 1987. A freeze-thaw test to determine the frost susceptibility of soils. CRREL, Spec. Rep. 87-1. Konrad, J.-M., 1989. Influence of cooling rate on the temper-
ature of ice lens formation in dayey silts. Cold. Reg. Sci.
Technol., 16( 1 ): 25-36.
Konrad, J.-M. and Morgenstern, N.R., 1980. A mechanistic theory of ice lens formation in fine-grained soils. Can. Geotech. J., 17 (4): 473-486.
Konrad, J.-M. and Morgenstern, N.R., 198 1. The segregation potential of freezing soil. Can. Geotech. J., 18 (4): 482- 491.
Myrick, J.E., Issacs, R.M., Liu, C.Y. and Luce, R.G., 1982. The frost heave program of the Alaskan natural gas trans- portation system. Presented at ASME Conf., Phoenix, Ariz.
Penner, E., 1967. Experimental pavement structures insu-
lated with a polyurethane and extruded polystyrene foam. Proc. Int. Conf. Low Temperature Science, 1966, Sap- poro, Japan, Vol. 1 (2): 131 1-1322.
Penner, E., 1986. Aspects of ice lens growth in soils. Cold Reg. Sci. Technol., 13 (1): 91-100.
Penner, E. and Eldred, D., 1985. Equipment and methods for soil frost action studies. Natl. Res. Counc. Canada, Div. Building Res. Intern. Rep. 503.
Penner, E., Oosterbaan, M.O. and Rodman, R.W., 1966. Per- formance of city pavement structures containing foamed plastic insulation. Highway Res. Rec. No. 128, H.R.B., Washington, D.C.
Svec, O.J., 1986. Performance of a frost heave cell for low-
temperature-gradient experiments. Proc. 5th Int. Off-
shore Mechanics and Arctic Engineering OMAE Symp., 1986, Tokyo, Vol. IV.