HAL Id: hal-02960471
https://hal.archives-ouvertes.fr/hal-02960471
Submitted on 7 Oct 2020
HAL is a multi-disciplinary open access
archive for the deposit and dissemination of sci-entific research documents, whether they are pub-lished or not. The documents may come from teaching and research institutions in France or abroad, or from public or private research centers.
L’archive ouverte pluridisciplinaire HAL, est destinée au dépôt et à la diffusion de documents scientifiques de niveau recherche, publiés ou non, émanant des établissements d’enseignement et de recherche français ou étrangers, des laboratoires publics ou privés.
Pearl-necklace assembly of Human serum albumin with
poly (acrylic acid) polyelectrolyte explored by small
angle X-ray scattering (SAXS)
Charaf Eddine Merzougui, Pierre Roblin, Pierre Aimar, Antoine Venault,
Yung Chang, Christel Causserand, Patrice Bacchin
To cite this version:
Charaf Eddine Merzougui, Pierre Roblin, Pierre Aimar, Antoine Venault, Yung Chang, et al.. Pearl-necklace assembly of Human serum albumin with poly (acrylic acid) polyelectrolyte ex-plored by small angle X-ray scattering (SAXS). Soft Matter, Royal Society of Chemistry, inPress, �10.1039/D0SM01221A�. �hal-02960471�
OATAO is an open access repository that collects the work of Toulouse researchers and makes it freely available over the web where possible
Any correspondence concerning this service should be sent
to the repository administrator: tech-oatao@listes-diff.inp-toulouse.fr
This is an author’s version published in: http://oatao.univ-toulouse.fr/ 26697
To cite this version:
Merzougui, Charaf Eddine and Roblin, Pierre and Aimar, Pierre and Venault, Antoine and Chang, Yung and Causserand, Christel and Bacchin, Patrice Pearl-necklace assembly of Human serum albumin with poly
(acrylic acid) polyelectrolyte explored by small angle X-ray scattering (SAXS). (2020) Soft Matter. ISSN 1744-683X
Official URL : https://doi.org/10.1039/D0SM01221A
Pearl-necklace assembly of Human serum
albumin with poly (acrylic acid)
polyelectrolyte
explored
by small angle X-ray
scattering (SAXS)
Charaf E. Merzougui §*, Pierre Roblin §*, Pierre Aimar §, Antoine Venault ∥, Yung
Chang ∥, Christel Causserand §, Patrice Bacchin §1
In this comprehensive study, interaction of human serum albumin (HSA) with poly(acrylic acid) (PAA) was explored using Small Angle X-ray Scattering (SAXS) combined to chromatography. Results revealed the formation of a complex between HSA macromolecules and PAA chains but solely at some specific conditions of ionic strength and pH of the medium. In fact, this binding has found to take place only at pH close to 5 and low ionic strength (0.15M). Otherwise, for higher pH and salts concentration 0.75M the HSA-PAA complex tends to dissociate completely showing the reversibility of the complexation. The assessment of the influence of the HSA/PAA molar ratio on the complex radius of gyration suggests that 4 HSA molecules could bind to each PAA 100kDa chain. Besides the Porod volume evaluation for the same range of HSA/PAA ratio confirms this assumption. Finally, an all atom SAXS modelling study using BUNCH program has been conducted to find a compatible model that fit HSA-PAA complex scattering data. This model allows to portray the HSA/PAA complex as a pear-necklace assembly with 4 HSA on the 100 kDa PAA chain.
Introduction
Interactions between proteins and polymeric surfaces, whether linear (polyelectrolyte brushes)1,2 or spherical (functional nanoparticles) 3–5, have
§Laboratoire de Génie Chimique, Université de Toulouse, CNRS, INPT, UPS, Toulouse, France ∥ R&D Center for Membrane Technology, Chung Yuan Christian University, Chung Li, Taiwan
received growing attention over the past few decades. Many processes involve this phenomenon in several fields and for versatile applications, as protein separation 5,6, drugs delivery 7,8, ligands uptake 9, enzyme immobilization 10, antibacterial
encapsulation 11, among many other applications in chemistry and biology 12.
Biomaterials and medical devices design are among the fields in which this interaction is relevant 13,14. Biomaterials are often used for the treatment of diseases such as cardiac failure, but also in medical applications such as wound healing, deep skin injury repair, dentistry or orthopedics 15. In many cases, these biomaterials get into direct contact with blood. One of the fastest growing areas for biomaterials is the development of new systems for controlled and targeted drug delivery. For example, suitable membrane advanced technologies could be proposed to address several critical needs related to blood cells screening and the concentration of the growth factors stored inside the granules of platelets and expressed after their activation, and which role in the wound healing process of diabetic ulcers is predominant. For that, the architecture of membrane biointerface at the nanoscale is often customized by grafting on it some functional groups such as poly acrylic acid (PAA). It is a negatively charged bioactive polymer in aqueous medium widely used to modify polymeric surfaces for drugs release and many other applications16. One of them is the enhancement of platelets adhesion, especially when it’s conjugated to proteins such as fibrinogen. However, nonspecific interactions between other blood components and polymers used for interface modification could hamper the capture of platelets. Among those blood components, Human Serum Albumin (HSA) is an abundant plasma protein ([HSA]≈42mg.mL-1 in blood 17) that maintains the blood pH and osmotic pressure and transports some molecules in the blood. This protein is able to decrease platelet adhesion and activation on a solid surface by being adsorbed onto that particular surface 18. Therefore, in the purpose of designing functionalized membrane surfaces to selectively separate thrombocytes from other blood cells, the control of these nonspecific interactions is required.
According to the literature, a number of protein-polyelectrolyte complexes have been studied in a variety of physicochemical conditions via several analytical techniques 19,20. Concerning complexes of serum albumin and polymers, the interaction of bovine serum albumin (BSA) with spherical polyelectrolyte brushes in solution was evidenced using Small Angle X-ray and neutron scattering
(SAXS and SANS) 21,22. Interactions between BSA and planar synthetized poly(acrylic acid) were also the object of a dedicated work 23. Furthermore, binding of HSA with small polyelectrolyte brushes of PAA (with 25 repeating units only) 25, and with dendritic polyglycerol sulfate 26, has also been discussed by isothermal calorimetry (ITC). In fact, it has been proved that only one HSA is bound per chain of PAA 1.8 kDa. Then, for a pH maintained at 7.2, a study on the effect of salt concentration revealed that this binding was dominated by an attractive electrostatic potential between the two solutes 24. Using Total Internal Reflection Fluorescence (TIRF) spectroscopy, it also has been proven that negatively charged BSA is strongly adsorbed on planar PAA (278 AA units ≈20kDa) at low ionic strength and pH > 5 due to electrostatic interactions 26. However, the current knowledge does not permit to give the exact stoichiometry of the polyelectrolyte-protein complexes for larger polymer, and if it is correlated to the size of the polyelectrolyte.
In the present study, we used SAXS combined to chromatography to assess the affinity of HSA to bind to a larger PAA (100 kDa) to check out the formation of multiprotein-polymer complexes compared to the 1HSA-1PAA binding reported in the literature using smaller polyelectrolyte 24. First, as a starting point for further experiment with polymers, the structure of native HSA was examined in Phosphate buffer solution. Then, the HSA/PAA complexation was studied in media with different ionic strengths or pH in order to find the conditions leading to an attractive interaction. After that, a detailed study modeling the Porod volume was conducted to determine the stoichiometry of the (nHSA-PAA) complex formed. For this purpose, the influence of the HSA/PAA molar ratio on the complex size (radius of gyration and Porod volume) was appraised. Eventually, a compatible model has been found using BUNCH program 27 to fit the HSA-PAA complex scattering data. It allowed us to propose an all atoms pearl necklace model that describes the structure of complex at the ionic strength and at the pH outlined in the preceding paragraphs, and it also validated the proposed stoichiometry.
3
Experimental section
Materials and sample preparation
Human serum albumin (HSA, lyophilized powder, ≥96% agarose gel electrophoresis) with a molecular weight of 66,478 g.mol-1 was purchased from Sigma Aldrich and used as received, as well as the poly acrylic acid (PAA) of molecular weight around 100,000 g.mol-1 (35 wt. % in H2O).
HSA powder was dissolved in PBS 1X (0.012M phosphate buffer solution at pH 7.4, ionic strength 0.137M) to obtain a stock solution of 50 g.L-1 HSA (750 µM), from which samples of lower concentration were prepared. The same way, the polymer solutions were prepared by dilution in PBS 1X buffer from a stock PBS solution of 100 g.L-1 PAA (1 mM).
For the investigation of native HSA structure in solution and HSA-PAA interaction, the concentration of the HSA was set at 5 g.L-1 to avoid repulsion between particles which can distort the measured intensity in small angles. The pH effect was studied using different buffer solutions at 0.1 M (TRIS base pH 8, HEPES pH 7, MES pH 6, mixture of sodium citrate di-hydrate and citric acid at pH 4-5). As for the ionic strength influence, the salts concentration was adjusted by adding the needed amounts of 4 M NaCl solution.
Then, all samples, whether protein free, polymer free or a mixture of both, were stirred using a Thermo Scientific mini centrifuge (mySPIN 12) at 10 000 rpm for 2 minutes at least, to ensure good dissolution of the solutes, before being pipetted into the samples holder for the SAXS measurement. Out of use, the samples were stored at 4°C in a refrigerator.
Chromatography measurement
The chromatography unit used consisted of an Agilent 1260 infinity system connected to a UV-VIS detector set at a wavelength of 280 nm. Analyses were performed using an Agilent Bio Sec-3 (3µm, 4.6x300 mm, 300 Å) size exclusion column at room temperature. In a typical analytical run, 50µL of a 75µM protein solution was injected, and PBS 1X was used as mobile phase for protein structure investigation at a flow rate of 0.4 ml.min-1. As for protein-polymer complexation study, a 75µM HSA+ 50µM PAA solution was injected and the mobile phase was PBS solution containing 50 µM PAA.
SAXS measurement
SAXS measurements were performed at Laboratoire de Genie Chimique, Toulouse, on the XEUSS 2.0 bench equipped with a copper internal source (Genix3D) that produces an X-ray beam with an energy of 8 keV and a flow of 30.106 ph. mm².s-1 with a beam sized at 500x500 μm. The SAXS bench is equipped with an HPLC online (Agilent 1260 infinity) connected to the SAXS cell allowing to add a purification step by size exclusion chromatography. In direct injection mode, that is, without size exclusion chromatography step, 50 µL of sample are pipetted from the samples holder maintained at a constant temperature (20 °C) using a circulating water bath, and are injected to the measurement cell placed under vacuum to limit air absorption. Data were collected on a 150x150 mm area DECTRIS detector (Pilatus 1M) with a sample to detector distance of 1216 mm. The scattering intensity I(q) experimentally determined is expressed as a function of the scattering vector q (in Å-1) resulting from a photon of wavelength λ scattering off the sample at an angle 2θ.
𝑞 =4𝜋 𝑠𝑖𝑛(𝜃)
𝜆 (1)
Each scattering curve reported in this paper is an average of at least 6 measurements on the same sample, and each SAXS measure corresponds to a data collection time of 1800s. Scattering curves were recorded within the range 0.005 < q < 0.5 Å-1. Finally, actual solutes scattering intensity I(q) was obtained by subtracting the buffer solution contribution from the total SAXS signal.
Porod volume calculation
From SAXS experiments, it is possible to obtain the Porod volume of an object from the Porod invariant Q 28 : 𝑉𝑜𝑏𝑗 =2𝜋 2𝐼(0) 𝑄 ∗ 1 − 𝜙 𝑆(0) (2)
When the dispersion is diluted the volume fraction 𝜙 → 0, 𝑆(0) → 1 and the Porod volume can be determined by knowing the zero angle intensity I(0) and Q.
Q is called the Porod invariant because its value
does not depend on the structure but on the volume fraction and the contrast between two phases Δ𝜌 : 𝑄 = ∫ 𝑞2(𝐼(𝑞) − 𝐾)𝑑𝑞
∞ 0
Where K is a constant defined to ensure the asymptotical intensity decay proportional to q-4 at higher angles 29.
The value of Q can be roughly obtained from the integration of the Kratky plot (classically with a limited integration boundary at q=0.25) by considering K=0:
𝑄 = ∫ 𝑞2𝐼(𝑞)𝑑𝑞 0.25
0
(4) When the intensity decreases too slowly at large q (less than q-3) as for polymeric systems 30 it is well more accurate to integrate the original equation after determining the constant K. Whereby the constant K is calculated from the Porod asymptote I(q). q4 versus q4 at higher angles. In these calculations, the asymptote has been always determined for the same range of q between 0.3 and 0.445 with a homemade code to keep the control of the calculation. The code is given with the plots that shows the determination
of K (Fig. 4-5) in Supplementary Information
SI-2, as well as the corrected dimensionless Kratky plot
obtained by subtracting K from I(q), (Fig. 6 in SI-2). It can be seen that the subtraction of the asymptote
K leads to a curve that tends to zero for high q which
then permit a good integration of the invariant Q.
Results and discussion
Study of single HSA
The structure of native HSA was first examined in a 0.012M phosphate buffer solution at pH 7.4, and the obtained SAXS scattering intensities were compared to those calculated from the crystal data of HSA on the Protein Data Bank (6EZQ). In order to guarantee the absence of aggregates in the investigated samples, an Agilent chromatographic system is coupled upstream of the SAXS.
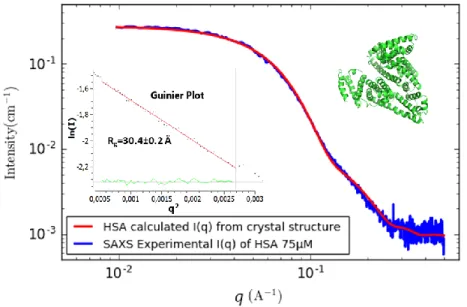
Figure 1. Experimental SAXS scattering intensity I(q) of HSA 75 µM (blue line) compared to the SAXS intensity calculated with CRYSOL from HSA crystal structure 6EZQ (red curve). The inset represents the Guinier plot (Ln I(q) vs q2 in red line) with the
residual (green curve) that allow to determine the radius gyration using Primus. The HSA 3D structure shown in cartoon representation using PyMOL software.
Figure 1 shows that the experimental SAXS spectrum from purified commercial HSA (blue line) matches very well the calculated intensity from the crystal structure (red line), evidencing that the HSA used for this study is correctly folded at 75 µM in the PBS buffer condition. These preliminary results validate the use of HSA as a template to study protein polymer interaction. In these conditions we
can expect that the SAXS will be precise enough to sense an interaction between HSA and PAA.
The HSA radius of gyration Rg was then evaluated by fits using Foxtrot or Primus 28,31 Both software consider the Guinier approximation that allows to determine Rg from the slope of the linear fit at low q of I(q) vs q2 (Figure 1), as it gives the forward
scattering intensity I(0) from the intercept based on the following equation:
lim 𝑞→0𝐼 = 𝐼0𝑒𝑥𝑝 (− 1 3𝑞 2𝑅 𝑔2) (5) The result yields approximately 30 Å (30.4±0.2 Å), which is almost what was found with Rg (30.2 ± 0.4 Å) in a SAXS study for HSA with the same purity >96% 17.
Likewise, the Porod volume and molecular weight were estimated using Primus that consider the Porod law (Supplementary Information SI-2), and found to be around 100,000 Å 3 and 64.5 kDa respectively. These results seem to be consistent with the molecular weight of HSA (66.5 kDa), which validates the use of Primus to evaluate such parameters in further experiments.
HSA-PAA interaction
The characterization of single protein was then followed by assessing the interactions between HSA and the polyelectrolyte chains. For that, we first studied the effect of an increase in PAA
concentration on the SAXS scattering intensity for an HSA/PAA molar ratio ranging from 0 (protein alone as a reference) to a molar ratio of 3/2. As shown in Figure 2, starting from 40 µM of PAA with 75 µM HSA, a strong change in the signal at small angles is observed, which could be due to the formation of an HSA-PAA complex, while in the intermediate and high q-range the SAXS curves remain almost unchanged by the complexation. Indeed, the evolution of the slope P of the corresponding power law I(q) = q-P shows that at intermediate angles (0.1 to 0.2 Å-1), P slightly varies from 3.8 for single HSA and the mixture of HSA+10, 20 and 30µM PAA, to 4 when increasing the PAA concentration to 40 and 50µM (Figure 2). These results indicate a same type of surface despite the big change in the general shape shown by an increase in the slope at small angles (0.005 to 0.05 Å-1). In fact, the difference is more obvious, where the slope is going from almost a tray (P=0.3) for single HSA, to a slope of 1.2 when adding 50µM PAA, which corresponds to the slope of an elongated object 32.
Figure 2. Scattering intensities of HSA-PAA mixture and pH evolution for [HSA]=75 µM as a function of PAA concentration ([PAA]=0 to 50 µM). Evolution of the slope of the power law I(q) = q-P corresponding to small and intermediate angles.
PAA, despite being in PBS buffer, strongly influences the pH of the solution. Thus, we can suppose that the change in the SAXS curve could be correlated to a pH variation rather than to an effect of the concentration of PAA (explicitly discussed later in the paper).
In order to confirm that the change in the SAXS signal at small angles is due to the formation of a new object being an HSA-PAA complex, we compared the SAXS curves from the HSA alone at 75 µM (blue line), the PAA alone at 60 µM (green line), the mixture of both kipping the same initial concentrations (yellow line) and the sum (red line)
of the SAXS signals of HSA at 75 µM and PAA at 60 µM (Figure 3A).
For the first three curves, the data were processed with GNOM 33 to determine biophysical parameters such as the radius of gyration Rg, the maximal distance Dmax using the autocorrelation function
P(r). This function was calculated by an indirect
Fourier transformation applied to the scattering intensity I(q) using the following equation:
𝑃(𝑟) = 𝑟 2 2𝜋𝑟𝑒2∫ 𝑞 2𝐼(𝑞)sin(𝑞𝑟) 𝑞𝑟 𝑑𝑞 ∞ 0 (6) The pair distribution function refers to the distribution of electrons averaged over a radius r. It entirely depends on the shape and the size of the particle and vanishes at their maximum electron pair distance (Dmax). The radius of gyration can be then derived from P(r) using the following expression: :
𝑅𝑔2 = ∫ 𝑟2𝑃(𝑟)𝑑𝑟
𝐷𝑚𝑎𝑥 0
2 ∫0𝐷𝑚𝑎𝑥𝑃(𝑟)𝑑𝑟) (7) This alternative estimate of Rg makes use of the whole scattering curve, and is much less sensitive to interactions or to the presence of a small fraction of oligomers. The results of the radius of gyration (29.7 Å for HSA and 110.3 Å for the complex) extracted from the P(r) were almost the same compared to those obtained by fits from the Guinier plot (30.4 Å for HSA and 108.9 Å for the complex). The Porod volumes (Vp) for the HSA and the complex were also
evaluated. For a flexible system such as polymer chains in solution it’s difficult to evaluate the exact
Vp. All parameters are reported in the table attached to Figure 3A. Although the curves are calibrated in cm-1, it is impossible to directly determine the mass concentration of the hetero-complex from the I(0) because we do neither know the association stoichiometry nor precisely the experimental specific volume and contrast of the PAA.
As observed in Figure 3A, the SAXS curve of HSA is consistent with a 3D object with a large plateau at small angles and a typical decrease at intermediate angles, whereas PAA exhibits a behavior of a flexible polymer in solution (large decrease following a power law I(q) = q-P with P close to 1.7 which corresponds to polymers with local rigidity) 34. The SAXS curve obtained for the complex presents a combination of properties of HSA and PAA. it shows a constant decrease at small angles and the same signal of HSA starting from 0.05 Å-1. The direct comparison with a linear combination of HSA and PAA SAXS curves (sum curve in Figure 3A) in the same conditions of concentration reflecting the case without interactions between both partners, discloses clearly that the SAXS curve observed corresponds to the creation a new object resulting from interactions between HSA and PAA.
Figure 3. A) Scattering intensities of [HSA]=75 µM (blue curve), [PAA]= 60 µM (green curve), the mixture of HSA and PAA at same concentrations (yellow curve) and the sum of both contributions without interaction (red curve). Table summarizing the
radius of gyration, the maximal distance and the Porod volume of HSA, PAA and the complex. B) Autocorrelation function determined with GNOM of the complex and table summarizing the biophysical parameters extracted from the complexes’ SAXS
data.
The evaluation of Rg and Vp shows that the complex is five times larger than HSA alone but the difficulty to evaluate correctly the Porod volume of PAA (in the complex) or its contribution in the
measured I(0) does not allow to give directly the numbers of HSA and PAA forming the complex. The form of the autocorrelation function corresponding to the complex in Figure 3B shows a
skewed distribution with a clear maximum at small distances corresponding to the radius of the cross-section Rc (Rc=39 Å from P(r) Figure 3B). This distribution is typical of elongated objects such as cylinders, rather than corresponding to amorphous aggregates 35. With these considerations, the length
L of this cylinder can be calculated using the
following relationship L=(12.Rg2.Rc2)0.5. The diameter of the cylinder and the calculated length L and all evaluated parameters are summarized in the table attached to Figure 3B. The value of the calculated length (404 Å) is consistent with the maximal distance (390 Å) determined with P(r) calculation. One can assume that the complex of HSA/PAA-100 kDa exhibits a behavior in solution equivalent to the one of a solid cylinder measuring around 400 Å in length and 78 Å in diameter.
To validate this hypothesis predicting a formation of a defined object instead of amorphous aggregates, solutions of HSA-PAA were flowed in various mobile phases through a size exclusion chromatography column (Supplementary
Information SI-1). The chromatographic profiles
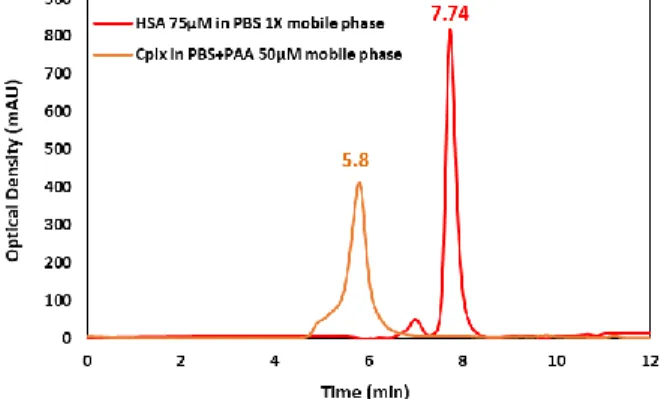
were then compared to that of the single HSA detected mainly at 7.74 min and as classically with a small amount of dimers at 6.9 min (Figure 4).
In fact, in a PBS mobile phase (without PAA) at pH 7.4, a peak at 7.7 min of retention time was obtained, corresponding to the molecular weight of HSA alone. This experiment shows that the complex can be dissociated in a dilute medium of PAA, illustrating the reversibility of the complex formation. On the other hand, if 50 µM of PAA is added to the mobile phase, the pH decreases to 5.2 and the elution profile is modified with a strong shift of the elution peak towards high molecular weights (Figure 4). This observation proves that the protein is no longer single in the solution but bound to the PAA chains. The Gaussian shape of the peak eluted at 5.8 min corresponds to a profile of unique object in solution and not to a continuous distribution of mass such as in aggregates.
Figure 4. Comparison of chromatographic profiles for HSA 75 µM in PBS 1X mobile phase (red peak) and for (75 µM-50 µM) HSA-PAA mixture in PBS+50 µM PAA solution mobile
phase (orange peak).
These experiments were run at PBS ionic strength (0.137 M) and at pH controlled by the PAA concentration, ranging from 5.2 to 7.4 as mentioned above (Figure 2). Since the pH remains higher than the HSA isoelectric point (4.7) and knowing that PAA exhibits a pKa of 4.5, we expect repulsive forces that keep them away from each other. It is because they both theoretically bear negative charges. Yet, the adsorption of HSA molecules on PAA chains is found to happen. Attractive interactions between a polyelectrolyte and a protein having the same net charge were reported by several authors 20,36–38. Since the proteins can carry both positive and negative charges, this binding found to occur in our study could be due to the attractive electrostatic potential between the positive charged patches on the surface of HSA and the negatively charged chains of PAA, which should be the operative force that overcome the repulsion forces. A detailed ITC study performed on the binding between HSA with negative overall charge and a negatively charged PAA 24, shows the same behavior between the two solutes, where each HSA molecule has found to bind to one PAA chain causing an increase in the system entropy. It has been explained by the action of the HSA surface positive charges as a multivalent counter ion for the polyelectrolyte.
Other works doing experiments and dynamics computer simulations have addressed more deeply such phenomenon between proteins and polyelectrolytes 39–41. They showed a large binding affinity between charged patchy proteins and like-charged polyelectrolyte brushes despite having the same net charge. It has been shown that the strongest
attraction of typical proteins at the brush surface, is driven by multipolarity, Born energy (self-energy), and counterion-release contributions, which dominate locally over the monopolar and steric repulsions.
Ionic strength and pH effect on HSA/PAA complexation
For the study of ionic strength and pH effects, the [HSA] was set at 75 µM and the [PAA] at 50 µM (pH ~ 5 remains controlled by the polymer concentration), where the complexation was observed, while the ionic strength was varied from 0.137 M to 1 M by adding a needed amount of a 4 M NaCl solution.
Data obtained and reported below (Figure 5A) reveal a decrease in scattering intensity with the increase in ionic strength. Obviously curves are moving down especially at medium and small angles (0.005 to 0.1 Å-1), changing the slope, to collapse for an ionic strength of 0.75 M and 1 M with the theoretical sum (plotted as red line) of two independent signals without interaction (signal of HSA 75 µM+ signal of PAA 50 µM) obtained at I=0.137 M. This finding confirms the previous assumption and bears out the fact that the binding of HSA-PAA is due to electrostatic interactions.
Figure 5. Scattering intensities of HSA-PAA mixture for [HSA]=75 µM and [PAA]=50 µM, (A) as a function of ionic
strength (I=0.137 to 1 M) for pH≈5, and (B) as a function of pH (pH=4.6 to 8) for I=0.137 M.
Afterwards, salts concentration was set at 0.137 M and pH was changed from 8 to 4.6 using different buffer solutions. As shown in Figure 5B, the decrease in pH down to 5 promotes the formation of the complex whereas at pH > 5 the complex is dissociated giving the same SAXS signal as a mix of two independent contributions. These experiments show the key roles of the pH and the ionic strength on complex formation correlated to the charge distribution of amino acid forming the binding pocket of HSA and to the charge density of the PAA. The decrease in pH allows to reduce the repulsive forces until the initiation of the attractive potential between the positive charges carried on HSA and the negative polyelectrolyte chains. However, at pH lower than 5 (pH 4.6), the obtained SAXS signal (Figure 5B) is significantly different (slope P=1.5) from the one of a macromolecular complex (slope P=1.2). Since the drop of pH to 4.6 cannot sufficiently alter the net charge of the protein (isoelectric point 4.7) to create phase separation, one can consider that HSA starts being unfolded and form aggregates, because it undergoes form transition between pH 5.0 and 3.5 42.
In order to determine the best conditions of complex formation, SAXS measurements for a matrix of conditions were performed where the ionic strength was varied from 0 to 0.75 M for each pH 5, 6 and 7. As the major effects are observable at small angles due to the increase in size when the complex appears, we decided to probe the changes by evaluating the radius of gyration determined from Guinier law for each condition. Although the PAA and the complex have close Rg values (Rg 110 Å), the average value of Rg was found around 50 Å when the HSA and the PAA do not interact, which is much lower than that of the complex. The data are plotted in Figure 6. One can note that the radius of gyration of free PAA or of single HSA found to be around 110 Å and 30 Å respectively, do not depend on the pH.
Figure 6. Radius of gyration evolution as a function of both pH and ionic strength showing the threshold needed for complexation phenomenon to occur ([HSA]=75 µM ; [PAA]=50 µM ; pH=5 to 7 and I=0 to 0.75 M).
pH in the range 6-7 does not affect the radius of gyration of the mixture HSA+PAA, found to be approximately 50 Å for all salt concentrations investigated. This observation highlights the fact that HSA-PAA binding does not take place in these conditions. Since the radius of gyration obtained here by fits is an average of the Rg of HSA and of the one of PAA, it makes sense to obtain an average proportional to the amount of each solute in the mixture (protein/polymer ratio of 3/2). A different behavior is observed at pH 5. In fact, increasing the ionic strength from 0 to 0.75 M has led to decrease the Rg from 110 Å, which is almost the polymer radius of gyration to 69.8 Å. This is due to the fact that beyond 0.15M of ionic strength the HSA-PAA complex particles begin to dissociate into free HSA molecules and free PAA chains. This dissociation is not complete at 0.75M and some complex particles are still in there since the obtained Rg (69.8 Å) is still higher than the average value (50 Å) found when the HSA and PAA do not interact. This outcome sustains the previous results (Figure 5) suggesting that complete dissociation of the complex is taking place between 0.75M and 1M.
We conclude from this study that the complex is stable at pH = 5 and a salt concentration below 0.15 M. As previously, we tested the stability of the complex in HPLC with elution buffers at different pH and a constant salt concentration (I = 0.137 M) in the presence and in the absence of PAA. The results show a dissociation of the complex for pH higher than 5 (Supplementary Information SI-1). The absence of PAA in the medium also promotes
the dissociation, suggesting a large value of the constant of dissociation, which requires the presence of PAA in the buffer to form the complex.
We henceforth know the conditions that lead to the assembly of HSA-PAA complexes in bulk. Therefore, this study constitutes a first knowledge brick to tune these reversible interactions between long PAA grafted on a membrane surface and HSA. Controlling the ionic strength and the pH should enable to regulate these interactions, promoting or preventing their formation. In fact, to enhance the platelets capture on PAA, low salt concentration and pH>5 should be favored to prevent the adsorption of HSA on PAA. Now that the conditions of complex formation are controlled, the stoichiometry of complexation can be investigated.
Determination of the complex stoichiometry (PAA-nHSA)
In order to determine the number of proteins that could bind to each polymer chain, SAXS experiments were performed for a concentration of PAA set at 50 µM a varying HSA concentration ranging between 75 and 600 µM. In other words, the [HSA]/[PAA] molar ratio ranged from 1.5 to 12. The experiments were performed at pH 5 and salts concentration I = 0.15 M to ensure complexation.
Figure 7. Scattering profiles of HSA-PAA mixture as a function of HSA amount ([HSA]=75 to 600 µM ; [PAA]=50
µM ; pH=5 and I=0.15 M).
For a HSA concentration lower than 225 µM, the SAXS curve increases without a significant change of slope at small and middle angles (0.005 to 0.1 Å -1 Figure 7). This shift of the curves corresponds to an increase in concentration of complex, considering
that the contribution of PAA is negligible, compared to the one of the complex (cf. Figure 3A). Given the ratio of Porod volumes between HSA and the complex of R = 1:5, it is expected to have several HSA molecules per chain of PAA. Such behavior in solution would suggest that the HSA binding mechanism to PAA is cooperative, without intermediates depending on the concentration of HSA.
When HSA concentration is close to 225 µM, the signal does not increase any more with the concentration. Beyond 225 µM, the signal changes at small angles, with a decrease in Rg and I(0) values. At large angles, one observes a change in the SAXS profile. This change is due to an accumulation of free HSA in the medium and eventually the measured signal is a combination of the one of all PAA molecules involved in the complexes and of the un-bound HSA.
Table 1 summarizes the values of Rg and Porod volumes for each ratio of HSA/PAA.
Table 1. The evolution of radius of gyration as well as the Porod volume for the HSA-PAA mixture as function of the molar ratio ([PAA]=50 µM ; [HSA]=75-600 µM).
[HSA]µM 75 75 150 180 225 300 450 600
nHSA/PAA HSA Free 1.5 3 3.6 4.5 6 9 12
Rg (±3Å) 30.4 108.3 107 110.1 108.6 90.6 81 74.1
Vp .103 (Å3) 99.1 428 502 500 491 400 305 239
From the values of Rg reported in Table 1, it can be concluded that the attachment of proteins to the polymer chains has taken place on all the polyelectrolyte chains available for HSA/PAA molar ratios ranging between 3.6 and 4.5.
To support this hypothesis, the Porod volume was evaluated for the different HSA/PAA molar ratios. From SAXS experiments it is possible to obtain the Porod volume of an object from the Porod invariant
Q as shown in the experimental section. (plots given
in Supplementary Information SI-2)
The calculated Porod volumes (reported in Table 1) show the same behavior as that of the radius of gyration. For a HSA/PAA molar ratio of 3.6, the
Porod volume is found to be around 500.103 Å3 which represents the complex Porod volume (Figure 3). Then, we notice that raising the HSA concentration reduces the volume to 239.103 Å3 for a molar ratio of 12. That makes sense because after saturation of all PAA chains, the excess of HSA contributes to the average of the Porod volume.
On the other hand, a complexation model has been developed to describe the evolution of the Porod volume for the same range of HSA/PAA molar ratio, taking into account the following complexation reaction:
Where n is the number of HSA in each complex particle.
Thus, for a given initial [HSA]0/[PAA]0 molar ratio, it is possible to define [HSA], [PAA] and [c] as the molar concentrations in the mixture during the complexation progress of HSA, PAA and the complex, respectively. It is also possible to determine the relative volume fraction of each solute
i in the mixture as follows: (Supplementary
Information SI-3)
𝜑𝑖 =𝑁𝐴𝑣𝑜. [𝑖]. 𝑉𝑖
ϕ (8)
𝜙 is the volume fraction of the mixture of solutes in solution and it is expressed as:
𝜙 = 𝑁𝐴𝑣𝑜 ([𝑐]𝑉𝑐 + [𝐻𝑆𝐴]𝑉𝐻𝑆𝐴+ [𝑃𝐴𝐴]𝑉𝑃𝐴𝐴) (9) Where Vc, VHSA, VPAA are the volume of a molecule of the complex, HSA and PAA respectively. These volumes were estimated using Primus from SAXS spectra of single solutes and found to be: 500.103, 100.103 and 50.103 Å3 for the complex, HSA and PAA, respectively.
Accordingly, the Porod volume could be estimated using a theoretical model. According to the literature when the dispersion is made of n kinds of particles of volume Vi and number Ni, for a dilute dispersion S (0) =1, the average volume can be written as follows (O. Spalla eq. 54) 30:
𝑉𝑀 = ∑ 𝑁𝑖𝑉𝑖 2 𝑛 𝑖 ∑ 𝑁𝑛𝑖 𝑖𝑉𝑖 (10) The Porod volume of the mixture can be written then as a function of the relative volume fraction of solute, 𝜑𝑖 : 𝑉𝑀 = ∑ 𝜑𝑛𝑖 𝑖𝑉𝑖 ∑ 𝜑𝑛𝑖 𝑖 = ∑ 𝜑𝑖𝑉𝑖 𝑛 𝑖 (11) 𝑉𝑀 = 𝜑𝑐 𝑉𝑐+ 𝜑𝐻𝑆𝐴 𝑉𝐻𝑆𝐴+ 𝜑𝑃𝐴𝐴 𝑉𝑃𝐴𝐴 (12) Porod volume calculations whether from SAXS experiments or from the theoretical model were performed using a code written in Python (Supplementary Information SI-2).
The results show that a complex model containing 4 HSA with 1 PAA gives a better fit than those run assuming 3 or 5 HSA per PAA (Figure 8), which corroborates the binding stoichiometry proposed
previously. As a matter of fact, when the initial [HSA]0/[PAA]0 ratio is below 4, the mixture is composed of PAA and of the HSA-PAA complex. The Porod volume is then rising up quickly when increasing HSA ratio, from the one of PAA to the one of the complex. For a [HSA]0/[PAA]0 ratio of 4, one can consider that there is only the complex (PAA-4HSA) in the mixture and that the SAXS data gives access to the Porod volume of the complex. When the [HSA]0/[PAA]0 is larger than 4, the mixture is composed of the complex plus some free HSA.
The complexation model (Supplementary
Information SI-3) can then explain the decrease in
the mean Porod volume due to the presence of non-associated HSA in addition to the HSA-PAA complex.
Figure 8. The Porod volume evolution as function of the initial [HSA/[PAA] ratio, using experimental SAXS data and
calculation from the complexation model for different stoichiometry coefficient n.
Since the stoichiometry of the complex has been now determined, the amount of HSA that could be adsorbed on a PAA of the same size grafted onto a membrane interface can be estimated if the amount of the grafted polyelectrolyte is known.
HSA-PAA complex structure investigation
According to the analysis of the autocorrelation function P(r), we can fit the data at small and medium q (less than 0.2 Å-1) using a cylinder of axial length close to 400 Å and diameter equal to 78Å. Thus, the cylinder body was tested to fit the HSA-PAA complex experimental I(q) using Sasview
(Supplementary Information SI-4). This model
can provide information on the global shape of the complex, but provides no structural information on
the internal organization of the complex. To propose a model that could be compatible with the SAXS data, we used an approach based on rigid bodies molecular modelling, completing the missing parts with dummies residues (BUNCH). The atomic structure of HSA can be used as a template for rigid bodies and the PAA polymer forms the missing part. As shown by Ballauff and all 24, PAA can interact with HSA in a pocket charged positively, giving a starting point to lock a portion of PAA at the surface of HSA. These portions of HSA-PAA complex are connected each other as a pearl necklace. The rest of PAA is flexible and the conformation can be
modified by the program. The program BUNCH 27 is working directly with residues of protein rather than with different types of polymer. However, the chemical structure of PAA is close to a peptides’ residue and the PAA polymer can be transformed into poly-glycine chain. As both chains present a difference of mass (=1.26), the individual form factor of the dummies residues is increased in BUNCH program to compensate this default of mass. In total, the 100 kDa PAA chain can be modelled with a poly glycine chain containing 1389 residues.
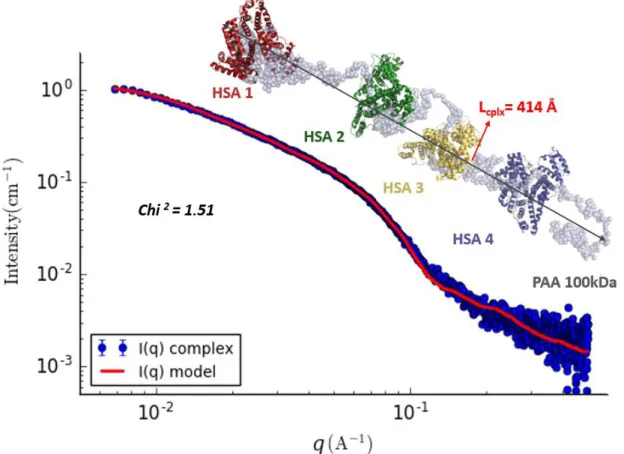
Figure 9. Superimposition of SAXS data of the HSA-PAA complex and the SAXS data compatible model calculated with the program Bunch. The SAXS scattering intensity for HSA-PAA complex as dotted thick dark circle, and the model as red line.
During the molecular modelling process against SAXS data, the position and the orientation of individual HSA is free and the conformation of polymer chain is modified in order to describe the space occupied by the PAA. The result obtained is an all atoms model compatible with SAXS data reflecting a possible organization of the complex in solution. Interestingly, the complex forms an elongated structure as a cylinder with a non-specific orientation of the HSA. The absence of correlation
peak in the data suggests that HSA does not present a periodic or partially aligned structure in the complex. This model proposes a globally flexible organization in alternative layers composed of HSA and unfold PAA without frozen structures(Figure 9). Many tests have been performed with different templates and all converge to the same organization with some variations in the position or orientation of HSA. However, the distance between two monomers of HSA always ranges between 80 and 100 Å.
Besides, the distance between the extremities of the complex remains constant, found to be 414 Å (Figure 9). These results are consistent with the length of the complex previously evaluated whether from the P(r) or from the fit of the experimental I(q) of the complex performed using Sasview
(Supplementary Information SI-4).
Conclusion
An assessment of the HSA protein interaction with PAA polyelectrolyte has been presented in this study combining SAXS and chromatography. The study of the HSA-PAA interactions revealed a complexation phenomenon of protein molecules with the polymer chains. Tests on the effect of the ionic strength showed that this HSA-PAA binding is chiefly an electrostatic interaction, where attractive and repulsive interactions are competing. Decreasing the pH to 5 permits to reduce the negative overall charge of the protein until the electrostatic attraction between the PAA chains and the positive patches on the protein dominates. Besides, this complexation was found to be reversible: the HSA-PAA complex tends to dissociate once put in a diluted medium (without PAA) or a pH greater than 5. That known, it is now possible to control the interactions between HSA and PAA at the membrane interface by changing the physicochemical conditions (pH, ionic strength).
An evaluation of the complex size suggests the attachment of several protein molecules to each polymer chain. The effect of the ratio of the protein concentration to the polymer concentration was also explored, and revealed that 4 HSA could be bound to each 100 kDa PAA chain. A complexation model was proposed, which allowed to describe the Porod volume of the mixture for the different HSA/PAA ratios. From this model, it could be possible to quantify the adsorbed amount of HSA on PAA of the same size grafted to a membrane surface.
A SAXS modelling study aimed at describing the complex structure has been also conducted. The cylinder body was found to fit well the experimental SAXS scattering intensities giving an idea of the global shape of the complex, but without providing any structural information. Finally, an all atom pearl necklace model was developed using BUNCH
program to better describe the final structure of the complex.
It would be interesting in the future to evaluate the stoichiometry of complexation with different sizes of PAA. As it would be also interesting to assess the reproducibility of this complexation between HSA and a PAA grafted into a membrane surface for the different physiochemical conditions discussed in this article. AUTHOR INFORMATION Corresponding Authors *E-mail: merzougui@chimie.ups-tlse.fr *E-mail: roblin@chimie.ups-tlse.fr Author Contributions
The manuscript was written through contributions of all authors. All authors have given approval to the final version of the manuscript.
Notes
The authors declare no competing financial interest. There are no conflicts of interest to declare.
ACKNOWLEDGMENT
The authors would like to acknowledge the Agence Nationale de la Recherche (MOST-ANR International Program: ANR 17-CE08-0041) for financial support, the FERMaT Federation FR3089 for providing Small Angle X-Ray Scattering laboratory facility. This work benefited from the use
of the SasView application
(https://www.sasview.org), originally developed under NSF award DMR-0520547. SasView contains code developed with funding from the European Union’s Horizon 2020 research and innovation programme under the SINE2020 project, grant agreement No 654000.
References
(1) Senaratne, W.; Andruzzi, L.; Ober, C. K. Self-Assembled Monolayers and Polymer Brushes in Biotechnology: Current Applications and Future Perspectives. Biomacromolecules 2005, 6 (5), 2427– 2448.
(2) de Vos, W. M.; Biesheuvel, P. M.; de Keizer, A.; Kleijn, J. M.; Cohen Stuart, M. A. Adsorption of the Protein Bovine Serum Albumin in a Planar Poly(Acrylic Acid) Brush Layer As Measured by Optical Reflectometry. Langmuir 2008, 24 (13), 6575–6584.
(3) Henzler, K.; Wittemann, A.; Breininger, E.; Ballauff, M.; Rosenfeldt, S. Adsorption of Bovine Hemoglobin onto Spherical Polyelectrolyte Brushes Monitored by Small-Angle X-Ray Scattering and Fourier Transform Infrared Spectroscopy.
Biomacromolecules 2007, 8 (11), 3674–3681.
(4) Welsch, N.; Lu, Y.; Dzubiella, J.; Ballauff, M. Adsorption of Proteins to Functional Polymeric Nanoparticles. Polymer 2013, 54 (12), 2835–2849.
(5) Wang, S.; Chen, K.; Xu, Y.; Yu, X.; Wang, W.; Li, L.; Guo, X. Protein Immobilization and Separation Using Anionic/Cationic Spherical Polyelectrolyte Brushes Based on Charge Anisotropy. Soft Matter 2013, 9 (47), 11276–11287. (6) Mattison, K. W.; Brittain, I. J.; Dubin, P. L. Protein-Polyelectrolyte Phase Boundaries.
Biotechnol. Prog. 1995, 11 (6), 632–637.
(7) Pourjavadi, A.; Tehrani, Z. M. Mesoporous Silica Nanoparticles with Bilayer Coating of Poly(Acrylic Acid-Co-Itaconic Acid) and Human Serum Albumin (HSA): A PH-Sensitive Carrier for Gemcitabine Delivery. Materials Science and
Engineering: C 2016, 61, 782–790.
(8) Das, M.; Mardyani, S.; Chan, W. C. W.; Kumacheva, E. Biofunctionalized PH-Responsive Microgels for Cancer Cell Targeting: Rational Design. Advanced Materials 2006, 18 (1), 80–83.
(9) Yu, S.; Kent, B.; Jafta, C. J.; Petzold, A.; Radulescu, A.; Schuchardt, M.; Tölle, M.; van der Giet, M.; Zidek, W.; Ballauff, M. Stability of Human Serum Albumin Structure upon Toxin Uptake Explored by Small Angle Neutron Scattering.
Polymer 2018, 141, 175–183.
(10) Chen, H.; Hsieh, Y.-L. Enzyme Immobilization on Ultrafine Cellulose Fibers via Poly(Acrylic Acid) Electrolyte Grafts.
Biotechnology and Bioengineering 2005, 90 (4),
405–413.
(11) Rastogi, L.; Arunachalam, J. Synthesis and Characterization of Bovine Serum Albumin–Copper Nanocomposites for Antibacterial Applications.
Colloids and Surfaces B: Biointerfaces 2013, 108,
134–141.
(12) Dubin, P.; Bock, J.; Davis, R.; Schulz, D. N.; Thies, C. Macromolecular Complexes in Chemistry
and Biology; Springer Science & Business Media,
2012.
(13) Nel, A. E.; Mädler, L.; Velegol, D.; Xia, T.; Hoek, E. M. V.; Somasundaran, P.; Klaessig, F.; Castranova, V.; Thompson, M. Understanding Biophysicochemical Interactions at the Nano-Bio Interface. Nat Mater 2009, 8 (7), 543–557.
(14) Wei, Q.; Becherer, T.; Angioletti‐Uberti, S.; Dzubiella, J.; Wischke, C.; Neffe, A. T.; Lendlein, A.; Ballauff, M.; Haag, R. Protein Interactions with Polymer Coatings and Biomaterials. Angewandte
Chemie International Edition 2014, 53 (31), 8004–
8031.
(15) Bhat, S.; Kumar, A. Biomaterials and Bioengineering Tomorrow’s Healthcare. Biomatter
2013, 3 (3), e24717.
(16) Tarvainen, T.; Nevalainen, T.; Sundell, A.; Svarfvar, B.; Hyrsylä, J.; Paronen, P.; Järvinen, K. Drug Release from Poly(Acrylic Acid) Grafted Poly(Vinylidene Fluoride) Membrane Bags in the Gastrointestinal Tract in the Rat and Dog. Journal of
Controlled Release 2000, 66 (1), 19–26.
(17) Leggio, C.; Galantini, L.; Viorel Pavel, N. About the Albumin Structure in Solution: Cigar Expanded Form versus Heart Normal Shape.
Physical Chemistry Chemical Physics 2008, 10 (45),
6741–6750.
(18) Zhang, C.; Jin, J.; Zhao, J.; Jiang, W.; Yin, J. Functionalized Polypropylene Non-Woven Fabric Membrane with Bovine Serum Albumin and Its Hemocompatibility Enhancement. Colloids and
Surfaces B: Biointerfaces 2013, 102, 45–52.
(19) Cooper, C. L.; Dubin, P. L.; Kayitmazer, A. B.; Turksen, S. Polyelectrolyte–Protein Complexes.
Current Opinion in Colloid & Interface Science
2005, 10 (1), 52–78.
(20) Basak Kayitmazer, A.; Seeman, D.; Baykal Minsky, B.; L. Dubin, P.; Xu, Y. Protein – Polyelectrolyte Interactions. Soft Matter 2013, 9 (9), 2553–2583.
(21) Rosenfeldt, S.; Wittemann, A.; Ballauff, M.; Breininger, E.; Bolze, J.; Dingenouts, N. Interaction of Proteins with Spherical Polyelectrolyte Brushes in Solution as Studied by Small-Angle x-Ray Scattering. Physical Review E 2004, 70 (6).
(22) Wang, W.; Li, L.; Henzler, K.; Lu, Y.; Wang, J.; Han, H.; Tian, Y.; Wang, Y.; Zhou, Z.; Lotze, G.; Narayanan, T.; Ballauff, M.; Guo, X. Protein Immobilization onto Cationic Spherical Polyelectrolyte Brushes Studied by Small Angle X-Ray Scattering. Biomacromolecules 2017, 18 (5), 1574–1581.
(23) Topuzoğulları, M.; Çimen, N. S.; Mustafaeva, Z.; Mustafaev, M. Molecular-Weight Distribution and Structural Transformation in Water-Soluble Complexes of Poly(Acrylic Acid) and Bovine Serum Albumin. European Polymer
Journal 2007, 43 (7), 2935–2946.
(24) Yu, S.; Xu, X.; Yigit, C.; van der Giet, M.; Zidek, W.; Jankowski, J.; Dzubiella, J.; Ballauff, M. Interaction of Human Serum Albumin with Short Polyelectrolytes: A Study by Calorimetry and Computer Simulations. Soft Matter 2015, 11 (23), 4630–4639.
(25) Ran, Q.; Xu, X.; Dey, P.; Yu, S.; Lu, Y.; Dzubiella, J.; Haag, R.; Ballauff, M. Interaction of Human Serum Albumin with Dendritic Polyglycerol Sulfate: Rationalizing the Thermodynamics of Binding. The Journal of Chemical Physics 2018, 149 (16), 163324.
(26) Hollmann, O.; Czeslik, C. Characterization of a Planar Poly(Acrylic Acid) Brush as a Materials Coating for Controlled Protein Immobilization.
Langmuir 2006, 22 (7), 3300–3305.
(27) Petoukhov, M. V.; Svergun, D. I. Global Rigid Body Modeling of Macromolecular
Complexes against Small-Angle Scattering Data.
Biophysical Journal 2005, 89 (2), 1237–1250.
(28) Konarev, P. V.; Volkov, V. V.; Sokolova, A. V.; Koch, M. H. J.; Svergun, D. I. PRIMUS: A Windows PC-Based System for Small-Angle Scattering Data Analysis. J Appl Cryst 2003, 36 (5), 1277–1282.
(29) Petoukhov, M. V.; Konarev, P. V.; Kikhney, A. G.; Svergun, D. I. ATSAS 2.1 – towards Automated and Web-Supported Small-Angle Scattering Data Analysis. J Appl Cryst 2007, 40 (s1), s223–s228.
(30) Neutron, X-Rays and Light. Scattering
Methods Applied to Soft Condensed Matter, New
edition edition.; North Holland: Amsterdam ; Boston, 2002.
(31) David, G.; Pérez, J. Combined Sampler Robot and High-Performance Liquid Chromatography: A Fully Automated System for Biological Small-Angle X-Ray Scattering Experiments at the Synchrotron SOLEIL SWING Beamline. J Appl Cryst 2009, 42 (5), 892–900.
(32) Koch, M. H. J.; Vachette, P.; Svergun, D. I. Small-Angle Scattering: A View on the Properties, Structures and Structural Changes of Biological Macromolecules in Solution. Quarterly Reviews of
Biophysics 2003, 36 (2), 147–227.
(33) Svergun, D. I. Determination of the Regularization Parameter in Indirect-Transform Methods Using Perceptual Criteria. J Appl Cryst
1992, 25 (4), 495–503.
(34) Chu, B.; Hsiao, B. S. Small-Angle X-Ray Scattering of Polymers. Chem. Rev. 2001, 101 (6), 1727–1762.
(35) Svergun, D. I.; Koch, M. H. J. Small-Angle Scattering Studies of Biological Macromolecules in Solution. Rep. Prog. Phys. 2003, 66 (10), 1735– 1782.
(36) Xu, X.; Angioletti-Uberti, S.; Lu, Y.; Dzubiella, J.; Ballauff, M. Interaction of Proteins with Polyelectrolytes: Comparison of Theory to Experiment. Langmuir 2019, 35 (16), 5373–5391.
(37) Seyrek, E.; Dubin, P. L.; Tribet, C.; Gamble, E. A. Ionic Strength Dependence of Protein-Polyelectrolyte Interactions. Biomacromolecules
2003, 4 (2), 273–282.
(38) Xu, Y.; Mazzawi, M.; Chen, K.; Sun, L.; Dubin, P. L. Protein Purification by Polyelectrolyte Coacervation: Influence of Protein Charge Anisotropy on Selectivity. Biomacromolecules
2011, 12 (5), 1512–1522.
(39) Yigit, C.; Heyda, J.; Ballauff, M.; Dzubiella, J. Like-Charged Protein-Polyelectrolyte Complexation Driven by Charge Patches. J. Chem.
Phys. 2015, 143 (6), 064905.
(40) Yigit, C.; Heyda, J.; Dzubiella, J. Charged Patchy Particle Models in Explicit Salt: Ion Distributions, Electrostatic Potentials, and Effective Interactions. J. Chem. Phys. 2015, 143 (6), 064904.
(41) Yigit, C.; Kanduč, M.; Ballauff, M.; Dzubiella, J. Interaction of Charged Patchy Protein Models with Like-Charged Polyelectrolyte Brushes.
Langmuir 2017, 33 (1), 417–427.
(42) Dockal, M.; Carter, D. C.; Rüker, F. Conformational Transitions of the Three Recombinant Domains of Human Serum Albumin Depending on PH. J. Biol. Chem. 2000, 275 (5), 3042–3050.
Supplementary information (ESI)
Pearl-necklace assembly of Human serum albumin
with poly (acrylic acid) polyelectrolyte explored by
small angle X-ray scattering (SAXS)
Charaf E. Merzougui *§, Pierre Roblin *§, Pierre Aimar §, Antoine Venault ∥, Yung Chang ∥,
Christel Causserand §, Patrice Bacchin §.
§Laboratoire de Génie Chimique, Université de Toulouse, CNRS, INPT, UPS, Toulouse, France
∥ R&D Center for Membrane Technology, Chung Yuan Christian University, Chung Li, Taiwan
S1-Study of HSA-PAA binding reversibility
The complex stability has been examined by chromatography. For that, the single HSA at 75µM was first investigated in PBS 1X mobile phase and was detected at 7.74 min. After that, in the same mobile phase PBS 1X but at pH 5 the complex (HSA 75µM+PAA 50µM) was injected but a peak with almost the same time of retention of HSA was detected at 7.66 min. Almost the same peak was observed then at 7.69 min for a complex sample but tested this time in PBS+50µM PAA mobile phase at pH 7. Whereas in the same mobile phase but at pH 5 a different peak was obtained at 5.8 min for the complex.
S1-Figure 1. Comparison of chromatographic patterns for HSA 75µM in PBS 1X mobile phase (red peak) and for (75µM-50µM) HSA-PAA mixture in PBS 1X (black line), in 50 µM PAA solution mobile phase at pH 5 (orange
peak) and at pH 7 (green peak).
These chromatographic patterns (S1-Figure 1) highlight the fact that even the samples tested are prepared under conditions that allow complexation to happen (pH 5; I=0.137M), the HSA-PAA complex tends to dissociate once put in a medium diluted in PAA or pH greater than 5. In fact, when complex was put in PBS mobile phase even at pH 5 or in PBS+PAA 50µM but at pH 7, the HSA peak was detected because this last is free in solution and not linked to PAA chains.
This outcome not only uphold the previous results regarding pH, but also prove that HSA-PAA complex is not stable in diluted medium. Therefore, the protein molecules initially bounded to the polyelectrolyte inside the samples could be then detached changing the medium, which means that this binding phenomenon that has found to take place is reversible.
S2- SAXS data analysis
The SAXS data (I(q) being the scattering intensity obtained from SAXS measurement) have been analysed to obtain the main properties of the HSA and the HSA-PAA complex. The home code is found in the following link:
https://github.com/CharafMerzougui/Supporting-information/blob/master/Porod%20volume%20estimation%20-%20modif%20.ipynb
Determination of the radius of gyration and I(0)
The radius of gyration is obtained by applying the following equation at small q:
lim 𝑞→0𝐼 = 𝐼0𝑒𝑥𝑝
(
‒ 1 3𝑞 2𝑅2 𝑔)
Close to q=0, the scattering intensity of a particle is described by a Gaussian curve. The Guinier law is equivalent of a linear variation of Ln I(q) vs q2 (Guinier plot), providing R
g and I0. The code performs the curve fitting to obtain the values of Rg and I0 for the 10 first values of q. Here q is then less than 0.012 and should then met the criteria q.Rg < 1.5 if Rg is less than 125 nm.
It can be checked from Fig.1 and Fig.2 that the data fitting is correct: there is no deviation from the straight line indicating no intermolecular interaction or aggregation in this concentration range.
Determination of the Porod volume
The calculations of the Porod volume (see Experimental section in the main manuscript) were done for all the studied HSA/PAA molar ratios (1.5 to 12) and were performed using the Python code mentioned above. The table below summarize the figures that show the estimation of radius of gyration Rg, the constant K as well as the invariant Q, which allow then the evaluation of the Porod volume for the studied range of HSA/PAA molar ratio.
[HSA]/[PAA] =1.5 [HSA]/[PAA] =3
[HSA]/[PAA] =6 [HSA]/[PAA] =9
[HSA]/[PAA] =12
It has to be noted that the value of Q has been plotted as a function of 𝜙(1 ‒ 𝜙) to estimate the value of of the mixture. The obtained result 1.45. 10Δ𝜌 -6 Å2 (S2-Figure 1) seems to be consistent with the contrast of proteins found to be around 2. 10-6 Å2 (Svergun et Koch, 2003) and also with what was found for surfactants (Bombelli et al., 2002).
S2-Figure 1. Calculation of the contrast Δρ of the mixture HSA+PAA from the slope of the linear regression of the invariant Q as function of ϕ(1-ϕ) for an HSA/PAA malar ratio ranging from 1.5 to 12.
S3- Stochiometry Model for the volume fraction calculation of the HSA, PAA, HSA-PAA complex
One considers a mixture of HSA and PAA with the molar concentration [HSA]0 and [PAA]0 respectively that allows the formation of a complex with the following stoichiometry:
𝑛 𝐻𝑆𝐴 + 1 𝑃𝐴𝐴 →1 𝑐𝑜𝑚𝑝𝑙𝑒𝑥(𝑃𝐴𝐴 ‒ 𝑛𝐻𝑆𝐴)
For a progress of the complexation corresponding to a molar concentration in complex [c]:
[𝑃𝐴𝐴] = [𝑃𝐴𝐴]0‒ [𝑐] [𝐻𝑆𝐴] = [𝐻𝑆𝐴]0‒ (𝑛 ∗ [𝑐])
If the PAA is on excess ([HSA]0<n[PAA]0), the composition in the mixture is:
[𝑐] =[𝐻𝑆𝐴]0 𝑛
[𝑃𝐴𝐴] = [𝑃𝐴𝐴]0‒[𝐻𝑆𝐴]0 𝑛
If HSA is on excess ([HSA]0>n[PAA]0), the composition in the mixture is:
[𝑐] = [𝑃𝐴𝐴]0
[𝐻𝑆𝐴] = [𝐻𝑆𝐴]0‒(𝑛 ∗ [𝑃𝐴𝐴]0)
Knowing the concentration, one can define the volume fraction of the mixture as:
𝜙 = 𝑁𝐴𝑣𝑜 ([𝑐]𝑉𝑐+ [𝐻𝑆𝐴]𝑉𝐻𝑆𝐴+ [𝑃𝐴𝐴]𝑉𝑃𝐴𝐴)
Where Vc, VHSA, VPAA are the volume of a molecule of complex, HSA and PAA respectively that were evaluated from SAXS analysis using Primus of isolated solute and found to be around: 500.103, 100.103 and 50.103 Å3 for complex, HSA and PAA and respectively.
The relative volume fraction of the complex in the mixture is then:
𝜑𝑐=𝑁𝐴𝑣𝑜.[𝑐].𝑉𝑐 ϕ
From this complexation model, one can then determine the evolution of the relative volume fraction of HSA, PAA and the complex (S3-Figure 1) for a given value of the stoichiometry coefficient n.
S3-Figure 1. The relative volume fraction of HSA, PAA and the complex as a function of [HSA]/[PAA] molar ratio calculated with the complexation model for a stoichiometry coefficient n=4
The computation was carried out using a Python code found in the following link:
S4-HSA-PAA complex structure modelling
As shown in the paper, the first analysis of autocorrelation P(r) of the complex revealed an elongated form such as a cylinder (Radius≈40 Å; Length≈400 Å), a shape that was found to fit well the SAXS experimental I(q) data of the HSA-PAA complex (red line S4-Figure 1). But, the radius obtained from the fit using Sasview yields 25 Å, which is smaller than the radius of the complex assimilated to a cylinder obtained from the P(r) (39 Å). That could be due to the fact that the value of complex radius estimated from the cross section gyration radius Rc using Sasview provides a mean value of the distances forming the section of the complex. The calculated value reflects probably an average of the radius of HSA and the diameter of the polymer, which is smaller than that of HSA.
S4-Figure 1. The SAXS scattering intensity for HSA-PAA complex as dotted thick blue line, fitted by cylinder model (Radius≈25 Å ; Length≈400 Å) as red line.
![Figure 2. Scattering intensities of HSA-PAA mixture and pH evolution for [HSA]=75 µM as a function of PAA concentration ([PAA]=0 to 50 µM)](https://thumb-eu.123doks.com/thumbv2/123doknet/14250858.488176/7.918.210.683.536.843/figure-scattering-intensities-hsa-mixture-evolution-function-concentration.webp)
![Figure 3. A) Scattering intensities of [HSA]=75 µM (blue curve), [PAA]= 60 µM (green curve), the mixture of HSA and PAA at same concentrations (yellow curve) and the sum of both contributions without interaction (red curve)](https://thumb-eu.123doks.com/thumbv2/123doknet/14250858.488176/8.918.69.787.550.856/figure-scattering-intensities-mixture-concentrations-yellow-contributions-interaction.webp)
![Figure 5. Scattering intensities of HSA-PAA mixture for [HSA]=75 µM and [PAA]=50 µM, (A) as a function of ionic](https://thumb-eu.123doks.com/thumbv2/123doknet/14250858.488176/10.918.70.438.619.867/figure-scattering-intensities-hsa-paa-mixture-function-ionic.webp)
![Figure 6. Radius of gyration evolution as a function of both pH and ionic strength showing the threshold needed for complexation phenomenon to occur ([HSA]=75 µM ; [PAA]=50 µM ; pH=5 to 7 and I=0 to 0.75 M)](https://thumb-eu.123doks.com/thumbv2/123doknet/14250858.488176/11.918.195.693.69.309/figure-gyration-evolution-function-strength-threshold-complexation-phenomenon.webp)

![Figure 8. The Porod volume evolution as function of the initial [HSA/[PAA] ratio, using experimental SAXS data and](https://thumb-eu.123doks.com/thumbv2/123doknet/14250858.488176/13.918.491.833.409.633/figure-porod-volume-evolution-function-initial-ratio-experimental.webp)