HAL Id: hal-00283263
https://hal.archives-ouvertes.fr/hal-00283263
Preprint submitted on 29 May 2008
HAL is a multi-disciplinary open access
archive for the deposit and dissemination of
sci-entific research documents, whether they are
pub-lished or not. The documents may come from
teaching and research institutions in France or
abroad, or from public or private research centers.
L’archive ouverte pluridisciplinaire HAL, est
destinée au dépôt et à la diffusion de documents
scientifiques de niveau recherche, publiés ou non,
émanant des établissements d’enseignement et de
recherche français ou étrangers, des laboratoires
publics ou privés.
Nonlinear effects for coda-type elastic waves in stressed
granular media
Vincent Tournat, Vitali Goussev
To cite this version:
Vincent Tournat, Vitali Goussev. Nonlinear effects for coda-type elastic waves in stressed granular
media. 2008. �hal-00283263�
hal-00283263, version 1 - 29 May 2008
Nonlinear effects for coda-type elastic waves in stressed granular media
V. TournatLAUM, CNRS, Universit´e du Maine, Av. O. Messiaen, 72085 Le Mans, France∗
V. E. Gusev
Laboratoire de Physique de l’ ´Etat Condens´e, UMR-CNRS 6087, Universit´e du Maine, Av. O. Messiaen, 72085, Le Mans, France
(Dated: May 29, 2008)
Experimental results and their interpretations are presented on the nonlinear acoustic effects of multiple scattered elastic waves in unconsolidated granular media. Short wave packets with a central frequency higher than the so-called cut-off frequency of the medium are emitted at one side of the statically stressed slab of glass beads and received at the other side after multiple scattering and nonlinear interactions. Typical signals are strongly distorted compared to their initially radiated shape both due to nonlinearity and scattering. It is shown that acoustic waves with a deformation amplitude much lower than the mean static deformation of the contacts in the medium can modify the elastic properties of the medium, especially for the weak contact skeleton part. This addresses the problem of reproducibility of granular structures during and after acoustic excitation, which is necessary to understand in the non destructive testing of the elastic properties of granular media by acoustic methods. Coda signal analysis is shown to be a powerful time-resolved tool to monitor slight modifications in the elastic response of an unconsolidated granular structure.
PACS numbers: Valid PACS appear here
I. INTRODUCTION
Unconsolidated granular materials are known to ex-hibit a high complexity in their macroscopic behaviors. This gives rise to numerous fundamental and applied processes that are currently intensively studied, such as avalanches, dune formation, compaction etc [1, 2, 3, 4]. Most of the studied physical processes concerning the un-consolidated granular matter are obviously related to the possibility for the grains to move relative to each other, from microscopic (much smaller than a grain diameter) to macroscopic (much larger than a grain diameter) rear-rangements. While large movements of grains have been observed and modelled for the processes where the gran-ular material behavior may be fluid-like (even complex and not classical), like avalanches, microscopic relative movements are less intuitive and less studied. They are however the only possible relative movements in solid-like granular media where a static stress is applied and the grains are confined in a given volume.
In this context, the acoustic waves, known to be highly sensitive to the contact stresses [5, 6, 7, 8], can be useful for the monitoring of these small relative movements [9], impossible to detect by other existing methods. They could even be useful for the generation of these small movements. Among the several existing methods for the grain movements or contact stresses monitoring (car-bon paper experiment, photo-elasticity, image processing from CCD camera, X-ray tomography or photo-imaging in iso-index configuration [1, 2, 10, 11]), the acoustic
∗Electronic address: [email protected]
methods are, to the best of our knowledge, the only ones sensitive to the contact stresses inside the volume of a 3-D non transparent medium. One of the main advan-tage of acoustic methods is also the temporal resolution of the measurement, which could decrease down to the wave period (one millisecond at one kHz), and is partic-ularly interesting in transient processes like avalanches for instance. However, there is currently a lack of un-derstanding of the acoustic transport properties through granular media, which makes these methods mostly qual-itative.
Several previous works [7, 9, 12, 13] have shown the following qualitative features for the acoustic wave prop-agation through stressed and non cohesive granular me-dia. The propagation of a low amplitude (with a strain much lower than the average static strain of the con-tacts) and low frequency (with a wavelength much larger than the grain diameter) wave can be linear and is mostly governed by the averaged properties of the medium (aver-age density, aver(aver-age static stress, coordination number) [14, 15]. The propagation of a high amplitude (with a strain lower than the average static strain of the contacts but which can be comparable) and low frequency wave is nonlinear and governed partly by the so-called weak con-tacts (with a static strain lower than the average one) [7, 16, 17]. This is a consequence of the fact that in-dividual stress-strain relationships for each contact have higher values of nonlinear parameters when the pre-stress is smaller. For acoustic waves with wavelengths compara-ble to the bead diameter, however, these simple features are not straightforward, and the transport properties termination remains a fundamental problem. How to de-scribe the wave scattering in a network of beads with geometrical and contact disorder? What is the role of
the so-called force chains in the transport properties of short wavelength acoustic waves? Can the weakest con-tacts make the multiple scattering process nonlinear?
A linear diffusion approach has been recently applied to the analysis of coda-type signals in confined granular media [8]. This is one of the first attempt to understand the transport properties of short wavelength elastic waves in such media at the laboratory scale and to extract pa-rameters such as a characteristic time of absorption τa and a diffusivity D. This approach is based on previous works in elastic wave diffusion carried out for slightly different media (solid rods in water [18], chaotic cavities [19], or glass bead in water [20] for instance) and on a different scale [21, 22].
In this article, we report some experimental results of nonlinear acoustic wave propagation, with initially radi-ated wavelengths close to the bead diameter. In some well-chosen experimental configurations, it is possible to observe coda-type signals, together with a nonlinear sig-nal of low frequency, which is identified here as a self-demodulated signal. For some widely encountered config-urations, linear and nonlinear wave processes of multiple scattering, self-demodulation and self-action are observed [23, 24]. The last nonlinear process of self-action of the multiple scattered field is observed even for moderate ex-citation amplitudes (deformations much lower than the average static strain of the contacts). The application of some of the presented effects to the characterization of granular media is finally discussed.
II. EXPERIMENTS
As a preamble, carrying quantitative experiments on acoustic wave propagation in unconsolidated granular media is a hard task for several reasons that are described in the following.
First, in order to excite the modes of propagation inside the solid frame, i.e. through the elastic beads and their contacts, and not through the fluid saturat-ing phase, it is necessary to put the piezo-transducer in direct contact with the medium itself (or in contact with a solid which is itself in direct contact with the medium). Other types of transducers for the excitation of acoustic waves, like laser generation of ultrasound for instance, have not been applied to our knowledge, certainly be-cause of the high efficiency needed in these strongly at-tenuating media. The application of a mechanical stress with a contact transducer has several consequences on the possible experiments. What can be done usually in liquids for acoustic metrology, i.e. changing the emitter-receiver distance in order to measure the wave velocity for instance, is extremely difficult in unconsolidated gran-ular media, because the contact network is modified by any variation of external conditions.
The second difficulty in carrying quantitative experi-ments is the experimentally observed strong influence of the applied static stress on the transmission coefficient
es-Glassbeads(d = 2 mm) D = 20 cm Shearemitter Longitudinalre eiver Stati stress HP lter+ampli ation Centeredon100 kH z Emittedsignal L = 1 − 18 cm P0≃30 − 500 kP a
Layerofgluedbeads
FIG. 1: Schematics of the experimental configuration.
pecially for short wavelength acoustic waves. This result is discussed in the following. The consequence is the im-possibility to perform quantitative reproducible and pre-cise experiments if ones modify the applied static stress on the sample, even if it is measured to be equal after a back and forth modification. Moreover, if one would be able to apply exactly the same stress, the memory effects due for instance to the hysteresis in the quasi-static stress-strain relationship, take place [25, 26, 27]. In an attempt to control carefully the granular preparation, the acoustics of compaction has been recently studied [28]. However, it allows to perform experiments only for weakly stressed granular packings (typically from 75 P a to 3 kP a), far from the stress necessary for the observa-tion of the signals described here.
The third difficulty, is related to the fragility of such media [1, 4]. Due to the inhomogeneity of the individ-ual contact loads [10, 11, 14, 29], some of the contacts are weakly loaded, which make them able to clap, slip or slide under the action of a small amplitude strain wave. In contrast, the so-called strong contacts, are supposed to take part in the force chains which constitute the elastic skeleton of the bead arrangement. Previous works show by simple analytical formulae or experimentally that the weaker the contact the higher is its acoustic nonlinearity [7]. It is thus expected that the major role in the lin-ear acoustic properties is played by the strong contacts and the force chains while the nonlinear acoustic prop-erties are more controlled by the weak contacts. There exist few experimental configurations (in particular when short wavelengths are used) when these roles cannot be qualitatively separated like that, and either weak con-tacts influence importantly the linear properties [30] or strong contacts are involved in the observed nonlinear effects.
A. Experimental setup
In Fig. 1, a schematic representation of the experimen-tal setup is shown. A wave packet made of a sine wave at 100 kHz modulated in amplitude by a Gaussian function is high-pass filtered over 40 kHz (in order to avoid any di-rect low-frequency excitation), amplified and launched in the medium with a shear piezo-transducer. Due to mul-tiple scattering, mode conversions (including dilatancy), the acoustic energy is rapidly distributed between longi-tudinal and shear vibrations in the medium. The use of a shear emitter has the advantage of avoiding the direct excitation of a pressure wave in the air saturating the beads. In the following results, two types of Gaussian function widths for the initially launched wave packets have been used, and two types of surface treatment for the shear transducer (the first type is the raw transducer membrane with asperities estimated to be of character-istic scale ∼ 50 µm and the second type is a transducer with a glued single layer of 2 mm diameter glass beads, the same beads as in the medium itself). The container diameter is D = 20 cm and the propagation length ranges between 1 cm and 18 cm. The applied static uniaxial stress is measured with a force sensor at one end of the container and ranges from 30 kP a to 500 kP a. A longi-tudinal piezo-electric receiver is placed at the bottom of the container. This transducer has been chosen because of its high sensitivity over a wide-frequency band, allow-ing for a large range in the acoustic amplitude measure-ments. In all the experiments presented in the following, the estimated average contact strain ε0 (of the typical range 3 − 7 × 10⁻⁴
for a 200 kP a applied stress) is always greater than the maximum acoustic strain εmax≃ 10
−5 . When using this setup, it is possible to modify the emitted acoustic frequency, the acoustic amplitude, the applied static stress, the propagation distance. But im-portantly, it is better for a quantitative insight in the wave propagation phenomena, to modify parameters of the setup that change the smallest number of medium (or wave) parameters. For instance, changing the fre-quency or the static stress modifies the wave scattering, absorption, dispersion and nonlinearity. Changing the distance, changes irreversibly and in an uncontrolled way the granular medium state, as it is necessary to unload completely the medium and add or remove some granu-lar matter. The convenient parameter to modify is the wave excitation amplitude, which can be accurately mea-sured, and is reproducible. The medium is a priori not irreversibly modified.
In the following several experimental results are pre-sented and their implications on the granular material elasticity is discussed. The parameters of the experiment may be different, they are consequently recalled for each group of results when necessary.
Normalized signal (Arb. Units)
Time (s)
0 0.001 0.002 0.003 0.004 0.005
εa = 5 × 10⁻⁷
εa = 2 × 10⁻⁶
εa = 5 × 10⁻⁶
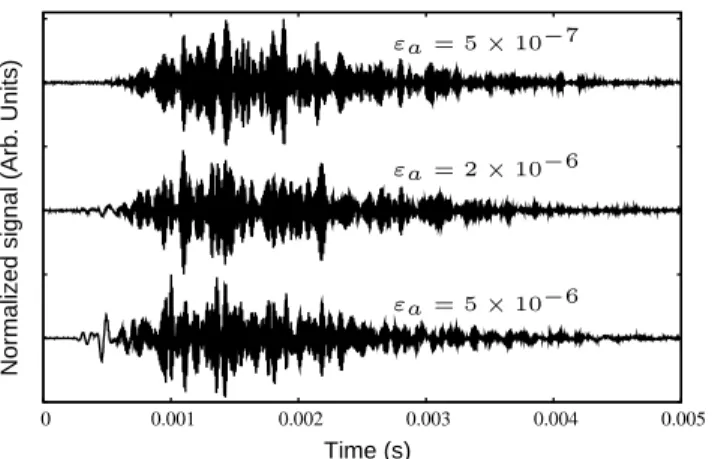
FIG. 2: Experimental temporal signals that are typically re-ceived for different excitation amplitudes. The applied static stress is ∼ 300 kP a and the emitter - receiver distance is D= 10.5 cm.
B. Multiple scattering and nonlinearity
The signals presented in Fig. 2 are typical experimen-tal signals that can be observed when the initial acoustic wavelength is of the order or less than the bead size and for a static stress larger than ∼ 100 kP a). For an estima-tion of the wavelength, one can use the elastic parameters of glass and the stress-strain relationship of an average loaded contact in an effective medium theory. However, it is important to keep in mind that this definition ne-glects wave velocity dispersion which can be important when the spatial scale of the beads coincides with the wavelength. As an estimation, the wave velocity in a dis-ordered three-dimensional packing of 2 mm glass beads with an applied static stress of 200 kP a is ∼ 300±40 m/s, which gives a wavelength of ∼ 3 ± 0.4 mm at 100 kHz. This means that for a wave packet centered on 100 kHz, submitted to a 200 kP a static stress, the wavelength is of the order of the bead diameter, and consequently, strong scattering occurs. The typical experimental signals re-ceived in this case are strongly distorted due to multiple scattering, lasting from 10 to 100 times longer than the emitted signal (see Fig. 2). This feature is widely ob-served in seismics [21] or in multiple scattering experi-ments, and has been observed in roughly the same con-ditions in glass bead assemblage [12]. However, we found another feature in this case, not mentioned previously in the literature: for different excitation amplitudes, the normalized signals in Fig. 2 are different. This relative amplitude and shape dependence is the signature of a nonlinear process. One obvious difference between the traces is the emergence, for an increasing excitation am-plitude, of a signal at earlier times, relatively lower in frequency than the 100 kHz coda-type signal. We veri-fied in several other experiments [7, 13] that this LF sig-nal is the self-demodulated contribution associated with the rectification (demodulation) of the initial HF wave packet. Its nonlinear nature is evidenced by its nonlinear
Frequency (kHz)
Emitted spectrum
Normalized spectra (Arb. Units)
0 50 100 150 200
εa = 5 × 10⁻⁷
εa = 2 × 10⁻⁶
εa = 5 × 10⁻⁶
FIG. 3: Experimental spectra corresponding to temporal sig-nals of Fig. 2. The spectrum of the emitted signal with a 22% FWHM (full width at half maximum) is superimposed on the top curve.
amplitude dependence on the excitation amplitude. This is an important difference compared to results [8, 12], where the very same types of signals were observed (for instance for εa = 5 × 10
−6
in Fig. 2). In [12], the LF contribution is identified as the linear coherent part of the propagated initial pulse, and the HF contribution is interpreted as the multiply scattered signal part. A pos-sible explanation for such a different observation (mainly in the amplitude dynamics behavior and physical nature of the LF signal) is the difference in the spectral width of the emitted signal spectra. In Ref. [12], the signal spectrum width is relatively wide, which may allow for the direct radiation of the linear coherent LF component in the medium. Then, the observation may be inter-preted as a strong frequency dependent transmission in the medium (due to absorption and scattering), which is able to modify importantly the transport character of dif-ferent frequencies (propagative as in an effective medium, multiply scattered, diffusive...).
In the present case however, when the emitted spec-trum is sharper, the direct radiation of the LF signal is negligible (and in any case is avoided by a high-pass filter in the setup). This LF signal is generated in the medium itself, by nonlinear processes of frequency mixing [7], widely described in the literature [31, 32, 33, 34, 35]. This can be seen in Fig. 3, where the relative amplitudes of the LF and the HF contributions are modified by in-creasing the excitation amplitude.
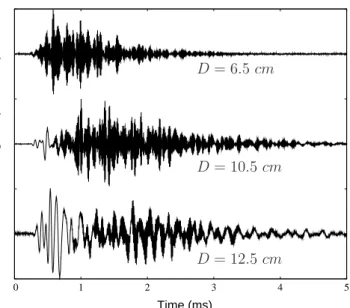
In Fig. 4, the received temporal signals are presented for three source-receiver distances, with the same ap-plied static stress 300 kP a (measured with a precision of ∼ 3 % which is not sufficient to perform precise quanti-tative measurements). An important qualiquanti-tative feature observed on these normalized (by their maximum) traces is the relative increase of the LF contribution compared to the HF one with distance. This feature is usually ob-served for the nonlinear self-demodulation process [31],
Time (ms)
Normalized signals (Arb. Units)
0 1 2 3 4 5
D = 6.5 cm
D = 10.5 cm
D = 12.5 cm
FIG. 4: Signals received after propagation through different thicknesses of granular medium, for identical static pressure of 300 kPa and excitation amplitude εa= 5 × 10
−6
.
where over a sufficient distance, only the LF contribution is detectable, due to the difference in attenuation of the HF and the LF waves. In this experiment, the LF signal absolute energy is measured to be roughly constant with distance, while the received HF signal energy is decreas-ing drastically. The former is a result of the competition between nonlinear effects, which pump low frequencies through frequency-down-conversion processes, and linear attenuation.
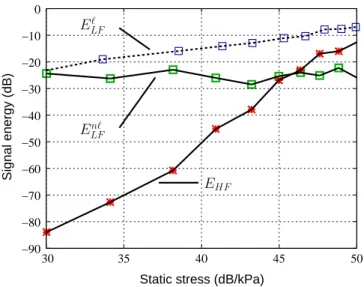
In Fig. 5, the total energy of different signals is plotted as a function of the applied static stress for a propaga-tion distance D = 12.5 cm and an excitapropaga-tion amplitude εa≃ εmax/50, where εmax≃ 10−5. Three signal energies are defined here: the energy of the HF contribution EHF, the energy of the LF contribution Enℓ
LF and the energy of a directly radiated LF signal Eℓ
LF (in this case, a LF pulse with the same frequency content as the nonlinearly demodulated pulse is directly excited by the emitter and received after linear propagation). First, comparing the received energies EHF and EℓLF evolution as a function of the applied static stress, an important slope difference is clearly visible: Eℓ
LF dependence on stress is less than to a power 1 and EHF dependence is close to a power 4 of the stress. In order to explain this difference in the evolution of the transmitted energy as a function of the applied static stress, one should recall that two dominant processes of sound attenuation may play a role: the scat-tering and the absorption due to linear processes. Con-sidering that the scattering of the HF ∼ 100 kHz, is much more important than for the LF ∼ 10 kHz, the observed difference may be attributed to the strong stress depen-dent scattering. This is consistent with the simple idea that by increasing the static stress, contacts are created which adds new paths (or strengthen existing paths) of
Static stress (dB/kPa) Signal energy (dB) −90 −80 −70 −60 −50 −40 −30 −20 −10 0 35 40 45 30 50 EH F ELFnℓ Eℓ LF
FIG. 5: Signal energy dynamics as a function of the applied static pressure. The HF (EHF) and LF (ELFnℓ) contributions
are separated by filtering. The energy of a reference LF (Eℓ LF)
linear signal is also plotted for comparison.
acoustic energy transmission. Moreover, waves follow-ing force chains with a given stress may change from an evanescent character to a propagative one with in-creasing stress, because the cut-off frequency (sometimes called the Einstein frequency) is increased [30, 36, 37]. It is then possible to ask if this scattering which strongly depends on static stress depends also on the acoustic am-plitude of excitation. Is the acoustic wave able to switch dynamically propagation paths or force chains? The aim of the next section is to analyze this opportunity and its possible manifestations.
The competition between nonlinear effects and atten-uation is also visible in Fig. 5 when comparing the dy-namics of Eℓ
LF and ELFnℓ. For signals having the same low frequency propagating through the same medium but generated either directly by a transducer or by nonlinear effects inside the medium itself, the energy dynamics as a function of the applied static stress is different. It can be assumed that the linear attenuation varies in the same way for both signals while the nonlinearity of the medium and the HF attenuation both playing a role in the genera-tion of the LF signal [31] may be strongly affected. These modifications only affect the nonlinearly generated sig-nal. The Enℓ
LF dynamics as a function of the applied static stress is almost constant, while the Eℓ
LF is increasing. It means that the efficiency of the nonlinear interactions leading to the self-demodulated signal is decreasing with increasing static stress. Two main processes can lead to a diminishing of the nonlinear interaction efficiency: the HF attenuation increase (the amplitude of the nonlinear sources diminishes) and the intrinsic nonlinearity of the medium decrease. As the HF attenuation (probed by the dynamics of EHF) is strongly diminishing with increas-ing static stress, it means that the nonlinearity of the
medium is decreasing with increasing static stress. This is consistent with estimates based on the Hertzian con-tact nonlinearity and experimental observations [7, 13].
Now, we analyze the temporal features of the HF sig-nals, namely the codas. Coda features can be analyzed by performing an envelope detection (for instance by in-tegrating the square field over a sliding window). This may cause problems for quantitative analysis because one has a degree of freedom for the size of the sliding win-dow. In principle, the diffusion approximation is shown to be valid for the configurational average intensity hIi of the incoherent field under some conditions [38]. The incoherent field can be defined as the contribution which cancels out with averaging over different realizations of the disorder in the medium [38, 39]. The average inten-sity hIi is usually accessed experimentally by the use of an intensity sensor, which is large compared to the wave-length (a photo-multiplier in optics for instance). For elastic waves however, the piezo-electric transducers are sensitive to the field itself. It is thus necessary, in order to record hIi, to record wave field signals, then to calculate the corresponding intensities, and finally to average the different obtained intensities over different configurations of the disorder. However, when the receiving transducer has a sensitive surface with dimensions larger than the wavelength, a spatial averaging is performed on the field. In this operation, the incoherent contribution is dimin-ished compared to the coherent one. Consequently, even if most of the energy is incoherent at the receiver loca-tion, there could be some situations where the detected signal is composed of coherent and incoherent parts of comparable importance.
In unconsolidated granular media, the configurational averaging can be performed by several means, which may not be equivalent. One could use arrays of transduc-ers for the excitation and detection of the multiple scat-tered waves, each transducer being small compared to the wavelength. Then without modifying the medium, each emitter - receiver couple, for the same distance through the medium could provide a signal to be treated. Other-wise, with one emitter and one receiver, one could mod-ify the structure of the medium (geometrical and contact force disorder) by keeping constant as much as possi-ble the macroscopic external conditions [8]. These two means can allow in some limits for an estimation of the diffusivity and the absorption characteristic time of the diffusion equation. The first method necessitates small enough transducers to avoid averaging of the field, which causes problems of coupling with the medium when the wavelength is of the order of the bead diameter and the transducer size. Some of the transducers may not be in efficient contact with beads. The second method, due to the memory effects [27, 40] or the drastic influence of the external parameters on the elastic properties (see Fig. 5 for instance), does not guarantee to be in the same ex-perimental conditions from one realization of the disorder to another. Small perturbations or local modifications of the contacts forces in the medium are consequently
diffi-Time (ms) Time (ms) Emitted signal Emitted signal
High−pass filtered signals (normalized)
Wide−band signals (normalized)
(a)
(b)
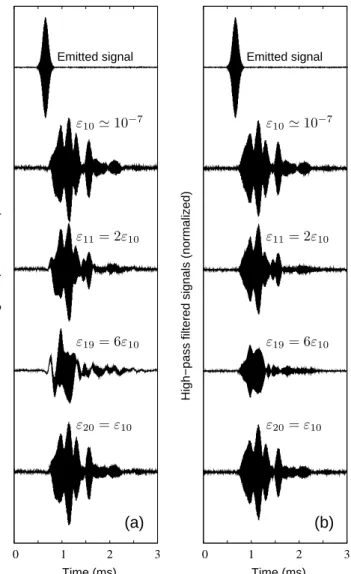
0 1 2 3 0 1 2 3 ε20= ε10 ε19= 6ε10 ε11= 2ε10 ε10≃ 10−7 ε10≃ 10−7 ε11= 2ε10 ε19= 6ε10 ε20= ε10FIG. 6: Typical temporal signals (normalized by the excita-tion amplitude) that are received at a distance of 6 cm from the emitter for different excitation amplitudes. The emitted signal is a Gaussian wave packet centered on 100 kHz with a full width at half maximum (FWHM) of 6% in frequency. a) Row signals, b) High-pass filtered signals.
cult to probe using averaged quantities, obviously more adequate for an estimation of average properties of the medium.
C. Analysis of the amplitude dependent codas
In this section, we investigate fast dynamic modifica-tions of the medium submitted to an acoustic wave, as well as slow dynamic modifications or permanent mod-ifications of the medium. The experimental configura-tion is slightly different from the one in the previous sec-tion. Some glass beads have been glued to the shear emitting transducer surface, in order to couple better to the medium and to have a better signal to noise ratio.
The analysis of the obtained spectra indicates that it is impossible to detect neither the second nor the third harmonic component, certainly due to the strong ob-served attenuation above 100 kHz. However, the self-demodulated wave is quite easily generated and detected because of its lower attenuation. In the following, the HF coda contribution and this LF self-demodulated contri-bution are separated by post-processing filtering in order to analyze in details the different amplitude dependent processes.
In Fig. 6(a), typical signals that are received by a sensi-tive wide-band longitudinal transducer (with a sensisensi-tive surface of 4.5 cm in diameter) are presented. The ex-perimental protocol elaborated in order to analyze the amplitude dependent effects of acoustic wave transport is presented in Fig. 7(d). It contains 59 successive excita-tion amplitudes. The 10 first amplitudes, as well as the last 10 amplitudes, are identical and relatively low (the acoustic strain is εa = ε1−10 ≃ 10
−7
). The odd num-bered amplitudes 11-49 are gradually increasing up to a maximum amplitude of εa≃ 10−5, while the even ampli-tudes 10-50 are equal to the minimum probe amplitude εa ≃ 10−7. This allows to compare the response of the medium for different excitation amplitudes, but also, to visualize the medium modifications after being excited by a strong wave by using the weak probe wave. The experiment time for the acquisition of one signal of this protocol is close to 30 s. In Fig. 6, signals are numbered according to their excitation amplitude in the protocol, the first signal of the protocol being denoted by s1. The excitation signal is a sine wave modulated in amplitude with a Gaussian function of 6% full width at half max-imum (FWHM) in the frequency domain, which, at the central frequency f0 = 100 kHz gives a ∼ 0.2 ms dura-tion pulse at half the maximum. This duradura-tion is roughly the time necessary for the wave to travel from the emitter to the receiver for the 6 cm distance.
In Fig. 6(a), received signals over the full available fre-quency band (from 1 kHz to 300 kHz) are presented for several excitation amplitudes of the protocole: ε10, ε11, ε19, ε20. The signal structure is quite complicated and shows several packets typically 4-5, having a shape close to the emitted signal. It is important to note here that the time dependent intensity of these signals is much different from a diffusive type enveloppe, even if the av-erage wavelength is of the order of the bead radius. An-other important feature is the emergence, at a sufficiently high excitation amplitude of a relatively low frequency (LF) signal (see for instance signal s19 corresponding to the amplitude ε19 in Fig. 6(a)). Due to its ampli-tude dependent character (this signal is not visible for lower excitation amplitudes), this LF signal is nonlinear, and has been identified in previous works as being a self-demodulated contribution [7, 13].
In the following, we analyze in details the high fre-quency part of the signals, and for quantitative compar-ison, the raw signals are high-pass filtered (Fig. 6(b)). These coda-type signals have comparable time durations
to those of Fig. 2, but their envelope characteristic fre-quency is lower. This is a consequence of the narrower Gaussian spectrum of excitation. However, despite of the difference in coda shape, the characteristics of wave transport are similar. The most important characteris-tics of the signal evolution with excitation amplitude is the fact that their temporal shape is strongly modified, even for very moderate changes in the excitation ampli-tude. This can be seen by comparing the shapes s10 and s11 in Fig. 6(b). Of course, by increasing further the excitation amplitude, the distortion is further increased (signal s19). When the excitation amplitude is decreased down to the lowest amplitude of the protocole, i.e. to the probe amplitude ε1, the shape modification of s20 compared to s1is barely noticeable. In order to monitor quantitatively the modifications of the signal shapes due to amplitude dependent effects, we make use of the fol-lowing parameter Rm,ndefined from the inter-correlation function Cn,m(t) =R
T
0 sn(t)sm(t − τ)dτ, where T is the observation window duration, by
Rn,m=
Cn,m(0) pCn,n(0)Cm,m(0)
. (1)
The energy of signal sn (respectively sm) is propor-tional to Cnn(0) (respectively Cmm(0)). The normaliza-tion bypCnn(0)Cmm(0) makes consequently the param-eter Rn,m independent of the actual energies of sn and sm, which is important in our case where signals with dif-ferent amplitudes are compared. The parameter is only dependent on the relative shapes of the signals and can be seen as the level of resemblance of two signals, equal to 1 if the two signals are exactly the same and progressively diminishing when the signals differ.
In Fig. 7(a), the parameter Rn,1is plotted for each sig-nal s1 to s59 of the experimental protocol. It is clearly visible that the parameter R11,1 goes under a value of 0.9 while the signals s2 to s10 exhibit a very accurate correlation with s1 (R2−10,1≃ 1). When the amplitude is increased further, the parameter Rn,1 decreases dras-tically to 0 or less, which shows that a strong field mod-ification occured (the negative values of the parameter Rm,ndo not have a particular meaning, except when the value reaches −1, which means that the signal phases are inverted). Concerning the even signals generated with a low excitation amplitude, their resemblance parameter remains practically equals to 1 up to the 30th signal of the protocol. This means that no modification of the granular medium elasticity is detectable by this acoustic probing. In contrary, when higher acoustic amplitudes are generated in the medium, the level of resemblance of the probe wave with the first signals of the protocol be-gins to fall down progressively, until the typical value of 0.6 after the maximum excitation strain ε49. The acous-tical properties of the medium have been modified by the strong wave action. A possible interpretation of this experimental observation could be found in the temper-ature effects on the linear and nonlinear hysteretic
prop-Excitation amplitude Signal number (Norm.) (a) (b) (c) (d) 0 0.2 0.4 0.6 0.8 1 0 10 20 30 40 50 60 −0.8 0 1 0 10 20 30 40 50 60 0.98 1.02 1.06 1.1 1.14 0 10 20 30 40 50 60 −0.8 0 0 10 20 30 40 50 60 1 Rn ,1 Rn ,n − 1 Te
FIG. 7: (a) Resemblance parameter Rn,1between the signal
number n and the signal number 1 of the protocol (d). (b) Resemblance parameter Rn,n−1 between the signal number n
and the signal number n − 1 of the protocol (d). (c) Arrival time Te of half the signal energy as a function of the signal
number in the protocol (d). (d) Protocol for the successive excitation amplitudes of the experiment.
erties of the medium [41]. The wave action on the con-tacts increases the average temperature and consequently modifies the linear and nonlinear contact properties for some characteristic time which can be of the order of sev-eral acoustic periods. Elastic memory effects at the level of the contacts themselves (stick-slip motion for Hertz-Mindlin contacts for instance [42]) or at the mesoscopic scale [27] could also contribute.
When, at the end of the protocol, only the probe am-plitude is generated (signals s50 to s59), the parameter Rn,1tends to 1 with time, the acoustic properties of the medium are progressively recovered in a slow healing pro-cess. The parameter Rn,n−1 in Fig. 7(b) shows the level of resemblance of two successive signals. It is interest-ing to see that in this healinterest-ing process at the end of the protocol, two successive signals are practically identical. The process of healing is slowly cumulative. This effect can be seen as a slow dynamic effect observed for elas-tic waves in other materials too, such as sandstones and cracked solids [43, 44]: the strong wave action modifies the acoustic properties of the medium, which are slowly recovered after some time, long compared to the wave period. The probing of this slow process is sometimes a
powerful indication of damage (associated with the pres-ence of internal contacts) in materials [45].
The last parameter plotted in Fig. 7(c) is the charac-teristic time Tecorresponding to the arrival time of half the total energy of the signal. It exhibits a quite clear amplitude dependence and has the same qualitative be-havior as the parameter Rn,1. Until the 30th amplitude of the protocol (ε33≃ 0.3×10
−5
), the characteristic time Te of the probe wave (even numbers of signals) remains unchanged, while the signals s11 to s31 exhibit a dimin-ishing characteristic time Te. It means that either the wave packet is propagating faster (nonlinear hardening of the medium), either the signal energy is preferentially attenuated at later times. Due to the strong nonlinear attenuation observed in the temporal signals of Fig. 6(b), the second process seems more adequate to explain the Tedependence on amplitude. This is visible in Fig. 6(b) when comparing signals s10 and s11 or s10 and s19. No shift in time is detectable while the last part of the signals are strongly attenuated relatively to their first part.
In order to analyze these amplitude dependent effects on the signal energy attenuation, it is adequate now to focus on the energetical properties of the signals. In Fig. 8(d), the experimental amplitude protocol is re-called. The total energies of the high-pass filtered sig-nals CHF
n,n(0) are normalized by a quantity proportional to the excitation energy ε2
n both for the low excitation amplitudes of the protocol (Fig. 8(a)) and for the higher excitation amplitudes (Fig. 8(b)). The parts comprised between the dashed-lines compare the same range of nor-malized energy, from nornor-malized values 0.8 to 1.1 roughly, that are the extreme values taken by the signals excited with the weak probe amplitude. The lowest value ob-served in Fig. 8(a) corresponds to an excitation ampli-tude range where the parameter Rn,1 begins to decrease from 1 to a lower value. It is important to note that for the normalized energies associated with the higher exci-tation amplitudes, in Fig. 8(b), all the values are below the region delimited by the dashed lines, which means that energy absorption is always stronger for εa > ε1 even when the acoustic response of the medium has been modified by a strong wave action (even signals s40to s50 for instance). The general behavior of the normalized energy for increasing excitation amplitudes is decreasing and monotonous: the higher the excitation amplitude is, the higher the energy absorption is. Its associated energy is consequently deviating from the ε2
n law. The nonlinear energy of the LF demodulated part is increas-ing monotonously with the excitation amplitude. The LF energy exceeds the HF energy of the signal from the excitation amplitude ε41, as seen in Fig. 8(c) when the LF energy is above the region delimited by the dashed lines.
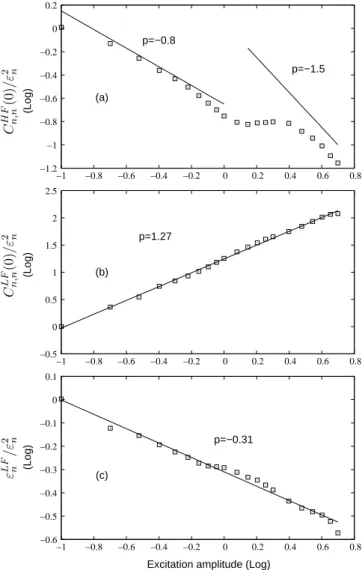
In order to analyze more precisely the nonlinear self-action process for the HF components and the LF en-ergy nonlinear increase process, their normalized energies are plotted as a function of the excitation amplitude in log-log scale, and compared to power laws in Fig. 9. In
(Norm.) Signal number Excitation amplitude (d) (c) (b) (a) 0 0.1 0.2 0.3 0.4 0.5 0.6 0.7 0.8 0.9 1 0 10 20 30 40 50 60 0 0.1 0.2 0.3 0.4 0.5 0.6 0.7 0.8 0.9 1 1.1 0 10 20 30 40 50 60 0 0.5 1 1.5 2 2.5 0 10 20 30 40 50 60 0.8 0.9 1 1.1 0 10 20 30 40 50 60 C H F n ,n (0 )/ ε 2 n C H F n ,n (0 )/ ε 2 n C L F n ,n (0 )/ ε 2 n
FIG. 8: (a) Energy of the high-pass filtered signals CHF n,n(0)
normalized by a quantity proportional to the excitation en-ergy ε2
nfor the low excitation amplitudes of the protocol (d).
(b) Energy of the high-pass filtered signals for the higher exci-tation amplitudes of the protocol. (c) Energy of the low-pass filtered signals for the higher excitation amplitudes of the pro-tocol. (d) Protocol for the successive excitation amplitudes of the experiment.
Fig. 9(a), the normalized HF energy is plotted as a func-tion of the excitafunc-tion amplitude. This is the same quan-tity as that of Fig. 8(b). For the lowest excitation ampli-tudes, the normalized CHF
n,n(0)/ε 2
n is decreasing close to a power law ε−0.8
a , which means that the energy Cn,nHF(0) is increasing with a ε1.2
a dependence. In a perfectly lin-ear system, it would be a ε2
a dependence. Note that the overall behavior is close to a ε1.25
a dependence, which is a dramatic deviation from the linear law ε2
aand also a very strong self-action compared to usually observed satura-tion processes in rocks for instance [46]. For higher exci-tation amplitudes, a small plateau is observed, denoting
a local comportment law close to the linear one ε2
a, even if the process leading to this locally linear behavior may be due to combined effects of different nonlinear processes: self-transparency, slow-dynamics, conditioning... For the highest excitation amplitudes, the dependence on ampli-tude is the strongest, approaching a ε0.5
a law for Cn,nHF(0). This means that if the excitation energy is multiplied by a factor 4 for instance, the received energy is multiplied by a factor√2. This would be an even stronger effect for the late part of the signal considering the fact that most of the nonlinearly attenuated energy is the one arriving at the latest time in the signal, according to Fig. 6 and Fig. 7. Surprisingly, the largest amplitudes of the signal are not strongly nonlinearly attenuated but the late con-tributions are. This peculiar observation is discussed in section III.
In Fig. 9(b), the normalized LF part energy CLF n,n(0)/ε
2 n is plotted in log-log scale as a function of the excita-tion amplitude. A quite clear power law ε1.27
a is found for this NL process of frequency-down conversion (self-demodulation), which corresponds to a LF energy pro-portional to ε3.27
a . The classical NL behavior observed in homogeneous media with a quadratic nonlinearity is ε4 a for the LF energy [31]. The observed dependence corre-sponds to a ε1.63
a power law for the field itself, to be com-pared to the ε2
alaw classically observed. This dependence is also closely observed with another processing method applied to the LF part: the normalized peak-to-peak amplitude of the LF contribution εLF
n /ε 2
n is plotted in Fig. 9(c) in log-log scale. A power law behavior ε−0.31
a can
be observed, that is a law ε1.69
a for the dynamics of εLFn . If compared to the behavior obtained with CLF
n,n(0) ∝ ε 3.27 a , taking into account that CLF
n,n(0) ∝ (εLHn ) 2 , this dynam-ics corresponds to a ε1.69×2 a = ε 3.38
a law. This is an in-termediate dependence between the classical one ε4
a and the Hertzian clapping limit ε3
a. The latter dependence law has been observed earlier in different experimental conditions in [7]. Note that for symmetry reasons, the Hertz-Mindlin hysteretic nonlinearity is not able to pre-dict the effect of self-demodulation observed here at the leading order of the nonlinear approximation, and may not contribute [47, 48].
III. SUMMARY OF THE RESULTS AND
DISCUSSIONS
Different experimental observations have been pre-sented for the first time and the main results can be summarized as the following:
• observation of the coexistence of a nonlinear self-demodulated LF wave together with a HF coda-type wave (Fig. 2),
• a drastic increase of the HF coda energy with static stress, compared to the dependence of the LF wave energy (Fig. 4),
Excitation amplitude (Log)
(Log) (Log) (Log) (c) (b) (a) p=1.27 p=−0.8 p=−1.5 p=−0.31 −1.2 −1 −0.8 −0.6 −0.4 −0.2 0 0.2 −1 −0.8 −0.6 −0.4 −0.2 0 0.2 0.4 0.6 0.8 −0.5 0 0.5 1 1.5 2 2.5 −1 −0.8 −0.6 −0.4 −0.2 0 0.2 0.4 0.6 0.8 −0.6 −0.5 −0.4 −0.3 −0.2 −0.1 0 0.1 −1 −0.8 −0.6 −0.4 −0.2 0 0.2 0.4 0.6 0.8 ε L F n /ε 2 n C L F n ,n (0 )/ ε 2 n C H F n ,n (0 )/ ε 2 n
FIG. 9: (a) Energy of the high-pass filtered signals CHF n,n(0)
normalized by a quantity proportional to the excitation en-ergy ε2
n as a function of the excitation amplitude in log-log
scale. (b) Energy of the low-pass filtered signals CLF n,n(0)
nor-malized by a quantity proportional to the excitation energy ε2 n
as a function of the excitation amplitude in log-log scale (c) Peak-to-peak amplitude of the self-demodulated signal nor-malized by ε2
nin log-log scale.
• a strong shape dependence of the coda on the acoustic excitation amplitude (Fig. 5 and Fig. 6), and especially a strong nonlinear attenuation of the coda wave at the latest arrival times,
• almost no variation in the acoustic properties of the medium after moderate acoustic excitations up to an excitation acoustic strain of εa∼ 0.3×10⁻⁵, cor-responding to signal number 31 (this represents a ratio of dynamic over static deformation of εa/ε0≃ 5 × 10⁻³
),
• dynamic modifications of the acoustic properties (nonlinear self-action, fast dynamics) even at low excitation levels εa∼ 2×10⁻⁷corresponding to
sig-nal number 11 (this represents a ratio of dynamic over static deformation of εa/ε0≃ 3 × 10⁻⁴), • modification of the acoustic properties after large
excitation levels (slow dynamics and conditioning effects), followed by a slow recovery.
Having in mind the ray acoustic approximation in this experiment of multiple scattering of elastic waves, the first part of the coda signals can be associated with short propagation paths while the last part of the coda sig-nals may be associated with longer propagation paths. Note that the lengths of the long propagation paths can exceed the container size by a factor of 10, which means that reflexions on the container sides may occur. In prin-ciple, nonlinear attenuation should be more visible on the long propagation paths than on the short ones because the distance for the accumulation of this nonlinear pro-cess is larger [31, 47]. This explains the stronger effect of nonlinear attenuation on the last part of coda signals, that experienced longer propagation paths. The physi-cal nature of this nonlinear attenuation process remains undetermined. Nonlinear scattering of the elastic waves due to opening or closing of the weakest contacts and therefore dynamic switching of propagation paths under the wave action could explain the nonlinear attenuation. This is in agreement with the drastic dependence of the HF coda wave energy transmission on the applied static stress. Nonlinear absorption of the elastic waves at the contacts by stick-slip [42] or thermo-elasticity [43] pro-cesses could also contribute. Recent numerical simula-tions of the acoustic propagation through unconsolidated granular packings [49, 50] could provide an interesting insight in the processes involved in the experimentally observed nonlinear attenuation.
For both nonlinear scattering and nonlinear absorp-tion, the weakest contacts are supposed to be responsi-ble for the main contribution, especially for such small acoustic excitation strains as εa ≃ 10
−7
. Coda signals are shown to be particularly sensitive to these weak contacts, certainly due to the fact that energy is well distributed over the entire medium, including weak contacts, after few milliseconds (coda signals have durations larger than 2 ms, which corresponds to propagation paths much larger than the emitter - receiver distance). Moreover, the wavelength being of the order of the bead diameter (λ ∼ d), small features as small as the beads and their contacts are resolved by the acoustic wave. This is not the case for long wavelength propagation (λ ≫ d), which is known to be less sensitive to the weak contacts in the medium and more influenced by the average properties of the medium [7, 9].
The modification of the acoustic properties after the application of a strong excitation, is commonly re-lated to the effect of conditioning and slow dynamics [26, 43, 44, 51]. This addresses the problem of the
acous-tic wave influence on the granular medium state and memory. Under a given threshold, the medium is appar-ently not modified (under excitation amplitude number 31, εa ≃ 0.3 10−5which corresponds to a ratio of dynamic over static deformation of εa/ε0≃ 5 × 10
−3
), while over some excitation amplitude, the medium exhibits mem-ory of the past acoustic excitation. Coda signal analysis is shown to be a powerful tool to monitor slight mod-ifications in the acoustic response of an unconsolidated granular structure as a function of time, the resolution (including some time averaging) being of the order of the second.
IV. CONCLUSIONS
In this work, experimental results on the nonlinear transport of short wavelength acoustic waves (of the or-der of the bead diameter) are reported. It is shown that the amplitude dependence of the codas is strong, and contains some information on the strength of the propagation paths in the medium. An amplitude depen-dent attenuation is visible on the characteristic time Te, which diminishes with the excitation amplitude: most of the nonlinear self-action effects take place at the latest arrival times of the coda signals. This shows that the field which encountered the larger number of scattering events, or which does not follow the strongest force chains is more influenced by the effects of nonlinear dissipation (stick-slip, sliding, or thermo-elastic losses) and nonlin-ear scattering (closing or opening of the weak contacts for instance).
Among the possible applications of such experimental results is the non destructive testing (NDT) of granular structures with nonlinear acoustic methods, in particular with multiple scattered waves (coda signals), in contrast to the widely used and recent nonlinear methods employ-ing coherent wave interactions [52, 53]. For this purpose, it would be of interest to make use in the future of the coda wave interferometry technique [54, 55, 56].
It has been shown that the acoustic properties of the medium can be modified temporary by a strong acous-tic excitation. In the context of NDT, this work show the range of acoustic amplitudes to use (or the time nec-essary to recover the initial state) in order to stay in a regime where the acoustic waves do not modify the elastic response of the medium.
Acknowledgments
This work is supported by ANR project “grANuLar” NT05-3 41989. The authors would like to thank E. Brasseur, E. Egon and P. Collas for their technical help on the experimental setup.
[1] M. Cates, J. Wittmer, J.-P. Bouchaud, and P. Claudin, Phys. Rev. Lett. 81, 1841 (1998).
[2] P. Richard, M. Nicomedi, R. Delannay, P. Ribi`ere, and D. Bideau, Nature Mat. 4, 121 (2005).
[3] P. de Gennes, Rev. Mod. Phys. 71, S374 (1999). [4] H. Jaeger and S. Nagel, Science 255, 1523 (1992). [5] C.-H. Liu and S. Nagel, Phys. Rev. Lett. 68, 2301 (1992). [6] C.-H. Liu and S. Nagel, Phys. Rev. B 48, 15646 (1993). [7] V. Tournat, V. Y. Zaitsev, V. Gusev, V. Nazarov,
P. B´equin, and B. Castagn`ede, Phys. Rev. Lett. 92, 85502 (2004).
[8] X. Jia, Phys. Rev. Lett. 93, 154303 (2004).
[9] V. Zaitsev, V. Nazarov, V. Tournat, V. Gusev, and B. Castagn`ede, Europhys. Lett. 70, 607 (2005).
[10] D. Blair, N. Mueggenburg, A. Marshall, H. Jaeger, and S. Nagel, Phys. Rev. E 63, 041304 (2001).
[11] D. Mueth, H. Jaeger, and S. Nagel, Phys. Rev. E 57, 3164 (1998).
[12] X. Jia, C. Caroli, and B. velicky, Phys. Rev. Lett. 81, 1863 (1999).
[13] V. Tournat, B. Castagn`ede, V. Gusev, and P. B´equin, C. R. Mecanique 331, 119 (2003).
[14] H. Makse, N. Gland, D. Johnson, and L. Schwartz, Phys. Rev. E 70, 061302 (2004).
[15] J. Goddard, Proceedings: Mathematical and Physical Sciences 430, 105 (1990).
[16] V. Tournat, V. Gusev, and B. Castagn`ede, Phys. Lett. A 326, 340 (2004).
[17] V. Tournat, V. Gusev, V. Zaitsev, and B. Castagn`ede, Europhys. Lett. 66, 798 (2004).
[18] A. Tourin, A. Derode, A. Peyre, and M. Fink, J. Acoust. Soc. Am. 108, 503 (2000).
[19] R. Weaver, J. Acoust. Soc. Am. 71, 1608 (1982). [20] H. Schriemer, M. Cowan, J. Page, P. Sheng, Z. Liu, and
D. Weitz, Phys. Rev. Lett. 79, 3166 (1997).
[21] K. Aki and B. Chouet, J. of Geophys. Res. 80, 3322 (1975).
[22] R. Hennino, N. Tr´egour`es, N. Shapiro, L. Margerin, M. Campillo, B. van Tiggelen, and R. Weaver, Phys. Rev. Lett. 86, 3447 (2001).
[23] V. Tournat, V. Gusev, and B. Castagn`ede, in AIP Conf. Proc., ISNA17th(may 30 2006), vol. 838, pp. 67–70. [24] V. Tournat and V. Gusev, in Proc. of the 19th ICA
(2007), pp. PHY–03–004.
[25] R. Guyer, K. McCall, and G. Boitnott, Phys. Rev. Lett. 74, 3491 (1995).
[26] D. Holcomb, J. Geophys. Res. 86, 6235 (1981).
[27] C. Josserand, A. Tkachenko, D. Mueth, and H. Jaeger, Phys. Rev. Lett. 85, 3632 (2000).
[28] C. Inserra, V. Tournat, and V. Gusev, Appl. Phys. Lett.
92, 191916 (2008).
[29] J. Erikson, N. Mueggenburg, H. Jaeger, and S. Nagel, Phys. Rev. E 66, 040301 (2002).
[30] C. Coste and B. Gilles, Phys. Rev. E 77, 021302 (2008). [31] B. Novikov, O. Rudenko, and V. Timochenko, Nonlinear
Underwater Acoustics (ASA, New-York, 1987). [32] P. Westervelt, J. Acoust. Soc. Am. 35, 535 (1963). [33] V. Zaitsev, A. Kolpabov, and V. Nazarov, Sov. Phys.
Acoust. 45, 305 (1999).
[34] V. Zverev, Acoust. Phys. 45, 611 (1999).
[35] V. Zaitsev, A. Kolpabov, and V. Nazarov, Sov. Phys. Acoust. 45, 202 (1999).
[36] B. Gilles and C. Coste, Phys. Rev. Lett. 90, 174302 (2003).
[37] V. Tournat, V. Gusev, and B. Castagn`ede, Phys. Rev. E 70, 56603 (2004).
[38] A. Derode, A. Tourin, and M. Fink, Phys. Rev. E 64, 036606 (2001).
[39] A. Derode, A. Tourin, and M. Fink, Phys. Rev. E 64, 036605 (2001).
[40] A. Moussatov, B. Castagn`ede, and V. Gusev, Phys. Lett. A 283, 216 (2001).
[41] V. Gusev and V. Tournat, Phys. Rev. B 72, 054104 (2005).
[42] R. Mindlin and H. Deresiewicz, J. Appl. Mech. 20, 327 (1953).
[43] V. Zaitsev, V. Gusev, and B. Castagn`ede, Phys. Rev. Lett. 90, 075501 (2003).
[44] P. Johnson and A. Sutin, J. Acoust. Soc. Am. 117, 124 (2005).
[45] M. Bentahar, H. E. Aqra, R. E. Guerjouma, M. Griffa, and M. Scalerandi, Phys. Rev. B 73, 014116 (2006). [46] J. White, Underground sound (Elsevier, Amsterdam,
1983).
[47] L. Zarembo and V. Krasilnikov, Sov. Phys. Uspekhi 13, 778 (1971).
[48] V. Gusev, Acoust. Lett. 22, 30 (1998). [49] S. Luding, Nature 435, 159 (2005).
[50] O. Mouraille and S. Luding, Ultrasonics (in press) (2008). [51] P. Johnson and X. Jia, Nature 437, 871 (2005).
[52] X. Jacob, C. Barri`ere, and D. Royer, Appl. Phys. Lett. 82, 886 (2003).
[53] Y. Zheng, R. Maev, and I. Solodov, Can. J. Phys. 77, 927 (1999).
[54] R. Snieder, A. Grˆet, H. Douma, and J. Scales, Science 295, 2253 (2002).
[55] O. Lobkis and R. Weaver, Phys. Rev. Lett. 90, 254302 (2003).