Centrosome Motility Is Essential for
Initial Axon Formation in the Neocortex
The MIT Faculty has made this article openly available.
Please share
how this access benefits you. Your story matters.
Citation
de Anda, F. C. et al. “Centrosome Motility Is Essential for Initial Axon
Formation in the Neocortex.” Journal of Neuroscience 30.31 (2010):
10391–10406. Web. 27 June 2012.
As Published
http://dx.doi.org/10.1523/jneurosci.0381-10.2010
Publisher
Society for Neuroscience
Version
Final published version
Citable link
http://hdl.handle.net/1721.1/71218
Terms of Use
Article is made available in accordance with the publisher's
policy and may be subject to US copyright law. Please refer to the
publisher's site for terms of use.
Development/Plasticity/Repair
Centrosome Motility Is Essential for Initial Axon Formation
in the Neocortex
Froylan Calderon de Anda,
1,2* Konstantinos Meletis,
1,2,3* Xuecai Ge,
1,2†Damien Rei,
1,2†and Li-Huei Tsai
1,2,3 1Department of Brain and Cognitive Sciences, Picower Institute for Learning and Memory, Massachusetts Institute of Technology, Cambridge,Massachusetts 02139,2Howard Hughes Medical Institute, and3Stanley Center for Psychiatric Research, Broad Institute, Cambridge, Massachusetts 02139
The mechanisms underlying the normal development of neuronal morphology remain a fundamental question in neurobiology. Studies in cultured neurons have suggested that the position of the centrosome and the Golgi may predict the site of axon outgrowth. During neuronal migration in the developing cortex, however, the centrosome and Golgi are oriented toward the cortical plate at a time when axons grow toward the ventricular zone. In the current work, we usein situ live imaging to demonstrate
that the centrosome and the accompanying polarized cytoplasm exhibit apical translocation in newborn cortical neurons preced-ing initial axon outgrowth. Disruption of centrosomal activity or downregulation of the centriolar satellite protein PCM-1 affects axon formation. We further show that downregulation of the centrosomal protein Cep120 impairs microtubule organization, resulting in increased centrosome motility. Decreased centrosome motility resulting from microtubule stabilization causes an aberrant centrosomal localization, leading to misplaced axonal outgrowth. Our results reveal the dynamic nature of the centro-some in developing cortical neurons, and implicate centrocentro-some translocation and microtubule organization during the multipolar stage as important determinants of axon formation.
Introduction
Axon specification during brain development is a fundamental process important for the correct formation of neuronal circuits. The development of axons and dendrites in vitro appears to de-pend on an intrinsic polarity regulated by the cytoskeleton as well as the segregation of proteins, lipids, and polarity proteins (Wiggin et al., 2005; Arimura and Kaibuchi, 2007; Witte and Bradke, 2008; Conde and Ca´ceres, 2009). Accordingly, it has been shown that the polarized centrosome and Golgi apparatus predict the site of axon formation in cultured hippocampal and cerebellar neurons (Zmuda and Rivas, 1998; de Anda et al., 2005). Little is known, however, about the mechanisms of axon specification in vivo and how intracellular and extracellular processes cooperate to define the site of axon elongation (Asada et al., 2007; Barnes et al., 2008).
In situ observations in the embryonic grasshopper limb show that
the Ti1 pioneer neurons extend axons perpendicular to the mi-totic cleavage plane (Lefcort and Bentley, 1989). Upon the onset of mitosis in the pioneer mother cell, the microtubule organizing center (MTOC) and Golgi tubules are found in proximity to the
site of initial axon outgrowth. In contrast, in retinal ganglion cells of the developing zebrafish embryo, the centrosome position is reported to be opposite to the site of axon formation (Zolessi et al., 2006). Moreover, flies without centrioles develop normal neurons (Basto et al., 2006). It was demonstrated, however, that the Golgi apparatus is a source of a large number of non-centrosomal microtubules (Efimov et al., 2007) that might compensate for the lack of centrioles. Importantly, the func-tion of the centrosome as a MTOC was shown to be dispens-able for axonal extension in cultured hippocampal neurons (Stiess et al., 2010), yet it is unclear whether the position of axon formation in neurons of the developing cortex depends on the centrosome position.
Recent studies suggest that extracellular cues may help define the site of axon formation. For example, the secreted UNC-6/ netrin protein and its receptor, UNC-40/DCC, together orient and maintain asymmetric growth preceding axon elongation in the HSN motor neurons of Caenorhabditis elegans (Adler et al., 2006). Several studies have also demonstrated that efficient ax-onal growth is dependent on extracellular contact (Polleux et al., 1998; Esch et al., 1999; Hilliard and Bargmann, 2006; Prasad and Clark, 2006; Shelly et al., 2007; Zhang et al., 2007). Given these data, it is conceivable that axon formation has similarities, both conceptual and mechanistic, to the cell polarization observed during cell migration (Li and Gundersen, 2008). Importantly, changes in migration direction following exposure to external stimuli are associated with centrosome and Golgi apparatus re-orientation toward the leading edge. It is therefore of interest to understand whether axon formation follows this principle of po-larity, and whether the centrosome relocates toward the site of axon formation in the developing cortex.
Received Jan. 20, 2010; revised April 28, 2010; accepted May 26, 2010.
F.C.d.A. is supported by a postdoctoral fellowship from the Simons Initiative on Autism and the Brain Infrastruc-ture Grant Program. K.M. is supported by a postdoctoral fellowship from the Knut och Alice Wallenberg Foundation. L.-H.T. is an investigator of the Howard Hughes Medical Institute. We thank C. G. Dotti, A. Mungenast, M. Carlen, K. Singh, J. J. Buchman, A. Gartner, D. Kim, H. Penagos, Z. Xie, P. Malatesta, J. S. Guan, G. Pollarolo, and Y. Z. Eksioglu for critical reading of the manuscript, providing vectors, antibodies, and suggestions.
*F.C.d.A. and K.M. contributed equally as first authors.
†X.G. and D.R. contributed equally as second authors.
Correspondence should be addressed to either of the following: Froylan Calderon de Anda or Li-Huel Tsai, Mas-sachusetts Institute of Technology, 77 MasMas-sachusetts Avenue, Building 46, Room 4235A, Cambridge, MA 02139, E-mail: [email protected] or [email protected].
DOI:10.1523/JNEUROSCI.0381-10.2010
Copyright © 2010 the authors 0270-6474/10/3010391-16$15.00/0
Materials and Methods
RNA interference and fluorescent protein constructs
The PCM-1 constructs were purchased from the Sigma MISSION short hairpin RNA (shRNA) library. The shRNA sequences used in this study are as follows: PCM-1 shRNA 1 ⫽ TCTCTTACATAGAAGAGAA; PCM-1 shRNA 2⫽ CTCAAACTGACAGTCTATT. The small interfer-ing RNA (siRNA)-resistant PCM-1 construct [pCMV chicken PCM-1-green fluorescent protein (GFP)] (Dammermann and Merdes, 2002) was kindly provided by Andreas Merdes (University of Edinburgh, Edinburgh, UK). The constructs for Cep120 RNA interference (Xie et al., 2007), (Cep120 shRNA 1⫽ Cep120 i2968; Cep120 shRNA 2 ⫽ Cep120i1265), the siRNA-resistant mutant of Cep120 (Xie et al., 2007) (the Cep120 i2968 targeting sequence “ataaccatgaggaccgcataa” in pCep120 was mutated to “ataatcacgaa-gatcgtatca” by site-directed mutagenesis), Venus (pCAGIG), Venus-tubulin (pCMV), pNeuroD-GFP, Centrin2-red fluorescent protein (RFP) (pCMV), and mCherry (pCAGIG) were kindly provided by Z. Xie (Boston University, Boston, MA). The farnesylated-GFP construct was a gift from A. Gartner (University of Leuven, Leuven, Belgium). A pSilencer vector containing a random sequence hairpin insert was used as a control for the shRNAs. The Centrin2-KillerRed (KR) fusion protein was generated by cloning the Cen-trin2 cDNA in-frame with KillerRed using the BamHI and XhoI cloning sites of the pKillerRed-N vector (Evrogen). Plasmids coding for neuronal-specific shRNA expression were based on the pPRIME-CMV-GFP vector, which was cut with EcoRI and XhoI to insert the Cep120 shRNA 1 or PCM1 shRNA 1 sequences. The DNA fragment containing GFP-miR30-shRNA and a wood-chuck hepatitis B virus RNA regulatory element were subcloned into an expression vector carrying the NeuroD promoter.
Cell transfection and Western blot analysis
HEK293, neuroblastoma N2A, and hippocampal Ht22 cells (ATCC) were grown under standard cell culture conditions and transfected with plasmids using Lipofectamine 2000 according to the manufacturer’s pro-tocol (Invitrogen). Proteins from cell lysates were separated on 8 or 10% SDS-polyacrylamide gels at 30 V and transferred onto Immobilon-P polyvinylidene difluoride membranes (Millipore). Membranes were blocked in 50 mMTris-HCl, pH 7.4, 150 mMNaCl, and 0.1% Tween-20
(TBS-T) with 10% nonfat powdered milk for 1 h at 20°C and then incu-bated with primary antibody for 2 h to overnight. Membranes were then washed for 30 min in TBS-T and incubated for 1 h at 20°C with horse-radish peroxidase-conjugated secondary antibodies (GE) and then washed for 30 min in TBS-T. Signal was detected using enhanced chemi-luminescence (PerkinElmer).
In utero electroporation
The Institutional Animal Care and Use Committee of the Massachusetts Institute of Technology approved all experiments. Pregnant Swiss Web-ster mice were anesthetized by intraperitoneal injections of ketamine 1%/xylazine 2 mg/ml (0.01l/g body weight), uterine horns were ex-posed, and plasmids mixed with Fast Green (Sigma) and microinjected into the lateral ventricles of embryos. The shRNA plasmid concentration was twofold higher than that of Centrin2-RFP and pNeuroD-GFP or Venus. Five current pulses (50 ms pulse/950 ms interval; 35–36 V) were delivered across the heads of the embryos.
Organotypic slice cultures
Mouse embryos were electroporated at embryonic day 15 (E15), and acute coronal brain slices (240m) were prepared at E17 and E18 (at which time Cep120 was downregulated via siRNA). Slices were trans-ferred onto slice culture inserts (Millicell) in cell culture dishes (35⫻ 10 mm; Corning) with Neurobasal medium (Invitrogen) containing the following: B27 (1%), glutamine (1%), penicillin/streptomycin (1%), horse serum (5%), and N2 (1%). Slices were used for imaging (1–2 h after slicing) or for pharmacological treatments (incubated at 37°C in 5% CO2, for 1–2 d).
Time-lapse imaging
GFP- and RFP-positive cells were imaged on an inverted Nikon micro-scope (TE 2000-S) with a 20⫻ objective lens [numerical aperture (NA)
0.45]. During the time-lapse imaging, slices were kept in an acrylic cham-ber at 37°C in 5% CO2. We captured time-lapse images with a CoolSNAP
EZ camera (Roper Scientific) using NIS-Elements software (Nikon).
Chromophore-assisted light inactivation of Centrin2
Mouse embryos were electroporated with Centrin2-KR/F-GFP at E15 and acute coronal brain slices (240m) were prepared at E17. Slices were transferred onto slice culture inserts (Millicell) in cell culture dishes with glass bottoms (0.17⫻ 40 mm diameter, WillCo-Dish GWST 5040) with Neurobasal medium (Invitrogen) containing the following: B27 (1%), glutamine (1%), penicillin/streptomycin (1%), horse serum (5%), and N2 (1%). Slices were used for imaging 1–2 h later or were kept at 37°C in 5% CO2for 1–2 d after green light irradiation. Chromophore-assisted laser inactivation (CALI) was induced by applying green light to cells in the intermediate zone (IZ). Cells were irradiated for 10 min (20⫻ objec-tive lens, NA 0.45, mercury lamp, 520 –553 nm excitation filter, 7 W/cm2), at which time the irradiation caused profound photobleaching
of the KillerRed fluorescence. The same treatment did not significantly affect the Centrin2-RFP signal.
Cortical cultures
Neurons were transfected by in utero electroporation at E15, and the transfected cortices were dissected out 2 d later. Cortical neurons were isolated in 1⫻ HBSS (Invitrogen) containing papain and DNase at 37°C (Worthington). Neurons were plated on precoated poly-D-lysine and
laminin glass coverslips in Neurobasal/B27 medium (Invitrogen), main-tained in culture for 48 h, and then fixed for immunofluorescent analysis.
Imaging of late endosomes
To label late endosomes, freshly plated neurons were incubated with 10 mg/ml Lucifer yellow for 10 min at 37°C, rinsed, and then allowed to inter-nalize the dye for 2 h. Cells were treated with nocodazole (6m) or cytocha-lasin D (2m) for a period of 2 h and then fixed for immunofluorescence.
Immunofluorescence
Dissociated neurons. Neurons were fixed with 4% formaldehyde (FA) at 37°C for 2 min followed by fixation for 3 min in MeOH at⫺20°C. After blocking in goat serum (Zymed), neurons were incubated with the 1° antibodies.
Cortical sections. Brains were removed and kept overnight in 4% FA, and thereafter transferred to 30% sucrose/PBS (4°C, overnight). Brains were embedded in OCT compound and sectioned in a cryostat. The 20 to 30 m cryosections were incubated overnight at 4°C with primary antibodies.
Organotypical slice sections. Slices were fixed by immersion in 4% FA (30 min). Slices were removed from the slice culture inserts, and floating sections were blocked at room temperature for 1 h with 2% goat serum and 0.2% Triton X-100 in PBS. Primary antibodies were applied for 24 – 48 h at 4°C, followed by thorough washing in 1⫻ PBS.
Antibodies
The following antibodies were used: mouse anti-acetylated tubulin antibody (Sigma, 1:1000), mouse anti-Tau-1 (MAB3420, Millipore Biosciences Re-search Reagents, 1:200), rabbit anti-Cdk5rap2 (kindly provided by Joshua J. Buchman, Massachusetts Institute of Technology, Cambridge, MA, 1:1000), rat anti-L1 (MAB5272, Millipore Biosciences Research Reagents, 1:500), rabbit anti-PCM-1 (kindly provided by Andreas Merdes, University of Edinburgh, Edinburgh, UK, 1:10,000), rabbit anti-Ki67 (SP6, Neo-Markers, Thermo Scientific, 1:3000), mouse anti-GM130 (1:100), chicken anti-GFP (Aves Labs, 1:500), rabbit anti-cleaved caspase-3 (9661, Cell Signaling Technology, 1:500), and rabbit anti-FAK (clone C-20, Santa Cruz Biotechnology, 1:5000). Nuclei were visualized with Hoechst (Invitrogen), and F-actin with phalloidin (Invitrogen). Alexa-conjugated secondary antibodies (Jackson ImmunoResearch, 1:1000) were applied for 1–2 h at 20°C.
Confocal imaging
Images were taken with a Zeiss LSM 510 confocal microscope. Z-series images were collected with 1m steps. To perform three-dimensional
(3D) reconstructions on stacks of images of transfected cells, only z-sections in the same focal plane as GFP were used for analysis and for producing figures. The 3D reconstructions and z-stack analyses were created and performed with ImageJ software.
Image processing
Adjustments of brightness and contrast were performed on images. Epi-fluorescent images of several focal planes from the time-lapse analysis were assembled using AxioVision software (Zeiss). Some time-lapse se-quences were processed using the Gauss filter to reduce noise. The GFP signal from the time-lapse sequences from Figure 1, C and D, and plemental Figure 2, B, F, and G (available at www.jneurosci.org as sup-plemental material) was adjusted to black and white to better appreciate
the cell morphology. The Centrin2-RFP signal is presented as red, but the brightness and contrast were adjusted to identify the Centrin2 signal in the black and white background.
Quantification of the centrosome position in brain slices and organotypic slice cultures
The centrosome position was determined by cell body centroid analysis, which divided the cell body into quadrants (perpendicular lines crossing the center of the nucleus divided the cell into four 90° quadrants) ori-ented toward the cortical plate (CP), ventricular zone (VZ), laterally and medially. Grids were aligned manually to the pial–ventricular axis, and quantification was obtained in a blinded fashion.
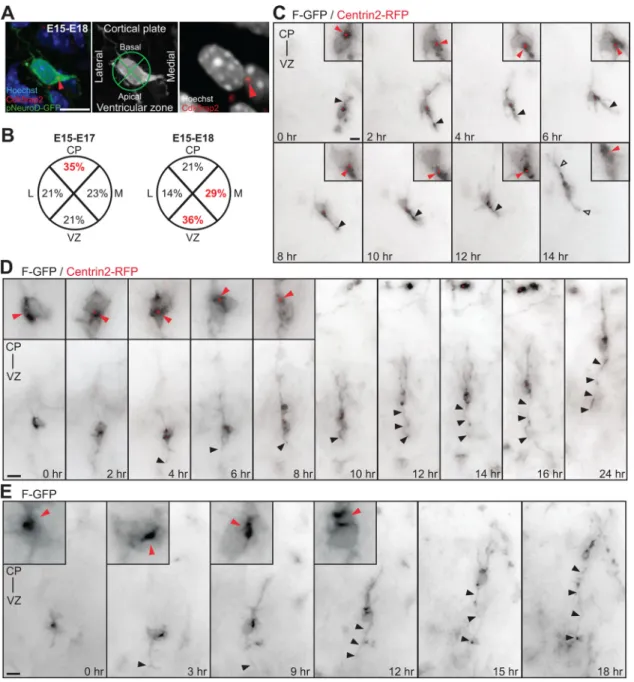
Figure 1. The centrosomes of multipolar neurons translocate toward the VZ in advance of axon formation. A, Multipolar neurons in the lower IZ, identified by pNeuroD-GFP expression, are labeled with Cdk5rap2 (red arrowhead) and Hoechst. Cell body centroid analysis is used to determine centrosome position (middle panel). B, Quantification of centrosome position at E17 and E18 in pNeuroD-GFP-positive multipolar neurons from E15 in utero electroporation. C, Time-lapse imaging of a multipolar cell expressing F-GFP and Centrin2-RFP (insets, red arrowhead). At 0 h, centrosome is oriented toward the CP. From 2 to 12 h, the centrosome orients toward the VZ and midline (6 h). The cell assumes a bipolar morphology (open arrowheads) with the centrosome toward the leading edge and the CP at 14 h. The apical neurite accumulates more membrane components when the centrosome is located at its base (black arrowhead). D, E, Multipolar cells form an axon before migration into the CP. D, Time-lapse imaging of a cell expressing F-GFP and Centrin2-RFP, with the centrosome toward the VZ before elongation of the axon (insets in 0 h-4 h, red arrowheads). The centrosome translocates toward the CP (red arrowheads, inset in 6 h-8 h) and the cell reassumes a bipolar morphology, leaving the growing axon behind (black arrowheads, 6 h-24 h). E, Inversion of the polarized cytoplasm (red arrowheads, inset in 0 –12 h) in a cell expressing F-GFP toward the VZ before elongation of the axon (black arrowhead). Scale bars: A, C–E, 10m. Calderon de Anda et al.• The Role of Centrosome in Axon Formation J. Neurosci., August 4, 2010•30(31):10391–10406 • 10393
Quantification of the centrosome speed and trajectory
The centrosome velocity was measured using a plugin for ImageJ (Mouse Tracker, programmed by P. Malatesta, Istituto Nazionale per la Ricerca sul Cancro, IST, Genoa, Italy) that allows tracking of the centrosome position over time. The centrosome velocity was calculated with Excel (Microsoft). The centrosome trajectory was tracked using a plugin for ImageJ (Manual Tracking).
Quantification of cell distribution and callosal axon formation in brain slices and organotypic slice cultures
The cell distribution and callosal axon formation phenotype from brain slices was quantified by taking a total of 10 –15 evenly spaced coronal rostral-to-caudal sections (40m) per brain, from three brains per con-dition. The brain slices and organotypic slice cultures were divided into three regions: VZ/subventricular zone (SVZ), IZ, and CP, using Hoechst staining to delineate each region. The fraction of fluorescently labeled cells in each region was counted. To assess the axon formation, the for-mation of callosal axons was used as a readout system. A detailed analysis of the initiation of callosal axons of cells transfected at E15 was per-formed. Two days after in utero electroporation, transfected cells initiate axon projection toward the midline (supplemental Fig. 1C, available at www.jneurosci.org as supplemental material). At E18, the callosal axons from transfected cells are clearly identifiable (supplemental Fig. 1 D, available at www.jneurosci.org as supplemental material). At E19, these axons are well established (forming an axonal tract), and we used this characteristic as the standard for our assay (supplemental Fig. 1 E, avail-able at www.jneurosci.org as supplemental material). We found in the analyzed slices that Cep120 downregulation or PCM-1 downregulation produced scattered axons projecting toward the midline rather than the well formed callosal axonal tracts found in control conditions. Our elec-troporations are comparable, and the number of electroporated cells is similar across samples, thus eliminating the possibility of differences due to number of transfected cells in control versus shRNA-transfected cor-tices. Quantifications were performed blindly.
Analysis of cell death in organotypic slice cultures
Cell death in situ was assessed using propidium iodide (Sigma) or by immunostaining with an anti-cleaved caspase-3 antibody. To examine cell death using propidium iodide, slices were incubated with propidium iodide (7g/ml) for 40–60 min and washed with fresh medium before fixation. Fixed slices were analyzed on the same day as fixation.
Measurement of acetylated microtubules
Neurons were cultured for 48 h after plating and then were treated for 30 min with 6m nocodazole and fixed as explained above (see Immuno-fluorescence). Microtubules were visualized by indirect immunofluores-cence. The mean intensity value of acetylated tubulin in the soma was measured using ImageJ software.
Statistical analysis
Compiled data are expressed as mean⫾ SEM. We used the two-tailed Student’s t test and one-way ANOVA for statistical analysis.
Results
Apical translocation of the centrosome and polarized cytoplasm precedes axon formation in multipolar neurons
In the developing mammalian cortex, the first sign of axon out-growth is evident in neuronal cells in the lower IZ that exhibit multipolar morphology (Shoukimas and Hinds, 1978; Hatanaka and Murakami, 2002; Noctor et al., 2004). The multipolar neu-ron stage is a transitional one, occurring after newborn bipolar neurons ascend from the VZ to the IZ, and before the more mature bipolar neurons migrate from the IZ and into the CP (Shoukimas and Hinds, 1978; Noctor et al., 2004). We first inves-tigated centrosome localization in multipolar neurons located in the IZ during axon specification in the mouse neocortex. Radial glia cells and intermediate progenitors (IPs) generate the major-ity of neocortical pyramidal neurons (Noctor et al., 2004) during
a neurogenic phase that, in mice, occurs from E11 to E17. For the specific examination of neurons undergoing the multipolar stage, we expressed GFP under the control of a postmitotic neuronal promoter (NeuroD-GFP) (Yokota et al., 2007) (supplemental Fig. 1 A, B, available at www.jneurosci.org as supplemental mate-rial) using in utero electroporation at E15. Centrosomes were identified using a Cdk5rap2 antibody (Fig. 1 A). We analyzed neurons with multipolar morphology in coronal brain slices at E17 and E18, the time point at which GFP-positive (GFP⫹) neu-rons began to project callosal axons (supplemental Fig. 1C,D, available at www.jneurosci.org as supplemental material). In each GFP⫹ cell, the labeled centrosome position was determined using a cell body centroid analysis, which divides the cell body into quadrants oriented toward the CP, VZ, laterally and medially (Fig. 1 A, middle panel). At E17, we found the centrosome to be oriented toward the CP in 35% of the multipolar cells (Fig. 1 B, left panel) (n⫽ 100 cells from 3 brains). Conversely, at E18, the majority of the multipolar cells had a centrosome, which was oriented toward either the VZ or the medial portion of the cortex, to which callosal axons project (36% and 29%, respectively) (Fig. 1 B, right panel) (n⫽ 100 cells from 3 brains). This transition in centrosome position between 48 and 72 h after in utero electro-poration suggests a movement of the centrosome in multipolar neurons that correlates with both the time and direction of axon formation (supplemental Fig. 1C,D, available at www.jneurosci. org as supplemental material).
We performed long-term live imaging of GFP-labeled single multipolar neurons in the IZ using in utero electroporation of plasmids into the neocortex of E15 mouse embryos followed by the imaging of acute brain slices at E17. We investigated the dy-namic behavior of the centrosome and the associated polarized cytoplasm by tracking the centrosomal marker Centrin2 fused to RFP (Centrin2-RFP) as well as the movement of organelles and membrane materials using a membrane-targeted farnesylated-GFP construct (F-farnesylated-GFP). The F-farnesylated-GFP signal localizes preferentially to the Golgi apparatus in dissociated cortical neurons (supple-mental Fig. 2 A, available at www.jneurosci.org as supple(supple-mental material). Imaging at E17 did not reveal dividing GFP⫹ cells, in accordance with the marked reduction in the IP population ob-served by this time point (Englund et al., 2005). We focused our analysis on multipolar cells with several small neurites before evident axon formation (Fig. 1C). Importantly, we found that Centrin2-RFP-labeled centrosomes and the polarized F-GFP sig-nal displayed marked motility during the observation period (10 – 42 h). We also observed that, regardless of the initial posi-tion of the centrosome and the polarized cytoplasm, the centro-some reliably oriented toward the apical/medial side of the cell body preceding initial axon formation and before the cells as-sumed a bipolar morphology and initiated migration (Fig. 1C–E; supplemental Fig. 2 B–E, available at www.jneurosci.org as sup-plemental material). Some multipolar cells underwent retrograde movement (Noctor et al., 2004), with the centrosome and the polarized F-GFP signal oriented toward the VZ, before migration toward the CP (supplemental Fig. 2 F, available at www.jneurosci. org as supplemental material). We observed that the apical/me-dial neurite proximal to the centrosome was consistently found to be thicker and to contain more membrane components, as suggested by the distribution of the F-GFP signal, compared with the other neurites, but only when the polarized F-GFP signal and centrosome were proximal to the emerging neurite (Fig. 1C, black arrowheads). Eventually, GFP⫹ cells resumed their migra-tion and the apical/medial neurite acquired sufficient length to be
considered an axon (Fig. 1 D, E; supplemental Fig. 2 F, G, available at www.jneurosci.org as supplemental material) (n⫽ 26 of 40 cells; 14 cells remained multipolar throughout the imaging pe-riod). To confirm that the long trailing neurite had assumed an axonal fate, we fixed and immunostained the tissue with an ax-onal marker (L1) after the completion of time-lapse imaging. The trailing neurite was consistently immunoreactive for L1 (supple-mental Fig. 2G–I, available at www.jneurosci.org as supple(supple-mental material) (n⫽ 5 cells). Our imaging data suggest that the apical translocation of the centrosome serves as a polarity signal that mediates delivery of the cellular material necessary for initial ax-onal growth (Wiggin et al., 2005; Arimura and Kaibuchi, 2007). The subsequent axonal elongation is independent of centrosomal microtubule nucleation (Stiess et al., 2010) and could be sus-tained by processes inherent to neuronal migration.
To explore the temporal and spatial relationship between cen-trosome position and axonal specification, we prepared coronal brain sections for immunohistochemistry 48 –72 h after in utero electroporation at E15. This allowed analysis of the longest apical/ medial neurites (⬎40m) at a time when neurons have initi-ated callosal axon growth (supplemental Fig. 1C,D, available
at www.jneurosci.org as supplemental material). We found that the longest neurite projecting toward the midline, which was associated with the centrosome position, was negative for the axonal marker L1 (Fig. 2A,B) (n⫽ 10 cells). However, the trailing pro-cesses of migrating bipolar neurons were consistently positive for L1 (Fig. 2C,D) (n⫽ 10 cells), as confirmed in our ex vivo exper-iments (supplemental Fig. 2G–I, available at www.jneurosci.org as supplemental material). These findings suggest that centro-some position and enrichment of membrane material confer the capacity of neurite growth, whereas the mature axonal fate as characterized by L1 expression is established during subsequent neuronal migration.
The centrosome is necessary to initiate axon formation in situ
We next investigated whether or not the centrosome is necessary for axon formation both ex vivo and in vivo. We took advantage of CALI technology to acutely inactivate the centrosome using the genetically encoded photosensitizer KillerRed. KillerRed can be fused to proteins of interest and, upon illumination, will specifi-cally inactivate the target protein via the generation of light-activated reactive oxygen species (Bulina et al., 2006). We fused
Figure 2. Temporal and spatial relationship between centrosome relocation and axonal specification in multipolar cells. A, The centrosome (red arrowhead) is oriented toward the neurite that will form the axon (black arrowheads), and the neurite is L1 negative. C, Migrating neuron with the centrosome oriented toward the leading edge (red arrowhead) and the trailing process positive for L1 (black and red arrowheads, inset 1 from left panel). B, GFP and L1 intensity profiles from the selected place for y–z scan in A. D, GFP and L1 intensity profiles from the selected place for x–z scan in C. The profile in B and D was obtained by drawing a line that crossed the middle of the GFP signal. Scale bars: A, C, 10m.
Centrin2, a protein confined to the distal lumen of centrioles and present in the pericentriolar material, to KillerRed (Centrin2-KR) to specifically inactivate Centrin2 fused to KR with green light irradiation (520 –553 nm). Plasmids with Centrin2-KR and F-GFP were coelectroporated into the E15 mouse cortex, and acute brain slices were prepared at E17 for CALI experiments. We directed irradiation to cells located in the IZ and used time-lapse imaging to analyze both cell movement and the localization of membrane material as identified by the F-GFP signal. Disruption of the cytoplasmic polarity occurred within 10 min of Centrin2 inactivation, as evidenced by changes in the F-GFP signal distri-bution (Fig. 3 A, B) (10 min, red arrows in inset). This result supports the contribution of centrosome position in polarization of the Golgi apparatus and endocytic-recycling compartment (Li and Gundersen, 2008; Schmoranzer et al., 2009). In addition, neurites began to retract after Centrin2 inactivation (Fig. 3B) (10 min and 4 h, open arrowheads). Eventually, the F-GFP signal in the cell body repolarized and neurites regrew (Fig. 3B, 24 h, black arrowheads) (for the whole time-lapse sequence, see supplemen-tal Fig. 3 A, B, available at www.jneurosci.org as supplemensupplemen-tal material). The regrowth of the initial neurite occurred proximal to the repolarized F-GFP signal, suggesting that the position of the polarized cytoplasm directed preferential neurite outgrowth (for the whole time-lapse sequence, see supplemental Fig. 3B, available at www.jneurosci.org as supplemental material) (6 h), as has been suggested for cultured neurons (de Anda et al., 2005). We hypothesized that the effects of Centrin2 inactivation could be associated with transient microtubule disruption. In support of this idea, we found that the treatment of freshly iso-lated E16 mouse neurons with the microtubule-destabilizing agent nocodazole (6M, 2 h) lead to disruption of the cytoplas-mic polarity, as evidenced by the dispersion of the Golgi appara-tus and late endosomes (see supplemental Fig. 3C,D, available at www.jneurosci.org as supplemental material) (n⫽ 90 cells from 3 brains) as well as neurite retraction (data not shown) (de Anda et al., 2005). To confirm the specificity of the Centrin2 inactiva-tion using CALI, we imaged neurons in irradiated slices that did not express the Centrin2-KR and found normal neuronal differ-entiation with the polarized cytoplasm oriented toward the me-dial/apical neurite (Fig. 3C,D) (8 h) that would become the axon (Fig. 3D, 42 h, black arrowheads and Inset 1) (for the whole time-lapse sequence and detailed z-stack analysis of the L1 stain-ing, see supplemental Fig. 3E–H, available at www.jneurosci.org as supplemental material). In an additional control experiment, we exposed neurons expressing Centrin2-RFP in situ to green light irradiation every 10 min for⬃10 h and observed normal development (supplemental Video 1, available at www.jneurosci. org as supplemental material), further supporting the specific-ity of the CALI-mediated Centrin2 inactivation.
We then analyzed cortical cell distribution and axon forma-tion after CALI. Under control condiforma-tions in either nonirradiated slices (with cells expressing Centrin2-KR and F-GFP), or irradi-ated slices (with cells expressing Centrin2-RFP and F-GFP), ⬃40% of F-GFP⫹ cells migrated normally and reached the CP (nonirradiated: 40.69⫾ 5.10%, n ⫽ 6 slices, 1634 cells quantified; irradiated: 42.42⫾ 2.75%, n ⫽ 7 slices, 1868 cells quantified; mean⫾ SEM) (Fig. 3E,F,H). In contrast, 24 h after CALI in slices containing neurons expressing Centrin2-KR and F-GFP, only 14.66⫾ 2.90% (mean ⫾ SEM; n ⫽ 6 slices, 2008 cells quantified) (Fig. 3G,H ) of the GFP-labeled cells reached the CP and a large proportion of the transfected cells remained in the IZ (49.59⫾ 2.31%; mean⫾ SEM) (Fig. 3G,H) but did not undergo cell death
(6 and 24 h after CALI) (supplemental Fig. 3I–L, available at www.jneurosci.org as supplemental material). Importantly, F-GFP⫹ neurons in control slices developed long callosal axons while F-GFP⫹ and Centrin2-KR⫹ neurons still did not form callosal axon tracts during a 48 h period (Fig. 3 I, J ) (number of apparent callosal axons per slice: control⫽ 32.80 ⫾ 4.03, n ⫽ 5 slices; CALI⫽ 14.00 ⫾ 2.60, n ⫽ 5 slices; mean ⫾ SEM; **p ⫽ 0.0013 by t test) but, consistent with a transient Centrin2 inacti-vation, initiated migration toward the CP (data not shown).
To further investigate the role of the centrosome in in vivo axon formation, we decided to downregulate the expression of the protein PCM-1. PCM-1-containing pericentriolar satellites are important for the recruitment of proteins that regulate cen-trosome function (Dammermann and Merdes, 2002), and the inhibition or depletion of PCM-1 disrupts the radial organiza-tion of microtubules without affecting microtubule nucle-ation (Dammermann and Merdes, 2002). PCM-1 is, therefore, a suitable candidate molecule to evaluate whether the centrosomal-dependent organization of microtubules supports axon forma-tion in vivo, as has been found in vitro (Calderon de Anda et al., 2008). PCM-1 shRNA constructs that effectively and specifically silence PCM-1 expression in cortical neurons, in vitro neurons, and in N2A cells (supplemental Fig. 4, available at www. jneurosci.org as supplemental material), or a control shRNA plasmid, were cotransfected with a Venus fluorescent protein expression plasmid into E15 mice using in utero electroporation. Electroporated brains were examined at E19, at which time the cortical neurons transfected with the control shRNA-Venus⫹ extended long callosal axons (supplemental Fig. 1 E, available at www.jneurosci.org as supplemental material). We found that PCM-1 downregulation resulted in severe defects of axon forma-tion in comparison with neurons containing the control shRNA (Fig. 4 A, B) (n⫽ 3 for control shRNA and n ⫽ 6 brains, 3 brains for each PCM-1 shRNA construct). Additionally, PCM-1 silenc-ing arrested neuronal migration and transfected neurons re-mained multipolar in the IZ (Fig. 4 B; supplemental Fig. 4 E, H, available at www.jneurosci.org as supplemental material). Rescue experiments were performed with an shRNA-resistant form of PCM-1 that confirmed the specificity of the PCM-1 downregu-lation (supplemental Fig. 4 D–H, available at www.jneurosci.org as supplemental material).
We performed a sequential transfection experiment to deter-mine whether the PCM-1 downregulation phenotype is cell au-tonomous. In utero electroporation first introduced an mCherry expression plasmid into E15 mouse cortex, followed 20 min later by coelectroporation with a PCM-1 shRNA plasmid and a Venus expression plasmid into the same hemisphere. A cell-autonomous phenotype of PCM-1 downregulation would not affect neurons transfected solely with the mCherry plasmid; these neurons should migrate to the CP and extend callosal axons. In accordance with a cell-autonomous effect, neurons expressing only mCherry migrated to the CP and extended callosal axon projections (Fig. 4C, boxed area and red arrowheads) (n⫽ 3 brains), whereas cells expressing PCM-1 shRNA were arrested in the IZ with limited development of callosal axons (Fig. 4C, boxed area and green arrowheads) (n⫽ 3 brains). To further examine the cell-autonomous effects of PCM-1 downregulation, we cultured cortical neurons dissociated at E17 from brains electroporated in
utero at E15 with F-GFP and either a PCM-1 shRNA or an shRNA
control plasmid. In control cultures, 71.30⫾ 0.60% of the F-GFP⫹ neurons (mean⫾ SEM; n ⫽ 115 neurons from 3 brains) extended a Tau-1 (axonal marker) immunoreactive process 48 h after plating (Fig. 4D). The downregulation of PCM-1 expression impaired axon
formation resulting in only 27.32⫾ 5.24% of the F-GFP⫹ neurons (mean⫾ SEM; n ⫽ 118 neurons from 3 brains; **p ⫽ 0.0011 by t test) extending a Tau-1 immunoreactive axon (Fig. 4D). Interest-ingly, 73.80⫾ 1.99% (mean ⫾ SEM) of the PCM-1 shRNA neurons exhibited several thin and long (⬎40m) neurites that were
nega-tive for Tau-1 (Fig. 4D; supplemental Fig. 4B, available at www. jneurosci.org as supplemental material).
Consistent with these in vitro findings, PCM-1 downregula-tion produced multipolar cells with multiple long and thin neu-rites in vivo (Fig. 4 E). These results suggest that axon formation
Figure 3. Light-induced inactivation of Centrin2 disrupts axon formation and neuronal migration in situ. A, Centrin2-KR fusion protein (left panel, red arrowhead) localized with the polarized F-GFP signal (left panel, green arrow). B, Before CALI, the cell displayed several neurites (black arrowheads), and a polarized cytoplasm (inset, red arrow). CALI of Centrin2-KR induces neurite retraction (10 min, 4 h, open arrowheads) and redistribution of the polarized F-GFP signal (10 min, inset, red arrows). Eventually, neurites regrew (24 h, black arrowheads) and the cytoplasm repolarized (4 h, 24 h, inset, red arrow). C, Control cells (left panel, green arrowhead) did not express Centrin2-KR (left panel, red arrowhead) but were irradiated with green light. D, The same cell as C (green arrowhead) developed an axon (8 h-42 h, black arrowheads) and markedly polarized cytoplasm (8 –18 h, inset, red arrow). The neurite is L1 positive (left bottom, Inset 1 in 42 h, black and red arrowheads). E, F, 24 h after CALI, control slices show labeled cells migrating toward the CP. G, 24 h after CALI, irradiated slices have the majority of the labeled cells in the IZ. H, Quantification of cell distribution in control and irradiated slices 24 h after CALI (mean⫾ SEM; CP: ***p ⬍ 0.0001; IZ: *p ⫽ 0.0109; VZ: **p ⫽ 0.0043 by one-way ANOVA). I, 48 h after CALI, control slices have a robust callosal axonal tract (black arrowheads). J, 48 h after CALI, treated slices have few F-GFP-positive callosal axons (red arrows). Scale bars: A–D, 10m; E–G, I, J, 200 m.
deficits after PCM-1 disruption might be due to a reduced polar-ized radial microtubules network (Dammermann and Merdes, 2002). Previously, it was shown that a polarized radial microtu-bule network anchored to the centrosome determines the posi-tion of initial elongaposi-tion of a single neurite into an axon (de Anda et al., 2005; Calderon de Anda et al., 2008). The disorganized microtubule outgrowth after PCM-1 downregulation possibly induced simultaneous elongation of several neurites. Together, these results implicate the centrosome as an important organelle during initial axon formation and neuronal migration.
The centrosomal protein Cep120 regulates centrosome motility and axon formation
The centrosomal translocation observed in multipolar neurons suggests that both the motility and that apical localization of the centrosome are important for the spatial determination of axon extension. To investigate the regulation of centrosome motility in multipolar cells, we compared microtubule organization in mul-tipolar cells and migrating bipolar cells to identify molecular dif-ferences that could help explain the observed difdif-ferences in centrosome motility and localization. Using mouse in utero
elec-Figure 4. PCM-1 downregulation disrupts axon formation and neuronal migration. A, In utero electroporation of control shRNA at E15 labels transfected cells that form a callosal axonal tract (inset, black arrowheads) at E19. B, PCM-1 shRNA expression resulted in migration defect (middle panel) and failure to form a callosal axonal tract (inset, black arrowheads). C, The cell-autonomous phenotype of PCM-1 shRNA was demonstrated by sequential electroporation of mCherry and PCM-1 shRNA/Venus. Cells with only mCherry expression migrate toward the CP and project callosal axons. PCM-1 shRNA-transfected cells failed to migrate (middle panel) and have limited callosal axonal projections (right inset, green arrowheads). D, PCM-1 downregulation inhibits axon formation in vitro. Polarized control neuron extending a long neurite with typical Tau-1 gradient (black and white arrowheads). PCM-1 downregulation disrupts axon formation but cells have several long (⬎ 40 mm) and thin Tau-1 negative neurites (black and white arrowheads). E, Multipolar cells in the IZ displayed several long and thin neurites after PCM-1 shRNA. Scale bars: A–C, 200m;D,E,10m.
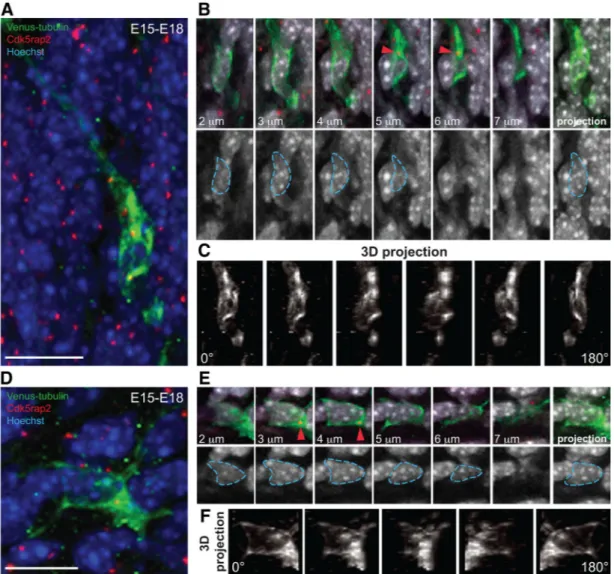
troporation at E15, we introduced a plasmid expressing a Venus-tubulin fusion protein to allow visualization of microtubule structures in single cells and prepared coronal brain sections at E18. The centrosome is coupled to the nucleus via a microtubule cage in migrating bipolar neurons (Rivas and Hatten, 1995). We found that migrating bipolar neurons in vivo had a microtubule network surrounding the nucleus that converged on the centro-some (Fig. 5A–C, 3D projection). In contrast, the microtubule network surrounding the nucleus of multipolar cells in the IZ was less prominent (Fig. 5D–F, 3D projection). This suggests that microtubule bundles undergo restructuring in multipolar neu-rons to allow for increased centrosome motility.
The centrosomal protein Cep120 was previously shown to control the size of the astral microtubule structure, which couples the centrosome and the nucleus (Xie et al., 2007). We hypothe-sized that Cep120 could regulate microtubule dynamics and, in turn, centrosome motility. To investigate the effects of Cep120 downregulation in multipolar neurons, we used in utero
electro-poration to introduce Cep120 shRNA constructs (Xie et al., 2007) that specifically silenced Cep120 expression in cortical cells (Xie et al., 2007), in vitro neurons, N2A cells, and HEK 293 cells (sup-plemental Fig. 5, available at www.jneurosci.org as sup(sup-plemental material). We coelectroporated into E15 mouse cortex the pNeuroD-GFP plasmid and either a Cep120 shRNA or a control shRNA plasmid to specifically visualize postmitotic neurons, and brains were examined 72 h later. The downregulation of Cep120 resulted in a randomization of the centrosome position in mul-tipolar neurons [compare supplemental Fig. 5 H, I (available at www.jneurosci.org as supplemental material), Fig. 1 B]. Time-lapse imaging of E18 multipolar neurons transfected at E15 with Centrin2-RFP/Venus or Centrin2-RFP/pNeuroD-GFP revealed that the Cep120 knock down with two different Cep120 shRNAs significantly increased centrosome motility (Fig. 6 A–C; supple-mental Video 2, available at www.jneurosci.org as supplesupple-mental material) and a mean centrosome velocity increase of approxi-mately twofold compared with control cells (Centrin2-RFP/
Figure 5. Differential microtubule organization in bipolar and multipolar cells. A, A characteristic Venus-tubulin-expressing bipolar neuron in the lower CP labeled with the centrosomal marker Cdk5rap2 and Hoechst. B, Top: inset from cell in A showing different stacks (2–7m) and the maximal intensity projection (right) of the Venus-tubulin, Cdk5rap2 and Hoechst signal. The centrosome from cell in A is shown (red arrowhead). Bottom: different stacks (2–7m)andthemaximalintensityprojectionoftheHoechstsignal.ThenucleusfromcellinAisdelineatedwithblue dashed lines. C, 3D reconstruction and rotation (0 –180°) from the Venus-tubulin signal of the cell in A. Note the complex microtubule network that surrounds the nucleus and converge at the centrosome. D, Multipolar neuron in the IZ with Venus-tubulin expression labeled with Cdk5rap2 and Hoechst. E, Top: inset from the cell in D showing different stacks (2–7m) and the maximal intensity projection (right) of the Venus-tubulin, Cdk5rap2, and Hoechst signals. The centrosome from cell in D is shown (red arrowhead). Bottom: different stacks (2–7m) and the maximal intensity projection of the Hoechst signal. The nucleus from cell in D is delineated with blue dashed lines. F, 3D reconstruction and rotation (0 –180°) of the Venus-tubulin signal in the cell from D. Note the lower abundance of the microtubule network surrounding the nucleus compared with C. Scale bars: A, D, 10m.
Venus: control⫽ 1.15 ⫾ 0.02m/10 min, n ⫽ 25; Cep120 shRNA (1)⫽ 2.27 ⫾ 0.07m/10 min, n ⫽ 25; Cep120 shRNA (2) ⫽ 2.10⫾ 0.06m/10 min, n ⫽ 22; Centrin2-RFP/pNeuroD-GFP: control⫽ 1.29 ⫾ 0.05m/10 min, n ⫽ 22; Cep120 shRNA (1) ⫽ 2.40⫾ 0.06m/10 min, n ⫽ 25; Cep120 shRNA (2) ⫽ 2.08 ⫾ 0.07m/10 min, n ⫽ 15; mean ⫾ SEM; ***p ⬍ 0.0001 by t test). To further confirm the specificity of the two Cep120 shRNA con-structs, we performed a rescue experiment using coexpression of an shRNA-resistant form of Cep120. The shRNA-resistant Cep120 protein reduced the exaggerated centrosomal motility associated with Cep120 downregulation (Centrin2-RFP/Venus: Cep120 shRNA (1)⫽ 2.27 ⫾ 0.07m/10 min, n ⫽ 25; Cep120 shRNA (1)⫹ shRNA-resistant form of Cep120 ⫽ 1.51 ⫾ 0.04 m/10 min, n ⫽ 20, mean ⫾ SEM; ***p ⬍ 0.0001 by t test).
Cep120-disrupted multipolar cells formed mainly unstable neurites that continuously grew and retracted, consistent with the disruption of microtubule stability (Fig. 6 B) (supplemental Video 2, available at www.jneurosci.org as supplemental mate-rial). To verify that the phenotype observed in multipolar neu-rons after Cep120 downregulation is not due to indirect effects in progenitors (Xie et al., 2007), we used the pPRIME system to express microRNA (miR)-30-based shRNA constructs from polymerase II promoters (Stegmeier et al., 2005), which allowed cell-type-specific expression of Cep120 shRNA from the neu-ronal NeuroD promoter (supplemental Fig. 5G, available at www.jneurosci.org as supplemental material). We found that neuronal-specific Cep120 downregulation increased centrosome motility by approximately twofold compared with control cells,
further confirming the critical role of Cep120 for proper cen-trosomal behavior in multipolar neurons (Fig. 6 D) (control⫽ 1.34⫾ 0.04m/10 min, n ⫽ 20; pNeuroD GFP-mir30 Cep120 shRNA ⫽ 2.35 ⫾ 0.06 m/10 min, n ⫽ 20, mean ⫾ SEM; ***p⬍ 0.0001 by t test).
Having developed a hypothesis that there is a connection be-tween centrosome motility and microtubule dynamics, we next investigated whether Cep120 function is associated with the sta-bility of the microtubule network. To analyze microtubule stabil-ity in cortical neurons, we performed in utero electroporation of Cep120 shRNA or control shRNA plasmids together with F-GFP at E15 and isolated cortical neurons at E17. Neurons were cul-tured in vitro for an additional 48 h and acetylated tubulin was analyzed as a marker of microtubule stability. Neurons express-ing Cep120 shRNA had significantly reduced levels of acetylated tubulin in the cell soma compared with cells transfected with a control shRNA (Fig. 7A–C) (control⫽ 34 cells from 2 brains, Cep120 shRNA⫽ 58 cells from 2 brains; ***p ⬍ 0.0001 by t test). Additionally, the Cep120-disrupted neurons had fewer neurites in comparison with control neurons (Fig. 7D) (control⫽ 3.8 ⫾ 0.07 neurites, n⫽ 266 cells from 3 brains; Cep120 shRNA ⫽ 2.8⫾ 0.05 neurites, n ⫽ 331 cells from 3 brains; mean ⫾ SEM; ***p⬍ 0.0001 by t test). To further verify that Cep120 regulates microtubule stability, we treated dissociated cortical neurons with nocodazole (6M) for 30 min. Nocodazole treatment of
control neurons induced microtubule retraction in minor neu-rites, whereas long processes and the cell body (Golgi apparatus and nuclear indentation area) were unaffected (Fig. 7E) (Witte et
Figure 6. Cep120 silencing increases centrosome motility in multipolar cells. A, Time-lapse imaging of a multipolar control cell from the IZ. B, Transfection with Cep120 shRNA increases centrosome motility (red arrowheads), and the frequent extension and retraction of neurites (white arrowheads: neurite extension) (supplemental Video 2, available at www.jneurosci.org as supplemental material). C, Centrosome trajectories in control and Cep120 downregulated cells (4 h time lapse). D, Time-lapse imaging of a multipolar cell from the IZ expressing pNeuroD GFP-mir30 Cep120 shRNA. Neuronal-specific Cep120 silencing increases centrosome motility (red arrowheads). Supplemental Video 2 (available at www.jneurosci.org as supplemental material) corresponds to A, B. Time: minutes. Scale bars, 10m.
al., 2008) (n⫽ 46 neurons from 3 brains). In Cep120 knockdown neurons, however, nocodazole treatment leads to fewer stable microtubules (24.02⫾ 2.29%; mean ⫾ SEM) or the elimination entirely of the acetylated tubulin signal (75.97⫾ 2.29%; mean ⫾ SEM) (Fig. 7F ) (n⫽ 42 neurons from 3 brains). This suggests that neurons lacking Cep120 were more susceptible to microtubule depolymerization and indicates that Cep120 downregulation re-sults in microtubule instability.
Previous observations have revealed that microtubule stabili-zation specifies initial axon formation (Witte et al., 2008). Since Cep120 silencing decreased microtubule stability, we analyzed whether Cep120 downregulation affects axon formation. We found that Cep120 downregulation resulted in axon formation defects. Control cells showed extensive axonal growth (Fig. 8 A, boxed area and arrowheads) (n⫽ 3 brains), whereas cells ex-pressing Cep120 shRNA had limited axonal development (Fig. 8 B, boxed area and arrowheads) (n⫽ 3 brains). Additionally, we found that Cep120 silencing arrested neuronal migration and cells remained at the multipolar stage in the IZ as described pre-viously (Xie et al., 2007) (Fig. 8 B).
To examine whether the axon formation deficiency in Cep120-silenced cells is cell autonomous, we performed a se-quential transfection experiment. In accordance with a cell-autonomous effect, neurons only expressing mCherry migrated to the CP and extended normal callosal projections (Fig. 8C, boxed area and red arrowheads) (n⫽ 3 brains). Cells expressing Cep120 shRNA and identified by Venus expression remained arrested in the IZ with limited callosal axonal development (Fig. 8C, boxed area and green arrowheads) (n⫽ 3 brains). To further examine cell-autonomous effects, we cultured cortical neurons dissociated at E17 from brains that were in utero electroporated at E15 with F-GFP and Cep120 shRNA or shRNA control plasmids. We analyzed axon formation 48 h after plating. In control cul-tures, 61.79⫾ 2.80% of neurons (mean ⫾ SEM; n ⫽ 231 neurons from 3 brains) extended a Tau-1-positive process (Fig. 8 D). However, silencing Cep120 expression affected axon formation
in vitro (Fig. 8 D) and only 12.01⫾ 6.66% of neurons (mean ⫾
SEM; n⫽ 273 neurons from 3 brains; **p ⫽ 0.0023 by t test) extended a Tau-1-positive neurite. Importantly, 12.46⫾ 0.45% (mean⫾ SEM) of the Cep120-silenced neurons lacking a
Tau-1-Figure 7. Cep120 silencing decreases microtubules stability. A–C, The acetylated microtubule content diminishes in the soma of neurons with Cep120 suppression. A, Example of a control neuron (left). Inset of cell body (white box from left panel): the cell body is rich in stable microtubules (white arrowheads). B, Example of a neuron transfected with Cep120 shRNA (left). Inset of cell body (white box from left panel): Cep120 downregulation decreased the stable microtubules in the cell body (white arrows). C, Silencing Cep120 reduced the acetylated microtubule content in the cell body (mean⫾ SEM; ***p ⬍ 0.0001 by t test). D, Frequency distribution of the number of neurites in Cep120-silenced cells and control cells. E, Control neuron transfected with F-GFP and shRNA control plasmid and treated with nocodazole (6M, 30 min). Stable microtubules remain in long processes and in the cell body. F, A neuron transfected with F-GFP and Cep120 shRNA. Nocodazole
treatment depolymerizes microtubules completely (white arrowhead). Scale bars: A, B, E, F, 10m.
positive process (87.99⫾ 6.66%; mean ⫾ SEM) exhibited a neu-rite longer than 40m. This suggests that although some of the Cep120-silenced neurons are able to extend a long process, de-phosphorylated Tau is not present in the distal shaft of the longest neurite, likely due to a deficiency in microtubule stability. Our results indicate that Cep120 stabilizes the centrosome-associated microtubule network. Accordingly, the stability of microtu-bules might modulate the motility of the centrosome as well as promote axonal elongation of the neurite proximal to the centrosome.
Microtubule dynamics regulate centrosome motility
To study the in situ association of microtubule organization with centrosomal motility in multipolar cells, we disrupted microtu-bule polymerization in acute cortical slices with a low concentra-tion of nocodazole (2 M). To image single multipolar cells before and after microtubule disruption, Centrin2-RFP/Venus or Centrin2-RFP/pNeuroD-GFP plasmids were electroporated into E15 mouse brains and acute brain slices were prepared for imaging at E18. Upon microtubule disruption by nocodazole
treatment, multipolar cells within the IZ displayed abrupt changes in morphology and increased cell movement (data not shown). In addition, time-lapse imaging revealed a significant increase in both centrosomal motility and velocity directly fol-lowing nocodazole application; these increases were in the same range as those observed after Cep120 downregulation (Fig. 9 A, B; supplemental Video 3, available at www.jneurosci.org as supple-mental material) (Centrin2-RFP/Venus: before nocodazole⫽ 1.35⫾ 0.06m/10 min, n ⫽ 25; after nocodazole ⫽ 2.06 ⫾ 0.07 m/10 min, n ⫽ 25; Centrin2-RFP/pNeuroD-GFP: before no-codazole⫽ 1.29 ⫾ 0.05m/10 min, n ⫽ 22 after nocodazole ⫽ 2.04⫾ 0.06m/10 min, n ⫽ 30; mean ⫾ SEM; ***p ⬍ 0.0001 by
t test).
The current report provides strong evidence that Cep120 knockdown results in destabilized microtubules, leading to aber-rant centrosomal movement. We next tested whether or not use of the microtubule-stabilizing agent taxol could rescue the cen-trosome motility defects after Cep120 knockdown. Acute cortical slices were prepared from E18 brains that were electroporated at E15 with either Cep120 shRNA/Centrin2-RFP/Venus or
Figure 8. Cep120 silencing affects axon formation. A, In control brains long callosal projections are evident at E19 four days after in utero electroporation. The majority of transfected neurons are located in the CP, extending long axon projections (right inset from white box from middle panel, black arrowheads). B, Silencing of Cep120 resulted in cell mispositioning at deep layers of the neocortex (middle), and transfected neurons failed to form a robust callosal axonal tract (right inset from white box from middle panel, black arrowheads). C, Sequential transfection of mCherry– Cep120 shRNA/Venus confirm that the axon formation and migration defects after Cep120 downregulation is cell autonomous. Cells expressing just mCherry migrate toward the CP (left) and project callosal axons (right inset from white box from middle panel, red arrowheads). Cep120-silenced cells failed to migrate toward the CP (middle), remaining in the IZ, and the callosal axonal tract was not well developed (right inset from white box from middle panel, green arrowheads). D, Cep120 downregulation precludes axon formation in vitro. Left: polarized control neuron extending a long neurite with the typical Tau-1 gradient toward its distal part (white arrowheads). Right: Cep120 downregulation precludes the formation of a single Tau-1-positive neurite. Scale bars: A–C, 200m; D, 10m.
Cep120 shRNA/Centrin2-RFP/pNeuroD-GFP. Time-lapse imaging analysis was performed before and after exposure to 10 and 20 nMtaxol (Fig. 9C; supplemental Video 4, available at
www.jneurosci.org as supplemental material). We observed that exposure to taxol reduced centrosome movement and velocity in both control cells (Centrin2-RFP/Venus: before taxol⫽ 1.43 ⫾ 0.06m/10 min, n ⫽ 22; after taxol ⫽ 0.84 ⫾ 0.04m/10 min, n ⫽ 22; Centrin2-RFP/pNeuroD-GFP: be-fore taxol⫽ 1.67 ⫾ 0.07m/10 min, n ⫽ 15; after taxol ⫽ 1.32⫾ 0.04m/10 min, n ⫽ 31; mean ⫾ SEM; ***p ⬍ 0.0001 by t test) and Cep120 knock-down cells in a dose-dependent manner (Fig. 9D) (Cep120 shRNA/Centrin2-RFP/Venus: be-fore taxol⫽ 2.08 ⫾ 0.09m/10 min, n ⫽ 22; after taxol 10 nM⫽
1.62⫾ 0.05m/10 min, n ⫽ 22; after taxol 20 nM⫽ 1.36 ⫾
0.04, n⫽ 22; mean ⫾ SEM; ***p ⬍ 0.001, before taxol vs taxol 10 nM; ***p⬍ 0.001, before taxol vs taxol 20 nM; **p⬍ 0.01, taxol 10 nM vs taxol 20 nM, by one-way ANOVA; Cep120
shRNA/Centrin2-RFP/pNeuroD-GFP: before taxol⫽ 2.21 ⫾ 0.09m/10 min, n ⫽ 24; after taxol 20 nM ⫽ 1.55 ⫾ 0.05
m/10 min, n ⫽ 26; mean ⫾ SEM; ***p ⬍ 0.0001 by t test). These findings reveal a significant role for microtubule dy-namics in the control of centrosome position.
Centrosome position determines the site of axon formation
in situ
Having established that microtubule dynamics play a critical role in the regulation of centrosome motility, we wanted to directly examine whether the centrosome position determines the site of axon outgrowth in vivo. Cortical brain slices were prepared at E17, 2 d after in utero electroporation with F-GFP, when the majority of multipolar cells have not yet formed axons (supple-mental Fig. 1C, available at www.jneurosci.org as supple(supple-mental material). The slices were cultured for 1 d with vehicle and with a low dose of taxol (10 nM) to prevent the complete loss of
micro-tubule dynamics (Witte et al., 2008). The proximal trajectories of the axon and centrosome position were examined in multipolar cells of the IZ. In control slices, F-GFP⫹ axons grew from the centrosomal pole in the cell body and were consistently oriented toward either the VZ or the midline (Fig. 10 A, C) (n⫽ 25 cells, in 17 slices from 4 brains). After microtubule stabilization,⬃50% of the multipolar cells displayed a misoriented initial axon trajec-tory (Fig. 10 B, D) (n⫽ 14/30 cells, in 18 slices from 4 brains). Importantly, the misoriented axons always originated from the centrosome-associated site in these cells (Fig. 10 B, inset, red ar-rowhead). Regardless of the initial axonal outgrowth site,
how-Figure 9. Microtubule dynamics control centrosome motility in multipolar cells. A, Time-lapse imaging of a multipolar cell in the IZ before and after nocodazole. Nocodazole (2M) increases centrosome motility (red arrowheads, bottom). B, Centrosome velocity changes in cell in A before and after nocodazole (black arrow). C, Time-lapse imaging of a multipolar cell with Cep120 shRNA expression before and after taxol. Taxol (10 nM) decreased centrosome movement (red arrowheads, intermediate panel); 20 nMtaxol further inhibited centrosome motility (red arrowheads, bottom). D, Profile of centrosome velocity in cell in C before and after taxol (black arrows). Supplemental Videos 3 and 4 (available at www.jneurosci.org as supplemental material) correspond to A and C, respectively. Time: minutes. Scale bars: A, C, 10m.
ever, the axons eventually turned to follow the normal pathway of callosal axons (Fig. 10 B, black arrowheads). These observations support a model whereby centrosome position helps to deter-mine the site of axon formation (Fig. 10 E) (Lefcort and Bentley, 1989; Zmuda and Rivas, 1998; de Anda et al., 2005).
Discussion
We have found that the centrosome and polarized cytoplasm (i.e., Golgi apparatus) undergo translocation in multipolar neu-rons of the developing cortex, and that proximity to these or-ganelles determines the preferential growth of one neurite into an axon. We hypothesize that the position of the centrosome and Golgi apparatus affect the fate of the proximal neurite because growing axons require continuous delivery of membrane and microtubules to the axonal growth cone (Yu and Baas, 1994; Bradke and Dotti, 1997; Jareb and Banker, 1997). The centro-some and the Golgi apparatus are the primary microtubule source (Baas and Yu, 1996; Efimov et al., 2007), and their local-ization could be important for the preferential delivery of axonal-fate molecules and guidance cue receptors (Wiggin et al., 2005; Arimura and Kaibuchi, 2007), thereby sustaining the specifica-tion and trajectory of the growing axon. Our time-lapse imaging showed that during this multipolar stage the apical neurite is enriched in membrane components, as suggested by the distribu-tion of the F-GFP signal, together with an apical translocadistribu-tion of the centrosome. These data suggest that translocation of the centrosome and Golgi apparatus can serve as a threshold event underlying the initial step of neuronal polarization. Axon elon-gation and maturation would be independent of centrosome and Golgi apparatus position, and instead depend on other factors associated with neuronal migration, since axon extension occurs independently of centrosomal microtubule nucleation (Stiess et al., 2010). After complete migration, the CP-oriented polarized
cytoplasm and the external cues could regulate formation of the apical dendrite (Polleux et al., 2000; Horton et al., 2005).
Our results suggest mechanistic similarities between the po-larization of cells during chemotaxis, and the target interaction of T-cells (Li and Gundersen, 2008) and polarization during axon formation. In these three cases, the centrosome reorients toward the leading edge, the site of target interaction, and the axon ini-tiation site, respectively. Our present data demonstrate a translo-cation of the centrosome toward the neurite that eventually grows into an axon during the multipolar stage of cortical pyra-midal neurons. The selective formation of stable microtubules in the leading edge of migrating cells occurs after cytoplasmic repo-larization (Li and Gundersen, 2008). Similarly, it was recently shown that the neurite that eventually forms the axon exhibits selective microtubule stabilization (Witte et al., 2008). It re-mained unclear, however, how the presumptive axon becomes enriched with stable microtubules. We found that the downregu-lation of a centrosomal protein (Cep120) that is essential for centrosome-associated microtubule stability also affected cen-trosome motility and disrupted axon formation. In accordance with this finding, we observed that neurons lacking Cep120 showed significantly reduced acetylated tubulin in the soma compared with control shRNA-transfected cells. These results suggest that the centrosome position may generate a radial gra-dient of stable microtubules, thereby promoting the elongation of the neurite proximal to the centrosome.
The polarity protein Par3 and dynein were recently shown to regulate microtubule dynamics and centrosome orientation dur-ing fibroblast migration (Schmoranzer et al., 2009). We find that changes in microtubule dynamics are a prerequisite for centro-some positioning in multipolar cells. Our observations support a functional relationship between microtubule destabilization and
Figure 10. Microtubule stabilization changes the position of axon outgrowth. A, The axon (black arrowheads) grows proximal to the centrosomal pole (inset at right, red arrowhead) in control cells. B, Microtubule stabilization with taxol (10 nM) changes the axon outgrowth position in some multipolar cells. Aberrant initial trajectory of the axon that is proximal to the centrosomal pole (inset at right, red arrowhead). Distal parts of the axon project properly. C, D, Quantification of the centrosome (dots) and axon outgrowth position (lines) in control cells (C) and after taxol treatment (D). In each quadrant, dots and lines with unique colors represent a single cell. E, Model of microtubule dynamics in multipolar and bipolar neurons. Microtubule dynamics regulate the rotation of the centrosome (red dots) toward the VZ in multipolar cells; this centrosomal positioning underlies axon formation. Subsequently, stable microtubules form a microtubule aster in bipolar migrating neurons (red lines), to promote nuclear translocation and axon elongation. Scale bars: A, B, 10m.
centrosome translocation to the axon outgrowth site. We also found that microtubule stabilization rescues the neuronal migra-tion defects of neurons with Cep120 downregulamigra-tion and in-creased centrosome motility (data not shown). Microtubule dynamics may therefore regulate the centrosome rotation in multipolar cells as well as the multipolar– bipolar transition in the IZ. It is conceivable that mechanisms similar to those regulating microtubule stability during neuronal migration may also mod-ulate centrosome rotation at the multipolar stage. Supporting this view is well documented evidence demonstrating that the downregulation of proteins that influence microtubule stability such as LIS1, doublecortin, and Cdk5 (Gupta et al., 2002; Yingling et al., 2008), also affect the multipolar– bipolar transition in the IZ and lead to impaired axon formation (Bai et al., 2003; Tsai et al., 2005; Ohshima et al., 2007).
In summary, our data support a model whereby centrosome and Golgi apparatus rotation and the associated intracellular or-ganization of microtubules function to determine the position of axon formation. The external environment, which regulates the final axon trajectory (Polleux et al., 1998; Adler et al., 2006; Hilliard and Bargmann, 2006; Prasad and Clark, 2006; Shelly et al., 2007), could also act as a regulator of centrosome position before axon extension. We propose that neuronal polarity is reg-ulated by intrinsic mechanisms that are under the influence of extracellular cues (Gupta et al., 2010). Although we do not yet know the molecular pathway that regulates centrosome motility in multipolar cells in vivo, we expect that the perturbation of this system will have pathological consequences associated with cor-tical circuit malformation.
References
Adler CE, Fetter RD, Bargmann CI (2006) UNC-6/Netrin induces neuronal asymmetry and defines the site of axon formation. Nat Neurosci 9:511–518.
Arimura N, Kaibuchi K (2007) Neuronal polarity: from extracellular signals to intracellular mechanisms. Nat Rev Neurosci 8:194 –205.
Asada N, Sanada K, Fukada Y (2007) LKB1 regulates neuronal migration and neuronal differentiation in the developing neocortex through centro-somal positioning. J Neurosci 27:11769 –11775.
Baas PW, Yu W (1996) A composite model for establishing the microtubule arrays of the neuron. Mol Neurobiol 12:145–161.
Bai J, Ramos RL, Ackman JB, Thomas AM, Lee RV, LoTurco JJ (2003) RNAi reveals doublecortin is required for radial migration in rat neocortex. Nat Neurosci 6:1277–1283.
Barnes AP, Solecki D, Polleux F (2008) New insights into the molecular mechanisms specifying neuronal polarity in vivo. Curr Opin Neurobiol 18:44 –52.
Basto R, Lau J, Vinogradova T, Gardiol A, Woods CG, Khodjakov A, Raff JW (2006) Flies without centrioles. Cell 125:1375–1386.
Bradke F, Dotti CG (1997) Neuronal polarity: vectorial cytoplasmic flow precedes axon formation. Neuron 19:1175–1186.
Bulina ME, Chudakov DM, Britanova OV, Yanushevich YG, Staroverov DB, Chepurnykh TV, Merzlyak EM, Shkrob MA, Lukyanov S, Lukyanov KA (2006) A genetically encoded photosensitizer. Nat Biotechnol 24:95–99. Calderon de Anda F, Ga¨rtner A, Tsai LH, Dotti CG (2008) Pyramidal neu-ron polarity axis is defined at the bipolar stage. J Cell Sci 121:178 –185. Conde C, Ca´ceres A (2009) Microtubule assembly, organization and
dy-namics in axons and dendrites. Nat Rev Neurosci 10:319 –332. Dammermann A, Merdes A (2002) Assembly of centrosomal proteins and
microtubule organization depends on PCM-1. J Cell Biol 159:255–266. de Anda FC, Pollarolo G, Da Silva JS, Camoletto PG, Feiguin F, Dotti CG
(2005) Centrosome localization determines neuronal polarity. Nature 436:704 –708.
Efimov A, Kharitonov A, Efimova N, Loncarek J, Miller PM, Andreyeva N, Gleeson P, Galjart N, Maia AR, McLeod IX, Yates JR 3rd, Maiato H, Khodjakov A, Akhmanova A, Kaverina I (2007) Asymmetric CLASP-dependent nucleation of noncentrosomal microtubules at the trans-Golgi network. Dev Cell 12:917–930.
Englund C, Fink A, Lau C, Pham D, Daza RA, Bulfone A, Kowalczyk T, Hevner RF (2005) Pax6, Tbr2, and Tbr1 are expressed sequentially by radial glia, intermediate progenitor cells, and postmitotic neurons in de-veloping neocortex. J Neurosci 25:247–251.
Esch T, Lemmon V, Banker G (1999) Local presentation of substrate mole-cules directs axon specification by cultured hippocampal neurons. J Neu-rosci 19:6417– 6426.
Gupta A, Tsai LH, Wynshaw-Boris A (2002) Life is a journey: a genetic look at neocortical development. Nat Rev Genet 3:342–355.
Gupta SK, Meiri KF, Mahfooz K, Bharti U, Mani S (2010) Coordination between extrinsic extracellular matrix cues and intrinsic responses to ori-ent the cori-entrosome in polarizing cerebellar granule neurons. J Neurosci 30:2755–2766.
Hatanaka Y, Murakami F (2002) In vitro analysis of the origin, migratory behavior, and maturation of cortical pyramidal cells. J Comp Neurol 454:1–14.
Hilliard MA, Bargmann CI (2006) Wnt signals and frizzled activity orient anterior-posterior axon outgrowth in C. elegans. Dev Cell 10:379 –390. Horton AC, Ra´cz B, Monson EE, Lin AL, Weinberg RJ, Ehlers MD (2005)
Polarized secretory trafficking directs cargo for asymmetric dendrite growth and morphogenesis. Neuron 48:757–771.
Jareb M, Banker G (1997) Inhibition of axonal growth by brefeldin A in hippocampal neurons in culture. J Neurosci 17:8955– 8963.
Lefcort F, Bentley D (1989) Organization of cytoskeletal elements and or-ganelles preceding growth cone emergence from an identified neuron in situ. J Cell Biol 108:1737–1749.
Li R, Gundersen GG (2008) Beyond polymer polarity: how the cytoskeleton builds a polarized cell. Nat Rev Mol Cell Biol 9:860 – 873.
Noctor SC, Martínez-Cerden˜o V, Ivic L, Kriegstein AR (2004) Cortical neu-rons arise in symmetric and asymmetric division zones and migrate through specific phases. Nat Neurosci 7:136 –144.
Ohshima T, Hirasawa M, Tabata H, Mutoh T, Adachi T, Suzuki H, Saruta K, Iwasato T, Itohara S, Hashimoto M, Nakajima K, Ogawa M, Kulkarni AB, Mikoshiba K (2007) Cdk5 is required for multipolar-to-bipolar tran-sition during radial neuronal migration and proper dendrite develop-ment of pyramidal neurons in the cerebral cortex. Developdevelop-ment 134:2273–2282
Polleux F, Giger RJ, Ginty DD, Kolodkin AL, Ghosh A (1998) Patterning of cortical efferent projections by semaphorin-neuropilin interactions. Sci-ence 282:1904 –1906.
Polleux F, Morrow T, Ghosh A (2000) Semaphorin 3A is a chemoattractant for cortical apical dendrites. Nature 404:567–573.
Prasad BC, Clark SG (2006) Wnt signaling establishes anteroposterior neu-ronal polarity and requires retromer in C. elegans. Development 133:1757–1766.
Rivas RJ, Hatten ME (1995) Motility and cytoskeletal organization of mi-grating cerebellar granule neurons. J Neurosci 15:981–989.
Schmoranzer J, Fawcett JP, Segura M, Tan S, Vallee RB, Pawson T, Gundersen GG (2009) Par3 and dynein associate to regulate local microtubule dy-namics and centrosome orientation during migration. Curr Biol 19:1065–1074.
Shelly M, Cancedda L, Heilshorn S, Sumbre G, Poo MM (2007) LKB1/ STRAD promotes axon initiation during neuronal polarization. Cell 129:565–577.
Shoukimas GM, Hinds JW (1978) The development of the cerebral cortex in the embryonic mouse: an electron microscopic serial section analysis. J Comp Neurol 179:795– 830.
Stegmeier F, Hu G, Rickles RJ, Hannon GJ, Elledge SJ (2005) A lentiviral microRNA-based system for single-copy polymerase II-regulated RNA interference in mammalian cells. Proc Natl Acad Sci U S A 102:13212–13217.
Stiess M, Maghelli N, Kapitein LC, Gomis-Ru¨th S, Wilsch-Bra¨uninger M, Hoogenraad CC, Tolia˜-Nçrrelykke IM, Bradke F (2010) Axon extension occurs independently of centrosomal microtubule nucleation. Science 327:704 –707.
Tsai JW, Chen Y, Kriegstein AR, Vallee RB (2005) LIS1 RNA interference blocks neural stem cell division, morphogenesis, and motility at multiple stages. J Cell Biol 170:935–945.
Wiggin GR, Fawcett JP, Pawson T (2005) Polarity proteins in axon specifi-cation and synaptogenesis. Dev Cell 8:803– 816.