HAL Id: hal-01713186
https://hal.archives-ouvertes.fr/hal-01713186
Submitted on 20 Feb 2018
HAL is a multi-disciplinary open access
archive for the deposit and dissemination of
sci-entific research documents, whether they are
pub-lished or not. The documents may come from
teaching and research institutions in France or
abroad, or from public or private research centers.
L’archive ouverte pluridisciplinaire HAL, est
destinée au dépôt et à la diffusion de documents
scientifiques de niveau recherche, publiés ou non,
émanant des établissements d’enseignement et de
recherche français ou étrangers, des laboratoires
publics ou privés.
Optimization of pre-concentration, entrainer recycle and
pressure selection for the extractive distillation of
acetonitrile-water with ethylene glycol
Xinqiang You, Jinglian Gu, Vincent Gerbaud, Changiun Peng, Honglai Liu
To cite this version:
Xinqiang You, Jinglian Gu, Vincent Gerbaud, Changiun Peng, Honglai Liu. Optimization of
pre-concentration, entrainer recycle and pressure selection for the extractive distillation of
acetonitrile-water with ethylene glycol.
Chemical Engineering Science, Elsevier, 2018, 177, pp.354-368.
O
pen
A
rchive
T
OULOUSE
A
rchive
O
uverte (
OATAO
)
OATAO is an open access repository that collects the work of Toulouse researchers and
makes it freely available over the web where possible.
This is an author-deposited version published in :
http://oatao.univ-toulouse.fr/
Eprints ID : 19582
To link to this article :
DOI: 10.1016/j.ces.2017.11.035
URL :
http://dx.doi.org/10.1016/j.ces.2017.11.035
To cite this version :
You, Xinqiang and Gu, Jinglian and Gerbaud,
Vincent
and Peng, Changiun and Liu, Honglai Optimization of
pre-concentration, entrainer recycle and pressure selection for the extractive
distillation of acetonitrile-water with ethylene glycol. (2018) Chemical
Engineering Science, vol. 177. pp. 354-368. ISSN 0009-2509
Any correspondence concerning this service should be sent to the repository
Optimization of pre-concentration, entrainer recycle and pressure
selection for the extractive distillation of acetonitrile-water with
ethylene glycol
Xinqiang You
a, Jinglian Gu
b, Vincent Gerbaud
c,⇑, Changjun Peng
a, Honglai Liu
a,⇑aState Key Laboratory of Chemical Engineering and Department of Chemistry, School of Chemistry & Molecular Engineering, East China University of Science and Technology, Shanghai 200237, China
bSchool of Chemistry and Chemical Engineering, Chongqing University, Chongqing 400044, China cLaboratoire de Génie Chimique, Université de Toulouse, CNRS, INP, UPS, Toulouse, France
h i g h l i g h t s
!We optimize an extractive distillation process with preconcentrator column. !The case study belongs to the usual 1.0-1a class; min T + E heavy.
!Lowering the pressure enhances relative volatility in all columns. !Lowering the pressure improves energy consumption and reduces costs. !Too much entrainer recycle impurity limits distillate purity and recovery.
Keywords: Extractive distillation Reduced pressure Energy savings Relative volatility Multi-objective optimization Pareto front
a b s t r a c t
We optimize the extractive distillation process for separating the acetonitrile – water azeotropic mixture with ethylene glycol by using a multi-objective genetic algorithm for minimizing under purity con-straints the total cost, the energy consumption and the separation efficiency. For the first time we have shown the interest of five aspects by considering them simultaneously (1) the pre-concentration column has been included and (2) there is no need to set a distillate composition constraint (like being at the azeotropic composition) in the pre-concentration column. (3) The operating pressure should be lower than 1 atm because it enhances the relative volatility for 1.0-1a class system. (4) A closed loop optimiza-tion must be run, to handle the effect of impurity in the entrainer recycle since too much impurity limits the main product recovery and purity from the extractive column. (5) All three columns process must be optimized together rather than sequentially and with multiple objectives. The studied system belongs to class 1.0-1a and the impurity of the recycled entrainer has strong effect on the purity of acetonitrile prod-uct. Overall, 17 variables are optimized; column trays, all feed locations, refluxes, entrainer flow rate and all distillate products; under purity constraints for the acetonitrile and water product and for the entrai-ner recycle impurity. Among nearly 400 designs satisfying the purity specifications, the design case 3 shows an energy consumption and TAC reduced by more than 20% than a literature reference case, thanks to smaller entrainer flow rate, a reduction of 32 trays and lower operating pressures. The best design is a trade-off between first a feasibility governed by thermodynamics through composition profiles and rel-ative volatility maps and second process cost and energy demands.
1. Introduction
Acetonitrile is a widely used organic solvent in the chemical industries for the purification of butadiene and fatty acid, and an
important chemical material and synthetic intermediate in the pharmaceutical industries due to its highly chemical activity. It is also employed as the mobile phase of liquid chromatography thanks to its low viscosity and chemical reactivity (Armarego and Chai, 2013). In the processes above, large amounts of acetonitrile-water mixtures are produced. They couldn’t be straightly dis-charged or treated in biological plants because of the high price and high toxicity of acetonitrile. Therefore, the recovery of acetoni-⇑Corresponding authors.
E-mail addresses:vincent.gerbaud@ensiacet.fr(V. Gerbaud),hlliu@ecust.edu.cn
trile from its aqueous solution is an emerging problem from the views of environment and economics. However, it is impossible to separate acetonitrile from its aqueous solution by conventional distillation since there is an azeotrope between acetonitrile and water with 67.3% mol acetonitrile in the azeotrope at 349.9 K under atmospheric pressure. Consequently, advanced distillation tech-nologies like pressure swing distillation or extractive distillation are needed (Doherty and Knapp, 1993).
Pressure swing distillation (PSD) can be employed to separate pressure-sensitive minimum-boiling or maximum-boiling azeotro-pic mixtures without adding a third component called entrainer (Luyben, 2012). It exhibits the advantages of no entrainer impurity in the product stream and the energy-savings potential of carrying out a fruitful heat integration. Fortunately, the azeotrope of ace-tonitrile and water is pressure sensitive and it could be separated by PSD.Repke et al. (2005)studied the PSD process for separating acetonitrile-water and analyzed the process operation perfor-mance, but no process energy consumption and total annual cost (TAC) was mentioned.Huang et al. (2008)investigated the rectify-ing/stripping sections type heat integration in PSD columns for sep-arating acetonitrile-water mixture, and they found that it failed to compete with the simple condenser/reboiler type heat integration process for the studied case.
Extractive distillation (ED) is another alternative in which the entrainer is fed at a different location than the main mixture, bring-ing an additional extractive section in the column, between the usual stripping and/or the rectifying sections (Rodriguez-Donis et al., 2009). In the extractive section, the entrainer should interacts differently with the azeotropic components, giving rise to an increase in the relative volatility of the original components. The ED process is widely used among process to separate azeotropic mixtures because of low energy consumption and the flexible selection of possible entrainers (Mahdi et al., 2015).
Acosta-Esquijarosa et al. (2006)studied the recovery of acetoni-trile from its aqueous solution by combining solvent extraction and batch distillation process with butyl acetate as solvent.Liang et al. (2014) optimized the conventional ED process for acetonitrile-water separation with ethylene glycol (EG) as entrainer by sequen-tial iterative optimization procedure, and the process energy cost was reduced by 16% through combining the pre-concentration col-umn with a preset distillate output and entrainer recovery colcol-umn. For the design of an ED process, there are two main issues: entrainer selection and process optimization. The entrainer selec-tion is an important step since the effectiveness of separaselec-tion was strongly relied upon the interactions between entrainer and azeo-tropic mixture. Gerbaud and Rodriguez-Donis (2014) have Nomenclature
AC condenser heat transfer area [m2]
AR reboiler heat transfer area [m2]
CEPCI chemical engineering plant cost index Costcap capital cost [106$]
Costope operating cost [106$]
CostCA column annual cost [106$]
CostHA cost of heater for cooling recycling entrainer [106$]
D distillate flow [kmol/h]
D0 distillate flow of pre-concentration column D1 distillate flow of extractive column D2 distillate flow of regeneration column Diameter diameter of column
E entrainer
Eext the efficiency indicator of extractive section
eext the efficiency indicator of per tray in extractive section
eext
ED extractive distillation EG ethylene glycol F feed flow rate [kmol/h]
F2 feed flow rate of the regeneration column [kmol/h]
FAB original azeotropic mixtures feed flow rate [kmol/h]
FE entrainer feed flow rate [kmol/h]
FE/F feed ratio, continuous process
Height height of column
Ics column shell investment cost [106$]
IHE heat exchanger investment cost [106$]
k product price factor for A vs B LP low pressure
MP middle pressure HP high pressure
m energy price difference factor for condenser vs reboiler N number of theoretical stages
NE number of theoretical stages of extractive column
NFE entrainer feed stages
NFF original mixture feed stages
NFP feed stages of pre-concentration column
NFR feed stages of entrainer regeneration column
NP number of theoretical stages of pre-concentration
column
NR number of theoretical stages of regeneration column
NSGA Non-dominated Sorting Genetic Algorithm
GEC modified objective function (the energy consumption per product flow rate)
P pressure [Hgmm] [atm]
P0 pressure of the pre-concentration column
P1 pressure of the extractive column
P0 pressure of the entrainer regeneration column
PSD pressure-swing distillation
Qc0 condenser heat duty of pre-concentration column [MW]
Qc1 condenser heat duty of extractive column [MW]
Qc1 condenser heat duty of regeneration column [MW]
QHA heat duty of heater for cooling recycling entrainer [MW]
Qr0 reboiler heat duty of pre-concentration column [MW]
Qr1 reboiler heat duty of extractive column [MW]
Qr2 reboiler heat duty of regeneration column [MW]
R reflux ratio
R0 reflux ratio of pre-concentration column
R1 reflux ratio of extractive column
R2 reflux ratio of entrainer regeneration column
T temperature [K] TAC total annual cost
W2 bottom liquid flow rate of entrainer regeneration
col-umn [mol/h] xD distillate fraction
xi liquid mole fraction of component i
xF original mixture liquid mole fraction
xE entrainer liquid mole fraction
xp,lower product mole fraction at the lower feed tray of the
extractive section
xp,upper product mole fraction at the upper feed tray of the
extractive section Greek letters
reviewed the entrainer selection rules along with the process feasi-bility assessment for the separation of minimum or maximum boil-ing azeotropes with light, intermediate or heavy entrainers, depending on the classification of the studied system. Then, once a classification is considered, the process optimization is usually undertaken under target purity and recovery constraints, either minimizing solely the process energy cost or the total annual cost. Less commonly a multi-objective optimization is performed by tar-geting energy cost, TAC and other goals like thermodynamic effi-ciency (Ortiz and Oliveira, 2014) or CO2 emissions (You et al., 2016a).
Overall, the optimization issue consists in finding suitable oper-ating parameters. This is a routine procedure in most recent pub-lished works, but not with the same level of accuracy. Very often, some parameters are fixed, a single objective is targeted or the opti-mization is not performed globally. Typically, the columns tray numbers, main feed and entrainer feed tray locations, reflux ratios are optimized sequentially (Arifin and Chien, 2008; De Figueiredo et al., 2011among others). But, other parameters should now be considered systematically. Recently we showed that for the separa-tion of minimum boiling azeotrope with a heavy entrainer by ED, a lower pressure in the extractive section improves the azeotropic components relative volatility and reduces TAC by You et al. (2015a) and Luyben (2016). Some authors have also noticed that a properly designed column usually exhibit features related to the entrainer ability to enhance volatility. Hence, they have solved multi-objective problem including the maximization of a separa-tion efficiency indicator (You et al., 2015a, 2015b), or added addi-tional constraints to a mono-objective problem like the entrainer content on the solvent feed tray (De Figueiredo et al., 2015a, 2015b). Furthermore, several authors have shown the importance of optimizing the extractive distillation column together with the entrainer regeneration column (Luyben and Chien, 2011) and to do so simultaneously (Kossack et al., 2008; García-Herreros et al., 2011; You et al., 2015a).You et al. (2016b)recently showed that one motivations for that is because the entrainer recycle impurity sets limitations on the achievable product purity and recovery yield because of the column material balances interactions.
Regarding the studied case we use for illustration,Liang et al. (2014) reported a sequential optimization of the acetonitrile – water extractive distillation process with ethylene glycol, incl. a preconcentration column and a recovery column. They assumed (i) that all columns operated at 1 atm, (ii) the purity of the distillate in the pre-concentration column as 65%, (iii) the recycling entrainer purity equal to 99.999%, and the columns were optimized one at a time. Based on our literature survey, those assumptions on the pro-cess would affect the optimization results of the extractive distilla-tion process.
In this paper, we waive the above assumptions and with the aim of showing how that can improve the design of the ED process for acetonitrile-water with EG as entrainer, we perform a multi-objective optimization problem solved with the help of a genetic algorithm method. The five aspects not yet considered together in the literature and referring to the flowsheet shown inFig. 1 are the following: (1) is the pre-concentration column necessary? (2) the composition in the distillate of the pre-concentration column is a variable rather than specified as done in literature (Liang et al., 2014). (3) the operating pressures of all three columns become optimization variables. (4) by optimizing the process flow-sheet in closed loop, the impact of the purity of recycling entrainer in W2 on the process feasibility in terms of product purity and
recovery is taken into account. (5) all three pre-concentration, extractive and regeneration columns are optimized simultaneously with the use of a modified energy cost objective function GEC in addition to the total annual cost. Liang’s design is chosen as the base case for the sake of comparison. Notice that the process needs
a makeup entrainer to compensate its losses with the products. As its flow rate value is not known beforehand, we set it as usual, equal to the entrainer losses, which could be obtained by combin-ing the entrainer loss streams ED1 and ED2 after sharp splits by using virtual SEP1 and SEP2 on the two product distillates D1and
D2as shown inFig. 1, respectively.
The paper is organized as follow. Section2describes the multi-objective optimization problem, its solving and details the multi-objective functions. Section3presents the results in terms of multi-criteria Pareto front and compare the final solutions with the base case. In Section 3, we analyze the final solutions with respect to the extractive separation efficiency and the relative volatility profiles. We conclude in Section4by discussing the importance of the five design issues aforementioned on the solutions.
2. Multi-objective genetic algorithm and process evaluation 2.1. Multi-objective genetic algorithm
As a consequence to the choices we make, seventeen variables are optimized: the tray numbers of the pre-concentration, extrac-tive and regeneration columns NP, NEand NR; the column feed
loca-tions NFP, NFE, NFF, NFR; the distillates, reflux ratios and operating
pressures D0, D1, D2; R0, R1, R2; P0, P1, P2, and the entrainer flow rate
FE, respectively.
The studies of Rangaiah et al. review the limitations and the advantages of multi-objective optimization in the design and oper-ation of energy efficient chemical processes (Rangaiah, 2009; Rangaiah et al., 2013, 2015). Compared with the sequential iterative optimization procedure dominantly used in the extractive distilla-tion literature (see Secdistilla-tion 1), genetic algorithms are attractive because they are able to perform a multi-objective optimization where the influence of each parameter on the solution is evaluated simultaneously rather than sequentially. Unlike single objective optimization method as done in the study of Kossack et al. (2008), multi-objective genetic algorithm provides a list of solu-tions satisfying the purity constraints but with different operating parameters. Pareto fronts displaying the results give hints at the flexibility on choosing design parameters enabling a feasible pro-cess. Although the multi-objective genetic algorithm is computer intensive, it is less sensitive to initialization and requires no explicit information of the mathematical model or its derivatives because the algorithm is based on a direct search method (Leboreiro and Acevedo, 2004).
The multi-objective genetic algorithm called ‘‘gamultiobj” in Mat-lab was linked with Aspen plus V7.3 process simulator. Non-dominated Sorting Genetic Algorithm (NSGA) II is the method we used as it proved successfully in the optimization of several distilla-tion processes (You et al., 2015a; Bravo-Bravo et al., 2010). The rigor-ous model Radfrac including MESH equations in Aspen Plus was adopted for the process simulation. As the result of the GA multi-objective optimization, the Pareto front displays a set of non-dominated, optimal designs (Gomez et al., 2010) that satisfy the specification of the product purities. Notice that any design belong-ing to the Pareto front means that it couldn’t be improved through one objective function without worsening the other objectives. 2.2. Process evaluation
2.2.1. Economical evaluation
The total annual cost (TAC) is used for economically evaluating the different designs since it is a trade-off between capital cost and operating cost. It is computed from the following formula:
TAC ¼ capital cost
The operating cost contains the energy cost in reboiler and con-denser. The capital cost consists of the column shell, tray and heat exchanger and the related capital cost formulas are shown in Appen-dix A. The Douglas’ cost formulas (Douglas, 1988) are transferred into CEPCI inflation index and employed for calculating the process capital cost. TheCEPCI (2016)with value of 567.3 and a three-year payback period are selected. Notice that when the operating pres-sure is not higher than 3 atm, the effect of prespres-sure on the capital cost could be neglected according to Douglas’ cost formulas (Douglas, 1988). Similarly, the capital cost of vacuum pressure con-ditions that we investigate is considered negligible compared to the costs of the other pumps shown inFig. 1. The heat exchanger for cooling the recycling entrainer is taken into account in order to emphasize its effect on the process. Notice that the tray number is counted from top to down of the column, and the condenser and reboiler are regarded as the first and last tray. The tray efficiency of 85% (De Figueiredo et al., 2015b) is used for calculating TAC. Other costs such as the liquid delivery pumps, pipes, valves are neglected. 2.2.2. Energy consumption evaluation
With the aim of optimizing the three columns inFig. 1 simulta-neously rather than in sequence, we define a global energy con-sumption function (GEC) is as follow.
GEC ¼M0& QR0þ M1& QR1þ M2& QR2þ m & QC0þ m & QC1þ m & QC2
D1
ð2Þ
The meaning of the variables is shown inFig. 1. The factor m repre-sents the energy price difference for condenser vs reboiler and its value equals to (cooling water price)/(low pressure steam price)
= 0.036 (You et al., 2015a, 2015b). The factor M reflects the prices of different pressure heat steams and equals 1, 1.065 or 1.280 when low, middle or high pressure steam is used, respectively. The sub-scripts 0, 1 and 2 refer to the pre-concentration, the extractive and the regeneration column, respectively. The process utilities are shown inTable 1.
The meaning of GEC is the energy consumption used per product unit flow rate (kJ/kmol). It accounts for all the columns and also reflects the weight coefficient of the reboiler - condenser heat duty. The energy consumption function GEC could be easily expanded to more columns process.
The GEC formula contains the valuable distillate products streams in the denominator. For our case study, D2is no need to
be treated at denominator of GEC since D2product is water. But
constraint 2 is necessary for reducing the entrainer EG losses since according to the interrelationships among distillates (You et al., 2016b) it impacts the process ability to achieve the desired purity in D1. Besides, constraint 2 also sets a lower limit to the loss of
ace-tonitrile in D2which should improve the recovery of acetonitrile in
D1. Constraint 1 then helps keeping a high acetonitrile purity.
Con-Fig. 1. Three columns closed loop flowsheet of acetonitrile (A) – water (W) extractive distillation with ethylene glycol (EG) as entrainer. The data correspond to our best design, named case 3.
Table 1
Process utilities (Zhu et al., 2015).
Name Pressure/MPa Temperature/K Price/$/GJ
LP steam 0.5 433 7.72
MP steam 1.0 457 8.22
HP steam 1.5 527 9.88
straint 3 works for avoiding too much acetonitrile loss in the bot-tom liquid of the pre-concentration column. In introduction, we insisted on the recycling entrainer purity in stream W2that should
be compatible with constraint 1 on the main product. A fourth con-straint could be set accordingly. Instead, we adopt a solving strat-egy where the optimization problem handled by the genetic algorithm monitors the process simulation carried out by Aspen plus software in closed loop. The Wegstein tear method in Aspen plus software handles the purity and flowrate of the recycling entrainer stream which is automatically determined through the simulation process to match the constraints at the optimization problem level.
2.2.3. Separation efficiency evaluation
In the extractive distillation process, monitoring the amount of entrainer in the middle (extractive) section, between the entrainer and main feed tray locations, is vital for separating azeotropic mix-ture.Knapp and Doherty (1994)discussed the minimal amount of entrainer andDe Figueiredo et al. (2015a, 2015b)used the amount of entrainer on the entrainer feed tray as a constraint for designing the column. In this work we use the efficiency indicator of extrac-tive section Eextand the efficiency indicator of per tray in extractive
section eextthat we proposed recently (You et al., 2015a). They
rep-resent the ability of the extractive section to discriminate the desired product between the top and the bottom of the extractive section. The efficiency indicator per tray eextis supplementary to
Eextfor dealing the different designs with different
entrainer-to-feed flow rate ratios, different reflux ratios and different tray num-bers in the extractive section:
Eext¼ xp;upper' x(p;lower ð3Þ
eext¼
Eext
Next' 1 ð4Þ
where xp,upperis the product mole fraction at the upper feed tray of
the extractive section and x⁄
p,lowerrepresents the product mole
frac-tion at the lower feed tray of the extractive secfrac-tion. In this study, the value of xp,loweris taken from one tray higher than the lower feed
location in order to avoid the effect of the original composition in the main feed on the efficiency indicators. And Nextis the tray
num-ber of the extractive section. Notice that the entrainer feed tray is counted into Nextand the main feed tray is excluded.
3. Results and discussions 3.1. Problem setting
A 500 kmol/h acetonitrile-water mixture (FAB) was fed to the
extractive column at 320 K with a mole composition of 20% ace-tonitrile, the same as that in the study of Liang et al. with the aim of comparison. The ternary vapor'liquid equilibrium of the system acetonitrile'water with EG is modelled similarly to Liang’s literature work (Liang et al., 2014) for the sake of comparison. The NRTL thermodynamic model with the Aspen Plus built-in binary parameters (See Table Ain Appendix B) was used for the liquid phase while the vapor phase was assumed to be as a perfect gas.
In the multi-objective problem, the global energy cost GEC and TAC are minimized while the two efficiency indicators Eextand eext
are maximized. min TAC min GEC max Eext max eext 8 > > > < > > > : subject to : xacetonitrile;D1P0:9999 xwater;D2P0:999 xwater;W0P0:999 ð5Þ
From the economical view, the desired design is the one with the minimum TAC although four objectives are used. The logic of a mul-tiobjective optimization comes from an earlier paper (You et al., 2015b) where we showed that the design solutions corresponding to the minimum TAC or to the minimum energy cost are different. The energy consumption GEC objective could not be solely employed to determine the tray number of columns, but it is useful for finding the variables once the column tray number was fixed. And like TAC, it is also a practical standard of comparison among different designs. There are several reasons for adding efficiency indicators as objec-tives. They concern the extractive section, which drives the feasibil-ity of the whole process (Knapp and Doherty, 1994; Rodriguez-Donis et al., 2009).You et al. (2015b)showed that they are useful to compare seemingly TAC or energy equivalent designs and the solutions displayed in the Pareto fronts hint at the flexibility on choosing design parameters enabling a feasible process. Besides, the separation efficiency per tray eextis used herein to avoid
exces-sive trays employed in the extractive section when Eext only is
maximized.
The purpose of the constraints is explained below. The GEC for-mula contains the valuable distillate products streams in the denominator. For our case study, D2is no need to be treated at
denominator of GEC since D2product is water. But constraint 2 is
necessary for reducing the entrainer EG losses since according to the interrelationships among distillates (You et al., 2016b) it impacts the process ability to achieve the desired purity in D1.
Besides, constraint 2 also sets a lower limit to the loss of acetoni-trile in D2 which should improve the recovery of acetonitrile in
D1. Constraint 1 then helps keeping a high acetonitrile purity.
Con-straint 3 works for avoiding too much acetonitrile loss in the bot-tom liquid of the pre-concentration column. In introduction, we insisted on the recycling entrainer purity in stream W2that should
be compatible with constraint 1 on the main product. A fourth con-straint could be set accordingly. Instead, we adopt a solving strat-egy where the optimization problem handled by the genetic algorithm monitors the process simulation carried out by Aspen plus software in closed loop. The Wegstein tear method in Aspen plus software handles the purity and flowrate of the recycling entrainer stream which is automatically determined through the simulation process to match the constraints at the optimization problem level.
The population and the crossover and mutation fractions param-eters of the genetic algorithm were tuned after several preliminary tests. After tuning, 400 individuals, 0.9 for crossover fraction and 0.1 for mutation fraction were employed. When the number of gen-erations reaches 480, the four objective functions could not be fur-ther improved and the optimization stops. More about the solving progress along the generations is available inTable CinAppendix B. The stand-alone computer and its CPU was Intel (R) core i7 (3.6 GHz) with 4Gbytes memory. It took about 12 days to get results, with an average of 5 s for each of the 1.92 ) 105Aspen plus
simulations. This is much longer than deterministic optimization which can be carried out in minutes or hours (Kossack et al., 2008) but in addition to a robustness to initial conditions and appli-cability to unknown structure problem, the genetic algorithm results offer a large panel of feasible design parameters which can be analyzed to gain further knowledge on the process.
The seventeen variables being optimized are NP, NE, NR, NFP, NFE,
NFF, NFR, D0, D1, D2, R0, R1, R2, FE, P0, P1, P2, referring toFig. 1. The
value ranges encompass those of the reference design (seeTable 2
below) and are [3'5] for NP, [20–70] for NE, [3 '30] for NR, [2'0] for
NFP, [2'20] for NFE, [15–60] for NFF, [2'20] for NFR, [140.00–160.00]
kmol/h for D0, [99.00–101.00] kmol/h for D1, [0.00–400.00] kmol/h
for D2, [0.001–1.000] for R0, [0.010–1.500] for R1, [0.010–1.000] for
R2, [20.0–250.0] kmol/h for FE, [0.3–1.5] atm for P0, P1and P2. The
the flow rate of azeotropic mixture is constant. We set 0.3 atm as the lower limit of the operating pressure as below that value, we cannot use cheap cooling water at the condenser. The low bound of FE is set based on the minimal amount of entrainer to break
the azeotrope of acetonitrile-water at 0.3 atm. It is greater than 20 kmol/h, based on the procedure in Gerbaud and Rodriguez-Donis (2014), that comes from the knowledge of the intersection of the univolatility curve
a
Acet.,Water= 1 with the EG-acetonitrileedge and assuming a positive reflux ratio and distillate flow rate near 100 kmol/h.
3.2. Design results and discussions 3.2.1. Designs with pressure drop per tray
Since the azeotrope of acetonitrile–water is pressure-sensitive, it is necessary to consider the pressure drop per tray. The pressure drop per tray for the three columns employed herein is 0.0068 atm
(Luyben and Chien, 2011). This impacts all columns and induces feed composition changes. Indeed, the literature design with no pressure drop (Liang et al., 2014) was found unable to achieve the product purities when simply considering pressure drop: case 1 inTable 2show that the acetonitrile purity is below the specified value. Therefore, we optimized the three reflux ratios for meeting the product purities specifications by using two-step optimization procedure (You et al., 2015a) while keeping other variables the same as case 1. The modified design called case 2 is also shown inTable 2. The sizing parameters and the cost data of the designs case 1 and 2 are shown inTable BinAppendix B. Case 2 is 7% less profitable and 7% more energy demanding. These numbers are sig-nificant and highlight the need to consider pressure drop systematically.
3.2.2. Pareto front of the three columns process design solutions The progress of the NSGA II convergence is shown inTable Cin
Appendix B. In the final Pareto front, we obtained 400 designs that meet the purity specifications and constraints. There are 169 designs with a TAC lower than that of case 1 and 228 designs with a TAC below that of case 2. The operating pressures of the three col-umns were all 0.3 atm in the whole 400 designs although its value range was set from 0.3 atm to 1.5 atm. The main reasons are that the relative volatility of acetonitrile over water and the azeotropic composition of acetonitrile increases under lower pressure. That behaviour highlights the need to consider the operating pressures of the three columns as variables. It was also noticed that lowering the pressure enhanced the relative volatility of the acetonitrile over water at the same entrainer flow rate, and by promising an easier separation, it could lead to the reduction of TAC for the studied sys-tem, which belongs to 1.0-1a extractive separation class. Lowering the pressure has been employed for other 1.0-1a class, such as the acetone – methanol separation with water, the Diisopropyl Ether – Isopropyl Alcohol separation with methoxyethanol and 2-methoxyethanol – toluene separation with DMSO (You et al., 2015a, 2016b; Li et al., 2017).
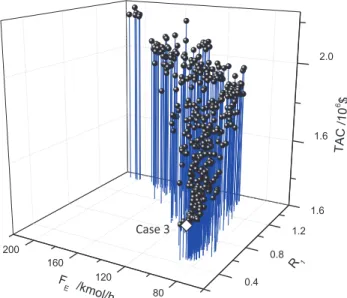
Results belonging to the Pareto front of the stochastic optimiza-tion are displayed inFigs. 2–4.Fig. 2shows the Pareto front of the acetonitrile'water'EG system, TAC versus GEC and Eext. Fig. 3
shows the effects of key variables R1and FEin the extractive column
on the process TAC. The lowest TAC design, namely case 3, is shown as a white diamond inFigs. 2 and 3. More design parameters of case 3 are presented later inTable 4. Case 2 satisfies the three purity constraints but does not belong to the Pareto front because it
pro-Table 2
The reference design and its modification.
Case 1a Case 2 Pressure drop/atm 0.0068 0.0068 NP 16 NE 54 NR 19 NFP 8 NFE 6 NFF 46 NFR 10 D0/kmol/h 153.793 D1/kmol/h 99.97 D2/kmol/h 53.823 R0 0.0884 0.155 R1 0.466 0.747 R2 0.225 0.276 FE/kmol/h 145 P0/atm 1 P1/atm 1 P2/atm 1 xacetonitrile,D1 0.98749 0.99996 xwater,D2 0.99526 0.99995 xwater,W0 0.99631 0.99991 GEC/kJ/kmol 199285.0 213205.6 TAC/106$ 1.669 1.781 Eext 0.219 0.178 eext 0.0053 0.0043
a Design using Liang’s parameters (Liang et al., 2014) and adding a pressure drop.
duces less distillate (see Section3.2.4). Compared with case 2, case 3 design essentially improves greatly the TAC and GEC while neces-sitating much less entrainer, less heat exchange and less tray
num-bers in all three columns, and producing more distillate. Although the recycling entrainer purity was not set as a constraint for rea-sons given in Section2.2.2, all designs showed a very high purity,
Fig. 3. Effects of key variables R1 and FE in the extractive column on the process TAC of the acetonitrile'water'EG system, TAC versus R1and FE.
Case 3
Case 2
Case 2
Case 2
Case 3
Case 3
which we explained was necessary as recycling impurities might prevent the design to achieve high recovery and purity of the prod-ucts in distillates D1and D2.
FromFig. 2, we know the followings: (1) The design case 3 is the one with the lowest TAC (1.410 ) 106$) and a GEC (158440.1 kJ/
kmol). The lowest energy consumption design (case 4 inTable 3) with GEC (156628.6 kJ/kmol) exhibits a higher TAC (1.445 ) 106
$) than case 3. This demonstrates that GEC and TAC are consistent but not equivalent to be interchangeable, thus motivating our solv-ing of a multi-objective problem. Compared to the modified litera-ture design (case 2), case 3 displays a 20% reduction of the TAC. (2) The efficiency indicator Eextdecreases following the decrease of GEC
and TAC. This happens because Eextis related to the composition
profile in the extractive section and that is strongly influenced by the entrainer flow rate and the reflux ratio of extractive column. In return, FEand R re the dominant parameters through the column
size and the reboiler heat in the global energy cost and TAC evalu-ation. In agreement with the literature (You et al., 2015b), maxi-mizing the separation efficiency cannot be the only parameter driving the design.
FromFig. 3, we observe that (1) TAC increases with the increase of FEand R1. The main reason is that a high FEinfers a high energy
cost in the regeneration column and TAC increases consequently. (2) The economically feasible value range (case 3 minimum TAC + 10%) of the entrainer flow rate is (80–90 kmol/h), namely, (0.16–0.18) for FE/F. This value is nearly 38% lower than that
(0.29) in literature’s case 2. Below FE= 76 kmol/h, no solution is
found, which much greater than the minimal entrainer amount necessary to break the azeotrope of acetonitrile-water.
3.2.3. Effects of tray numbers
Fig. 4shows the influence of the tray numbers of each of the three columns on the process total annual cost. The white box rep-resents the reference design case 2.
The Pareto front inFig. 4show that for the pre-concentration column no design was found with NPlower than 9 well over the
lower bound set at 2 for NP;or greater than 25 (the upper bound).
Designs with TAC < TACmin+ 10% require NP between 9 and 13.
Recall that the reference case 2 has NP= 16. In addition, even at
NP= 16, there are still five better designs with a lower TAC than that
of case 2. That shows the need to optimize the pre-concentration column.
For the extractive column, the potential of improvement com-pared to the literature reference is huge. One design in the Pareto front goes as low as NE= 35. Design matching the product purity
constraints and high recovery are found with NEas many as 69.
But the lowest TAC design (case 3) NE= 38 is close and the range
spanning designs with TAC < TACmin+10% goes up to 53. Case 2
value (54) is close. The results confirm that employing too many trays in the column will lead to the increase of capital cost and TAC, but that NEis not a very sensitive variable for the TAC. The
main reason is that when performing a full optimization of the whole column sequence, the reflux ratio R1and the entrainer flow
Table 3
Azeotropic temperature and acetonitrile azeotropic composition for case 1, 2 and 3. Pressure/ atm xacetonitrile, D0/ mole Tazeo/ ("C) xazeo/ mole aABa Case 1 and 2 1 0.650 349.96 0.673 1.07 Case 3 0.3 0.6447 317.79 0.765 1.46 a The relative volatility of acetonitrile (A) over water (B) at distillate stream (D
0) of pre-concentration column.
Table 4
Design parameters of the three columns extractive distillation process for the separation of acetonitrile – water with EG.
Case 3 Case 4 Case 5 Case 6
NP 9 9 18 25 NE 38 53 67 68 NR 10 10 18 25 NFP 2 2 2 2 NFE 4 4 4 4 NFF 29 37 50 17 NFR 4 4 4 5 D0/kmol/h 155.10 155.11 155.16 155.27 D1/kmol/h 100.01 100.01 100.01 100.01 D2/kmol/h 55.14 55.15 55.16 55.28 R0 0.001 0.001 0.001 0.046 R1 0.488 0.463 1.497 1.489 R2 0.149 0.135 0.324 0.391 FE/kmol/h 88.0 85.2 101.0 203.0 P0/atm 0.3 0.3 0.3 0.3 P1/atm 0.3 0.3 0.3 0.3 P2/atm 0.3 0.3 0.3 0.3 xacetonitrile,D0 0.6447 0.6447 0.6445 0.6440 xacetonitrile,D1 0.9999 0.9999 0.9999 0.9999 xwater,D2 0.9991 0.9991 0.9998 0.9996 GEC/kJ/kmol 158440.1 156628.6 200728.3 228128.3 TAC/106$ 1.410 1.445 1.948 2.226 Eext 0.211 0.213 0.553 0.394 eext 0.0081 0.0063 0.0118 0.0281
FEcan be varied while changing NEin order to achieve a low TAC
and match the specifications. Varying R1 on the TAC is mainly
reflected by the reboiler duty of the extractive column, whereas the effect of altering FEon the TAC is mostly represented by the
reboiler duty of the regeneration column. Hence, the effects on TAC of changing the number of trays in the extractive section NE
affects the regeneration column cost. This confirms the importance to optimize all the columns together.
Regarding the regeneration column, the trend is similar to the pre-concentration column. The range encompassing designs having TAC < TACmin+ 10% spans only 5 trays, from 9 to 13. The minimum
TAC is found for NR= 10, whereas case 2 value (NR= 19) is far,
showing how the TAC was improved by our multi-objective optimization.
3.2.4. Effects of the distillate flow rates on the process
The effects of the distillates of the pre-concentration and regen-eration columns (D0and D2) on the process TAC are shown inFig. 5.
For the distillate of extractive column D1, all the Pareto front
solu-tions found a constant value 100.01 kmol/h even though it was allowed to vary from 99.00 to 101.00 kmol/h as mentioned in Section3.2.2.
For the distillate of the pre-concentration column D0fromFig. 5,
we observe that (1) D0exhibits a non-linear effect on process TAC
and varies in a very narrow range between 155.08 kmol/h and 155.38 kmol/h with a minimum TAC at 155.10 kmol/h, despite that we set D0belong to [140.00, 160.00] kmol/h. It demonstrates the
existence of suitable distillate value range following process mass balance and product recovery. The suitable distillate values are nar-row. (2) This is 1.31 kmol/h higher that the literature value D0=
153.793 kmol/h (case 2). It happens because the case 2 design suf-fers the specification of 0.65 mol fraction acetonitrile in D0stream.
Our choice of releasing that constraint improves the product recov-ery slightly. In more details, Table 3 shows that the acetonitrile composition in D0stream in case 3 (0.6447) is very close to that
in case 2 (0.65). That marginal difference is fortuitous and not forced by any constraints. Conjugated to a reduction of the pressure it increases significantly the relative volatility of acetonitrile over water in D0stream in case 3 whereas that in case 2 it is near unity
since at P0= 1 atm, 0.65 is approximately the azeotrope
composi-tion (Table 3). Consequently, the number of trays and the reflux ratio needed to obtain a distillate with such low relative volatility are lower for case 3 comparing with that for case 2 (seeTable 2 and 4).
For the distillate of the regeneration column, we see that the D2
design range is as narrow as D0’s one, again with a minimum for
TAC at 55.14 kmol/h, despite the fact that D2 could vary from
49.00 to 58.00 kmol/h. D2in the case 3 design is higher than that
in case 2. This is a consequence of the fact that more water enters in D0stream, percolates in the extractive column bottom to enter
the regeneration column where it is separated from the entrainer. 3.2.5. Comparison of final design parameters
Since there are four objective functions, we select the designs in Pareto front named case 3, 4, 5 and 6 with the lowest TAC, the low-est GEC, the highlow-est Eext and the highest eext, respectively. The
parameters of the selected designs are shown inTable 4, referring to the notations inFig.1. The related sizing parameters and the cost data are shown inTable BinAppendix B.
Comparing the literature design (Table 2) with our design case 3 inTable 4, we find a significant improvement through decreasing the operating pressures of three columns. Comparing case 3 with case 2, the entrainer flow rate is reduced by 39.3%, from 145 kmol/h to 88 kmol/h which enables together with the reflux ratio reductions in the preconcentration and regeneration column, and the pressure reduction lowering the boiling temperatures to decrease the global energy consumption to drop by 25.6%.
From the process economic view, TAC is reduced by 20.8% thanks to the decrease of entrainer flow rate, column diameters, column tray number (32 trays less in total), heat exchanger areas and total reboiler duty. Going into more details, for the pre-concentration column, a 34.4% reduction of the column shell cost ICS from Table B in Appendix B is mainly contributed by the
decrease of the column tray number NPalthough the column
diam-eter is increased. Meanwhile, the operating cost is reduced by 22.1% because of the decrease of R0. The small value of R0indicates that
the pre-concentration column works like a stripper with nearly no reflux flow rate. The result indicates that imposing the con-straint of distillate purity (like being at the azeotropic composition) on the pre-concentration column is unsuitable. On the other hand,
the condenser heat exchanger area is increased threefold due to the decrease of the condenser temperature at a lower pressure. Overall, the saving of the column annual cost CostCAfor pre-concentration
column in case 3 reaches 16.6%. For the extractive column, the shell cost ICSand heat exchanger cost IHEin case 3 are reduced by 8.2%
and 38.5% compared with that in case 2, respectively. It is because of the decreases of the column height and of the condenser heat transfer area AR, caused by the increase of temperature driving
force and the decrease of the operating pressure. A lower pressure reduces the reboiler duty and induces a decrease by 26.6% of the operating cost Costope. For regeneration column, the annual cost is
cut down by 17.3% thanks to a 52% reduction of operating cost due to less entrainer entering the column, although the capital cost is increased by 18.0% caused by the increase of the reboiler heat exchanger area.
Following the definition of Eextand eext(You et al., 2015b), case 3
provides values for the suitable efficiency indicators Eextas 0.211
and eextas 0.0081. With respect to energy consumption, case 3 is
1.1% higher than the minimum GEC case 4. That latter shows a 2.5% higher TAC because more trays are employed in the extractive column. Case 4 uses less energy due to slightly lower reflux ratios in the extractive and regeneration columns. Obviously, there is a
trade-off between capital cost and operating cost. These results prove that minimizing TAC and GEC is not equivalent. This moti-vated our choice of setting two distinct objectives in our optimiza-tion problem.
Regarding now case 5 and 6. They correspond to the maximum total Eextand per tray eextextractive separation efficiency. In
agree-ment withYou et al. (2015), maximizing those indicators alone is not recommended for finding a proper design. Indeed, in accor-dance to their definition (see Section2.2.3) doing that kind of opti-mization forces the extractive section profile to cover the whole feasible region of the extractive section. In agreement with the thermodynamic insights discussed in the literature ( Rodriguez-Donis et al., 2011; Gerbaud and Rodriguez-Rodriguez-Donis, 2014; Petlyuk et al., 2015) that requires mostly an increase in reflux ratio since that is the main driver of the feasible region area. Then the tray number and entrainer flow rate adjust themselves to maximize the extent of the extractive section composition profile. Rather than reaching an extremum, an suitable value exist (see case 3), as was noticed byDe Figueiredo et al., 2015a, 2015bwho suggested to set the within an suitable range the solvent composition in the solvent feed tray, one of the bounds used to computed the extractive sep-aration efficiencies (see also discussion in Section, 3.2.6).
Another interesting point is that more distillate of acetonitrile with the same purity specification is obtained in our design com-pared with case 2 even though the entrainer flow rate, tray number of columns and energy consumption are all reduced dramatically. We attribute that benefit to the operation of the columns at lower pressure. That enhances the relative volatility in all columns and the separation is easier, esp. in the regeneration column where the entrainer recycle has less impurity. You’s relation between the product recovery and recycle stream impurity show that less impurity boosts up the extractive column distillate output (You et al., 2016b).
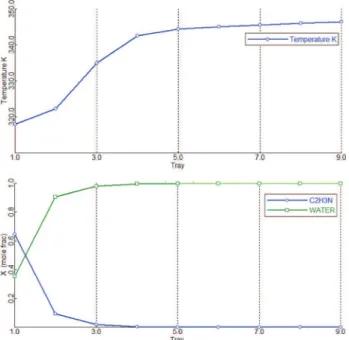
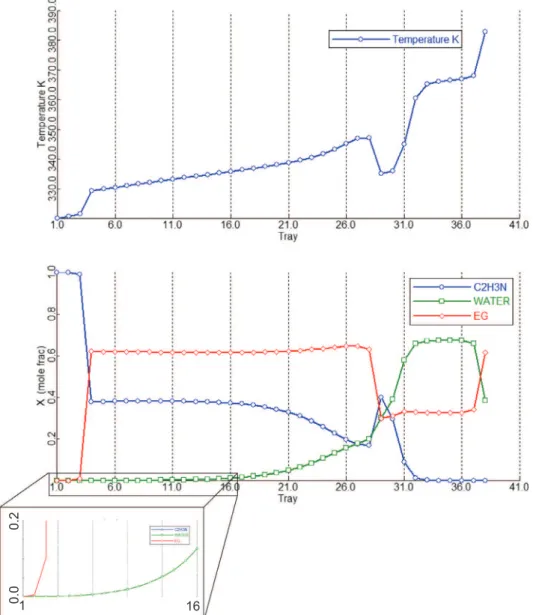
The temperature and composition profiles of the pre-concentration, extractive and regeneration columns of case 3 design are shown inFigs. 6–8.
In the pre-concentration column, the stripping and the rectify-ing section contains seven and two trays respectively. The small rectifying section is enough because the distillate composition is far from the azeotrope at low pressure as seen fromTable 3. It is worth stressing that unlike the usual belief (e.g. literature’s refer-ence case fromLiang et al., 2014) the design case 3 does not require feeding the extractive column with an azeotropic feed coming from D0. For the extractive column, the entrainer feed temperature
(specified at 320 K) is suitable, but the fresh feed (D0) temperature
is much lower than that of the related feed tray, resulting in the large heat duty difference between the reboiler and condenser. It hints that preheating the fresh feed should be considered for reduc-ing the reboiler duty QR1, but we did not consider it in this study.
The short rectifying section implies that the relative volatility of acetonitrile over EG is high enough. In the extractive section, the water content seems flat from tray number 16 to 4. But zooming inFig. 7shows that each tray is needed to prevent water entering the rectifying section, because of the high acetonitrile product pur-ity specification at 0.9999. Like other extractive separations of 1.0-1a mixtures, this proves the statement that the stable node of extractive section SNext should be as close as to the
entrainer-product edge for achieving high purity entrainer-product as obtained from thermodynamic insight (Rodriguez-Donis et al., 2009). Down the column, the stripping section prevents acetonitrile entering W2
fromFig. 7and the remixing of water and EG is observed. Lastly, the regeneration column works well for recycling entrainer EG as seen from its temperature and composition profile diagrams.
3.2.6. Insight from ternary maps and relative volatility diagrams
Fig. 9shows the ternary liquid composition profiles for case 2, 3, 5 and 6 in the extractive column of acetonitrile – water with EG. The ternary map of case 4 is similar to that of case 3. Those maps are useful to locate the suitable profiles and compare it to the feasible region of extractive section profiles analyzed by several authors (Donis et al., 2009; Gerbaud and Rodriguez-Donis, 2014; Petlyuk et al., 2015).
Fig. 10 displays the relative volatility of acetonitrile vs water through the extractive column for case 2, 3, 4, 5 and 6. Case 1 is not shown in Figs. 9 and 10since it does not reach the product
purity specification when taking the pressure drop per tray into account.
FromFig. 9, we observe that (1) the stable node of extractive section SNextat entrainer feed tray NFEare very close to the BE side,
and it demonstrates that this must occur to get a high purity prod-uct. (2) Less trays used in the rectifying section suggest that the separation between acetonitrile and EG is easy. (3) Analysis of the location of SNext(NFEarrow inFig. 9) for case 3 is interesting as this
is one of the constraintDe Figueiredo et al., 2015a, 2015bsuggested to constraint it between 0.2 and 0.75 for a good extractive distilla-tion design. First, it lies for all cases within that range. Hence, we conclude that De Figueiredo’s range is too large to be used as a guidance. Second, it should be closer for case 3 at first glance to the acetonitrile vertex due to a lower FEcompared with case 2. That
happens for case 5 and 6 inFig. 9. However, the opposite happens for case 2 and 3 because the location of SNextis also determined by
the reflux ratio R1, and it could be pushed toward product
acetoni-trile point by decreasing FEor increasing R1, as evidenced in the
lit-erature (Knapp and Doherty, 1994; Petlyuk et al., 2015). Therefore, there are competitiveness and trade-off between FE and R1 for
determining the location of SNext.
The extremum points NFFand NFE of the extractive profiles in Fig. 9are used to compute the efficiency indicators (Eqs. (3 and 4)) reported inTables 2 and 4. The largest Eextvalue (case 5) and
a high one (case 6) show that the feasible region of extractive dis-tillation gets larger as we increase FEand R1(like case 5 and 6).
Although feasibility is enhanced, high FEand R1raises the process
TAC and the energy consumption. The best design is a trade-off between a feasibility governed by thermodynamics through com-position profiles and process cost and energy demands.
The relative volatility maps in the extractive column displayed inFig. 10help understand the process operation. First for all design cases,
a
acetonitrile vs water=a
AB> 1.8 in the extractive section,show-ing that the addition of entrainer has enhanced the volatility towards and enabled the recovery of A, acetonitrile as distillate. In the rectifying section
a
AB< 1 and the water impurity ofacetoni-trile product may accumulate and pollute the acetoniacetoni-trile product in D1. This is the reason why a high purity recycled entrainer with
as low water as possible is needed and why so many trays in C1’s extractive section are needed to prevent water to enter the rectify-ing section. In the extractive section,
a
ABfor case 2 with higher FEand R1is lower than that in case 3. This happens because case 3
is operated at 0.3 atm rather than 1 atm and reducing the pressure
Fig. 10. Relative volatility of acetonitrile (A) vs water(B) through the extractive column for case 2, 3, 4, 5 and 6, acetonitrile – water with EG. Fig. 9. Ternary liquid composition profiles for case 2, 3, 5 and 6 in the extractive column of acetonitrile – water with EG.
increases
a
AB. With similar pressure, FEand R1, case 3 and 4 displaysimilar
a
ABvalues. Case 5 and 6, with very high extractivesepara-tion efficiencies are similar to each other and achieve relative volatilities up to 12. Again this shows that for extractive distillation, high FEand R1are harmful rather than useful for the separation
once their optimal values are surpassed. This observation agrees with the results shown in literature (Knapp and Doherty, 1994; You et al., 2015a; Petlyuk et al., 2015) for acetone-methanol with water system, and validated the statement that once FEis higher
than its minimum value, changing other variables like reflux ratio and feed locations is a better way to approach a suitable design (Gerbaud and Rodriguez-Donis, 2014).
5. Conclusion
With the help of a multi-objective genetic algorithm, we have completed the design of an extractive distillation process for sepa-rating the acetonitrile – water azeotropic mixture with EG as entrainer (1.0-1a extractive separation class). For the first time we have investigated specifically five aspects simultaneously that have been optimized. (1) the pre-concentration column has been included and (2) no distillate composition constraint (like being at the azeotropic composition) in the pre-concentration column has been set. (3) The operating pressure has been allowed to be lower than 1 atm as this might usually enhance volatility for 1.0-1a class system. (4) A closed loop optimization was run, to handle the effect of impurity in the entrainer recycle, because earlier of our works have shown that too much impurity limits the main product recovery and purity from the extractive column. (5) the three col-umns process was optimized together and with multiple objectives, including separately two process criteria, the total annual cost and the global energy consumption, and two thermodynamics related separation efficiency indicators. Overall, 17 variables are opti-mized; column trays, all feed locations, refluxes, entrainer flow rate and all distillate products; under purity constraints for the acetoni-trile and water product and for the entrainer recycle impurity.
Through the optimization, the Pareto front was obtained with nearly 400 designs satisfying the purity specifications. 169 designs exhibited a lower TAC than that a literature design value chosen as reference case 1 and modified to include pressure drop as case 2. For the design case 3, both the energy consumption and the TAC were reduced by more than 20% thanks to smaller entrainer flow rate, along with a reduction of 32 trays. All five aspects considered at the same time have been discussed and their value has been evi-denced when attempting to perform an extractive distillation pro-cess optimization. We have shown that TAC and global energy consumption objectives give close but distinct design parameters and it is recommended to consider them distinctly at the same time.
Analyzing the extractive separation efficiency indicators, we have shown that they depended upon the FEand R1variables.
Fur-ther analysis of maps of relative volatility in the extractive column illustrated that too high FEand R1are harmful rather than useful for
the separation once their minimum values are surpassed. Indeed, the best design is a trade-off between a feasibility governed by thermodynamics through composition profiles and process cost and energy demands.
Acknowledgment
This work was supported by the National Basic Research Pro-gram of China (2015CB251401), the Doctoral Fund of Ministry of Education of China (No. 2016M601528), the National Natural Science Foundation of China (No. 21706062).
Appendix A
The diameter of a distillation column is calculated using the tray sizing tool in Aspen Plus software.
The height of a distillation column is calculated from the equation:
H ¼N
eT) 0:6096 N tray stage except condenser and reboiler, eT
tray efficiency is taken as 85% for calculating TAC.
The heat transfer areas of the condenser and reboiler are calcu-lated using following equations:
A ¼ Q
u)MTu: overall heat transfer coefficient (kW K
'1m'2), u =
0.852 for condenser, 0.568 for reboiler.
The capital costs of a distillation column are estimated by the following equations:
Shell cos t ¼ CEPCI 100
%
& ) 902:8 ) D1:066H0:802) ð2:18 þ F
CÞ ¼ 22688:6
D1:066H0:802Unit of D and H: m
Tray cos t ¼ CEPCI 100
%
& ) 93:1 ) D1:55HF
C¼ 1426:0D1:55H Unit of D
and H: m
Heat Exchanger cost ¼ CEPCI 100 % & ) 457:4 ) A0:65) ð2:29 þ F CÞ ¼ 9367:8A0:65Unit of A: m2 Appendix B SeeTables A–C.
Table A
The built-in binary parameters of NRTL model for acetonitrile – water with EG. Component
i Acetonitrile Acetonitrile Water
j Water EG EG aij '0.1164 0 0.3479 aji 1.0567 0 '0.0567 bij 256.4588 536.542 34.8234 bji 283.4087 130.1648 '147.137 cij 0.3 0.3 0.3 Table B
Sizing parameters and cost data of three columns extractive distillation for acetonitrile – water with EG.
Column Case 1 Case 2 Case 3
C0 C1 C2 C0 C1 C2 C0 C1 C2 Diameter/m 1.010 0.956 0.827 1.034 1.037 0.840 1.123 1.259 1.020 Height/m 10.37 37.80 12.20 10.37 37.80 12.20 5.49 26.22 6.10 ICS/106$ 0.150 0.399 0.138 0.154 0.435 0.140 0.101 0.399 0.099 AC/m2 40 29 13 42 34 14 126 96 23 AR/m2 62 302 36 67 337 38 34 56 94
References
Acosta-Esquijarosa, J., Rodríguez-Donis, I., Jáuregui-Haza, U., Nuevas-Paz, L., Pardillo-Fontdevila, E., 2006. Recovery of acetonitrile from aqueous waste by a combined process: solvent extraction and batch distillation. Sep. Purif. Technol. 52, 95–101.
Arifin, S., Chien, I.L., 2008. Design and control of an isopropyl alcohol dehydration process via extractive distillation using dimethyl sulfoxide as an entrainer. Ind. Eng. Chem. Res. 47, 790–803.
Armarego, W.L.F., Chai, C.L.L., 2013. Purification of Laboratory Chemicals. Butterworth-Heinemann.
Bravo-Bravo, C., Segovia-Hernández, J.G., Gutiérrez-Antonio, C., Durán, A.L., Bonilla-Petriciolet, A., Briones-Ramírez, A., 2010. Extractive dividing wall column: design and optimization. Ind. Eng. Chem. Res. 49, 3672–3688.
CEPCI., 2016. CEPCI index for year 2013. Chemical engineering, 123, 92.
De Figueiredo, M.F., Guedes, B.P., de Araújo, J.M.M., Vasconcelos, L.G.S., Brito, R.P., 2011. Optimal design of extractive distillation columns—a systematic procedure using a process simulator. Chem. Eng. Res. Des. 89, 341–346.
De Figueiredo, M.F., Brito, K.D., Ramos, W.B., Vasconcelos, L.G.S., Brito, R.P., 2015a. Effect of solvent content on the separation and the energy consumption of extractive distillation columns. Chem. Eng. Commun. 202, 1191–1199.
De Figueiredo, M.F., Brito, K.D., Ramos, W.B., Vasconcelos, L.G.S., Brito, R.P., 2015b. Optimization of the design and operation of extractive distillation processes. Sep. Sci. Tech. 50, 2238–2247.
Doherty, M.F., Knapp, J.P., 1993. Distillation, azeotropic, and extractive. Kirk-Othmer Encycl. Chem. Technol.
Douglas, J.M., 1988. Conceptual Design of Chemical Processes. McGraw-Hill, New York.
García-Herreros, P., Gómez, J.M., Gil, I.D., Rodriguez, G., 2011. Optimization of the design and operation of an extractive distillation system for the production of fuel grade ethanol using glycerol as entrainer. Ind. Eng. Chem. Res. 50, 3977– 3985.
Gerbaud, V., Rodriguez-Donis, I., 2014. Chapter 6. Extractive distillation. In: Gorak, A., Olujic, Z. (Eds.), Distillation: Equipment and Processes. Elsevier, Oxford, GB, pp. 201–246.
Gomez, A., Pibouleau, L., Azzaro-Pantel, C., Domenech, S., Latge, C., Haubensack, D., 2010. Multiobjective genetic algorithm strategies for electricity production from generation IV nuclear technology. Energy Convers. Manage. 51, 859–871.
Huang, K., Shan, L., Zhu, Q., Qian, J., 2008. Adding rectifying/stripping section type heat integration to a pressure-swing distillation (PSD) process. Appl. Therm. Eng. 28, 923–932.
Knapp, J.P., Doherty, M.F., 1994. Minimum entrainer flows for extractive distillation: A bifurcation theoretic approach. AIChE J. 40, 243–268.
Kossack, S., Kraemer, K., Gani, R., Marquardt, W., 2008. A systematic synthesis framework for extractive distillation processes. Chem. Eng. Res. Des. 86, 781– 792.
Leboreiro, J., Acevedo, J., 2004. Processes synthesis and design of distillation sequences using modular simulators: a genetic algorithm framework. Comput. Chem. Eng. 28, 1223–1236.
Li, L., Guo, L., Tu, Y., Yu, N., Sun, L., Tian, Y., Li, S., 2017. Comparison of different extractive distillation processes for 2-methoxyethanol/toluene separation: Design and control. Comput. Chem. Eng. 99, 117–134.
Liang, K., Li, W., Luo, H., Xia, M., Xu, C., 2014. Energy-efficient extractive distillation process by combining preconcentration column and entrainer recovery column. Ind. Eng. Chem. Res. 53, 7121–7131.
Luyben, W.L., 2012. Pressure-swing distillation for minimum-and maximum-boiling homogeneous azeotropes. Ind. Eng. Chem. Res. 51, 10881–10886.
Luyben, W.L., Chien, I.L., 2011. Design and Control of Distillation Systems for Separating Azeotropes. John Wiley & Sons.
Luyben, W.L., 2016. Distillation column pressure selection. Sep. Pur. Tech. 168, 62– 67.
Mahdi, T., Ahmad, A., Nasef, M.M., Ripin, A., 2015. State-of-the-art technologies for separation of azeotropic mixtures. Sep. Purif. Rev. 44, 308–330.
Ortiz, P.S., Oliveira, S., 2014. Exergy analysis of pretreatment processes of bioethanol production based on sugarcane bagasse. Energy 76, 130–138.
Table B (continued)
Column Case 1 Case 2 Case 3
C0 C1 C2 C0 C1 C2 C0 C1 C2 IHE/106$ 0.240 0.470 0.146 0.251 0.508 0.151 0.312 0.312 0.251 Costcap/106$ 0.405 0.918 0.297 0.420 0.999 0.304 0.422 0.764 0.359 Costope/106$ 0.422 0.400 0.287 0.443 0.447 0.296 0.345 0.328 0.209 CostCA/106$ 0.557 0.705 0.386 0.583 0.78 0.397 0.486 0.583 0.328 QHA/MW 1.067 1.074 0.487 CostHA/106$ 0.021 0.021 0.013 TAC/106$ 1.669 1.781 1.410
Column Case 4 Case 5 Case 6
C0 C1 C2 C0 C1 C2 C0 C1 C2 Diameter/m 1.123 1.249 1.020 1.123 1.643 0.983 1.145 1.640 0.977 Height/m 5.49 36.58 6.10 11.59 46.94 11.59 17.07 47.55 17.07 ICS/106$ 0.101 0.516 0.099 0.183 0.844 0.159 0.256 0.851 0.216 AC/m2 126 94 23 126 161 26 132 160 28 AR/m2 34 61 90 37 119 133 40 224 198 IHE/106$ 0.312 0.318 0.246 0.316 0.466 0.304 0.328 0.574 0.374 Costcap/106$ 0.422 0.907 0.354 0.519 1.455 0.479 0.613 1.570 0.613 Costope/106$ 0.345 0.327 0.200 0.351 0.536 0.231 0.369 0.633 0.267 CostCA/106$ 0.486 0.629 0.318 0.524 1.020 0.390 0.574 1.157 0.471 QHA/MW 0.472 0.58 1.199 CostHA/106$ 0.012 0.014 0.024 TAC/106$ 1.445 1.948 2.226 Table C
Minimum GEC and TAC, maximum Eextand eextat different generations.
Number of generation Statement GEC (kJ/kmol) TAC (106$) E
ext eext
0 Generating randomly the population (400) 5 No design satisfies the constraints
25 7 designs in Pareto front 220,972 1.890 0.336 0.0066
50 45 designs in Pareto front 178,683 1.741 0.432 0.0165
100 152 designs in Pareto front 163,185 1.568 0.511 0.0269
200 355 designs in Pareto front 159,458 1.472 0.552 0.0277
270 400 designs in Pareto front 157,897 1.440 0.553 0.0281
400 400 designs in Pareto front 156749 1.413 0.553 0.0281
450 400 designs in Pareto front 156,628 1.410 0.553 0.0281
Petlyuk, F., Danilov, R., Burger, J., 2015. A novel method for the search and identification of feasible splits of extractive distillations in ternary mixtures. Chem. Eng. Res. Des. 99, 132–148.
Rangaiah, G.P., 2009. Multi-Objective Optimization: Techniques and Applications in Chemical Engineering. World scientific.
Rangaiah, G.P., Bonilla-Petriciolet, A., 2013. Multi-Objective Optimization in Chemical Engineering: Developments and Applications. John Wiley & Sons.
Rangaiah, G.P., Sharma, S., Sreepathi, B.K., 2015. Multi-objective optimization for the design and operation of energy efficient chemical processes and power generation. Curr. Opin. Chem. Eng. 10, 49–62.
Repke, J.U., Forner, F., Klein, A., 2005. Separation of homogeneous azeotropic mixtures by pressure swing distillation–analysis of the operation performance. Chem. Eng. Technol. 28, 1151–1157.
Rodriguez-Donis, I., Gerbaud, V., Joulia, X., 2009. Thermodynamic insights on the feasibility of homogeneous batch extractive distillation, 1. Azeotropic mixtures with a heavy entrainer. Ind. Eng. Chem. Res. 48, 3544–3559.
Rodriguez-Donis, I., Gerbaud, V., Joulia, X., 2011. Thermodynamic insights on the feasibility of homogeneous batch extractive distillation. 3. Azeotropic mixtures with light entrainer. Ind. Chem. Eng. Res. 51, 4643–4660.
You, X., Rodriguez-Donis, I., Gerbaud, V., 2015a. Improved design and efficiency of the extractive distillation process for acetone–methanol with water. Ind. Eng. Chem. Res. 54, 491–501.
You, X., Rodriguez-Donis, I., Gerbaud, V., 2015b. Investigation of separation efficiency indicator for the optimization of the acetone–methanol extractive distillation with water. Ind. Eng. Chem. Res. 54, 10863–10875.
You, X., Rodriguez-Donis, I., Gerbaud, V., 2016a. Reducing process cost and CO2
emissions for extractive distillation by double-effect heat integration and mechanical heat pump. Appl. Energy 166, 128–140.
You, X., Rodriguez-Donis, I., Gerbaud, V., 2016b. Low pressure design for reducing energy cost of extractive distillation for separating diisopropyl ether and isopropyl alcohol. Chem. Eng. Res. Des. 109, 540–552.
Zhu, Z., Wang, L., Ma, Y., Wang, W., Wang, Y., 2015. Separating an azeotropic mixture of toluene and ethanol via heat integration pressure swing distillation. Comput. Chem. Eng. 76, 137–149.