HAL Id: hal-02870979
https://hal.archives-ouvertes.fr/hal-02870979
Submitted on 17 Jun 2020HAL is a multi-disciplinary open access archive for the deposit and dissemination of sci-entific research documents, whether they are pub-lished or not. The documents may come from teaching and research institutions in France or abroad, or from public or private research centers.
L’archive ouverte pluridisciplinaire HAL, est destinée au dépôt et à la diffusion de documents scientifiques de niveau recherche, publiés ou non, émanant des établissements d’enseignement et de recherche français ou étrangers, des laboratoires publics ou privés.
Comparison of solidification kinetics of compacted and
lamellar cast irons
J. Lacaze, U de la Torre, J Sertucha, A Regordosa
To cite this version:
J. Lacaze, U de la Torre, J Sertucha, A Regordosa. Comparison of solidification kinetics of compacted and lamellar cast irons. IOP Conference Series: Materials Science and Engineering, IOP Publishing, 2020, 861, pp.012050. �10.1088/1757-899X/861/1/012050�. �hal-02870979�
Comparison of solidification kinetics
of compacted and lamellar cast irons
J Lacaze1, U de la Torre2, J Sertucha2, A Regordosa2 1. CIRIMAT, Université de Toulouse, France
2. Fundación AZTERLAN, Durango, Spain jacques.lacaze@ensiacet.fr
Abstract. Thermal analysis is largely used in cast-iron foundry shops as a means to check melt preparation before casting. It has been suggested that the shape of the cooling curves could be related to graphite form, either spheroidal, lamellar or else compacted. The present work is part of a larger study intended to improve melt control for compacted graphite castings by using controlled additions of sulphur and magnesium. Experiments showing lamellar graphite and their counterpart with compacted graphite have been selected for analysis and simulation of the thermal analysis records. Simulation makes use of the fact that compacted graphite differs from lamellar graphite by the limitation of graphite branching in the former. Solidification of both types of irons may thus be simulated using the same basic growth law for irregular eutectics, though changing the parameters describing the branching capability of the faceted graphite phase. The increase of the undercooling of the eutectic plateau during solidification of compacted cast iron when compared to that of lamellar cast iron could be verified and reproduced by simulation. The limitations of the present approach which assumes the temperature in thermal cups is homogeneous at any time are also pointed out.
1. Introduction
Compacted graphite irons (CGI) have been used since the 1960s [1] but are now breaking markets previously occupied by lamellar graphite irons. The most usual way of preparing CGI consists to under-treat a melt with usual spheroidizing elements, namely magnesium and rare earths [1]. However, the range of residual spheroidizing elements for getting the proper microstructure is quite limited and highly sensitive to casting conditions. Amongst the process parameters that greatly affect graphite shape are the cooling rate and inoculation. It may be worth noting that Subramanian et al. [2] suggested it should be much easier to control graphite shape by addition of cerium rather than of magnesium for spheroidizing but this does not appear to be applied. Other means have been looked for such as balancing spheroidizing elements with addition of sulfur. In this line, Bazdar et al. [3] investigated the transition from SG to CG and then LG by adding sulfur to a melt containing quite a high level of magnesium at 0.057 wt.%. The graphite shape was characterized by the aspect ratio, i.e. graphite length/graphite width, and it was found that compacted graphite prevails in a large range of sulfur content.
An extensive study was carried out to investigate the coupled effect of magnesium and sulfur levels, inoculation and cooling rate. Out of the whole series of experiments, samples with lamellar graphite were sometimes obtained. Some of the experiments were thus selected as an experimental basis for checking the growth process of compacted graphite as compared to lamellar graphite. Indeed, it has been previously suggested [4,5] that compacted graphite cells grow as lamellar graphite cells but
with a limited capability of graphite for branching, leading to the coarser structure seen in metallographic sections of CGI when compared to LGI. An approach based on the model developed by Jones and Kurz [6] to describe LGI solidification was thus considered. The present work compares predictions for lamellar and compacted graphite irons to experimental cooling curves recorded during standard thermal analysis.
2. Experimental details
All melts were prepared in a medium frequency induction furnace (250 Hz, 100 kW) 100 kg in capacity from metallic charges composed of low-alloyed steel scrap and low alloyed ferritic cast iron returns. These charges also contained high purity graphite (C > 99.0 wt.%), a FeSi alloy (wt.%, Si = 74.0, C = 0.15, Al = 1.06 and balance Fe) and extra pure sulphur powder. Once melting process was completed, the composition of the batches was checked and carbon, silicon and sulphur contents were then adjusted according to the required targets. After this adjustment stage, about 50 kg of melt was transferred from the furnace to a 60 kg capacity ladle at a temperature between 1500ºC and 1510ºC. The nodularization treatment was carried out following the sandwich method by adding a commercial FeSiMg alloy (wt.%, Mg = 6.3, RE = 1.01, Si = 45.5, Ca = 0.97, Al = 0.97 and balance Fe). The nodularizer was added in the reaction chamber at an amount of 0.35-0.40 % of the total weight of the treated melt and it was then properly covered with steel scrap. Once the nodularizing reaction finished, a sample (medal) was taken out for determining the chemical composition of the batch.
The melts were then cast in standard thermal analysis (TA) cups which were empty or contained inoculant and/or some other addition as sulphur powder. For the present report, samples from four melts were selected which were all without inoculant. Also, they were without sulphur addition and labelled not-inoc, or with either 0.005 wt.% (12.5 mg) or 0.010 wt.% (25 mg) sulphur and labelled +0.005% S or +0.010% S, respectively. These sulphur additions were made to form lamellar graphite particles by decreasing the free magnesium content of the liquid poured in the cups. The cooling curves obtained from these samples were recorded using the Thermolan® software.
Carbon and sulphur contents were determined on medals by using combustion analysis (LECO CS300) while spark spectrometry was used for the other elements (SPECTRO LAB). The chemical analysis of the four selected alloys is listed in table 1 in which the sulphur additions performed on the TA cups have not been considered. Table 1 also contains the carbon equivalent CE and the temperature of the stable eutectic TEUT, in Celsius, which were calculated using the following formulas [7]:
CE = wC + 0.28·wSi + 0.007·wMn + 0.303·wP (1)
TEUT = 1154.02 + 4.246·wSi 5.00·wMn (2)
where wi is the content of the alloy in element i (wt.%). It is seen that the CE values are either slightly lower or slightly higher than 4.34 wt.%, meaning the alloys are either hypo- or hyper-eutectic.
Table 1. Composition of the selected alloys (wt.%), carbon equivalent, CE, and temperature of the stable eutectic, TEUT.
Trial C Si Mn P S Ti Mg CE TEUT (°C)
4.1 3.64 2.39 0.15 0.012 0.018 <0.010 0.011 4.31 1163.4 8.1 3.73 2.43 0.16 0.021 0.014 <0.010 0.021 4.42 1163.5 9.1 3.68 2.40 0.15 0.013 0.015 <0.010 0.016 4.36 1163.5 9.2 3.73 2.38 0.15 0.012 0.016 <0.010 0.012 4.40 1163.4
Metallographic inspections were performed on samples taken out from the geometrical centre of the TA cups, i.e. close to the thermocouple junction, and their surface was properly polished. Micrographs at 100x magnification of three different fields were obtained from each sample and the shape of the graphite particles was then evaluated by determining the relative area fraction of class III graphite which is related to compacted shape, fIII_A.
3. Experimental results
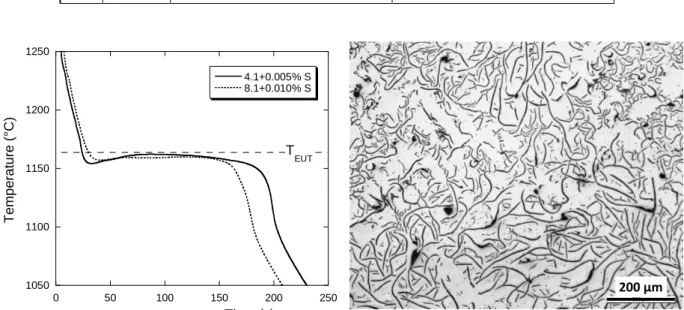
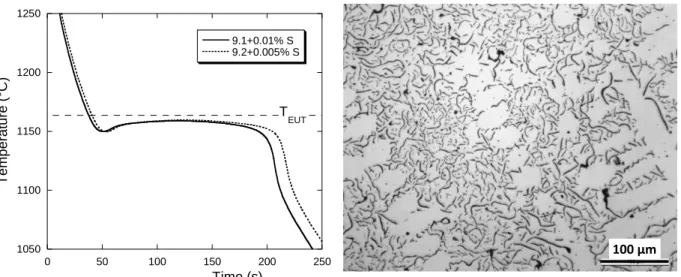
Table 2 summarizes the observations made on the samples obtained from the 4 alloys, and figures 1, 2 and 3 present the cooling curves and typical microstructures. Lamellar graphite was obtained by addition in the quick cup of 0.005 wt.% sulfur to alloy 4.1 and 0.01 wt.% to alloy 8.1, see figure 1. In both alloys, part of the lamellar graphite was of the undercooled type D. Note in the micrograph of figure 1 the presence of ex-austenite dendrites. Alloy 9.1 with 0.01 wt.% of sulfur addition in the quick cup and alloy 9.2 with 0.005 wt.% sulfur showed a lamellar graphite type D, see figure 2. Here also, ex-austenite dendrites are observed. All other five alloys showed compacted graphite at a level varying between 40% and 68%, the remaining being spheroidal graphite. Three of the five cooling curves are shown in figure 3 together with a typical microstructure.
As expected, the cooling curves for samples showing undercooled graphite present a eutectic plateau at lower temperature than those with lamellar graphite. On the contrary, comparing the graphite distribution in figures 1 and 3 confirms that compacted graphite is much coarser than lamellar graphite when solidified in the same casting conditions, even though it grows at a higher undercooling. A more detailed analysis of the curves is provided later when comparing calculated to experimental records.
Table 2. Microstructure observed for all studied samples.
Trial not-inoc +0.005% S +0.010% S
4.1 65% CG 40% lamellar graphite type A 60% lamellar graphite type D
8.1 59% CG 68% CG 30% lamellar graphite type D 70% Lamellar graphite type A
9.1 56% CG 51% CG Mostly lamellar graphite type D
9.2 40% CG Mostly lamellar graphite type D
Figure 1. Cooling curves for samples showing lamellar graphite and typical microstructure.
1050 1100 1150 1200 1250 0 50 100 150 200 250 4.1+0.005% S 8.1+0.010% S Tempe ra ture (° C) Time (s) T EUT 200 µm
Figure 2. Cooling curves for samples showing undercooled graphite and typical microstructure.
Figure 3. Cooling curves for samples showing compacted graphite and typical microstructure. 4. Simulation approach
Solidification of cast irons is quantitatively described by writing the appropriate mass balances following the work by Lesoult et al. [8] on spheroidal graphite cast irons. The whole details of the present model will be presented elsewhere. For describing the eutectic reaction in the present study, spheroidal graphite eutectic cells are replaced by lamellar or compacted graphite cells of radius R whose growth law is written according to Jones and Kurz [6] as:
b a 1 T dt dR 2 2 (3)in which t is time, T is the undercooling expressed with respect to the equilibrium eutectic
temperature, TEUT, a and b are constants evaluated by Jones and Kurz as a=2.3 µm·K and b=0.080 K·s·µm-2, and characterizes the capability of the faceted graphite phase to branch.
For an ideal regular eutectic between two non-faceted phases, should be 1, while it has been proposed it is 2.5 for Fe-C graphite/austenite eutectic [9]. Jones and Kurz could reproduce their
1050 1100 1150 1200 1250 0 50 100 150 200 250 9.1+0.01% S 9.2+0.005% S Tempera ture (° C) Time (s) T EUT 100 µm 1050 1100 1150 1200 1250 0 50 100 150 200 250 8.1 not-inoc 8.1+0.005% S 9.1 not-ino Te m p e rat u re (° C ) Time (s) T EUT 200 µm
experimental results of directional solidification of lamellar graphite iron with set to 3.9 while Zou Jie [10] found a value of 6.5 for equiaxed solidification of an Fe-C-Si alloy. Zou Jie suggested that part of the difference with directional solidification is due to the expanding nature of the eutectic cells in equiaxed solidification, and one may even think of a value of changing during growth in this case. In the case of CG cells, the protuberances that form on the primary graphite precipitates then develop without much branching. Thus, the distance between them increases as the size of the CG cells increases. This suggested writing =0+R/R
GE, where RGE is the initial size of the cell, and to limit the increase of to some maximum value lower than 10 at which branching of graphite lamellae is anyway expected because of the high undercooling developed between the lamellas.
After primary deposition of austenite in the case of a hypo-eutectic alloy, a volume density of NV eutectic cells were nucleated when TEUT was reached. During eutectic solidification, off-eutectic austenite may continue to grow as during primary deposition or may dissolve in order for the solidification path to stick to the extrapolation of the austenite liquidus. In the case of hyper-eutectic alloys, the solidification path during primary deposition was calculated assuming spheroidal graphite precipitates following a nucleation law given as NV=A1·(TLG) mm-3, where TLG is the undercooling with respect to the graphite liquidus [8]. When the extrapolation of the austenite liquidus is reached, the number of graphite particles is set constant at the value which has been reached. An equivalent diameter of the graphite particles is calculated which is then used as initial size for the compacted graphite cells, RGE. Solidification proceeds further as in the case of hypo-eutectic alloys, with possible growth and dissolution of off-eutectic austenite together with growth of eutectic cells.
The solidification process of the thermal cups was described assuming their temperature is homogeneous at any time during the cooling process. For each time step of calculation, the calculated change of the solid fraction, VS, was thus introduced in the following heat balance:
0
0.5 S p T T t dt dV H dt dT C A / V (4)where and Cp are, respectively, the density and the heat capacity of the metal at temperature T,
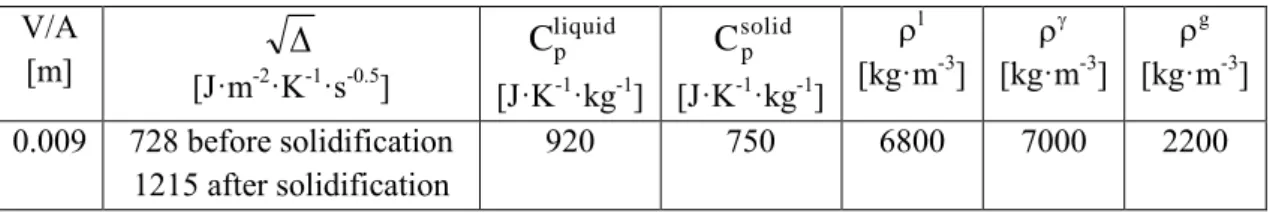
H is the latent heat of fusion of the metal, is a quantity characteristic of the mould and T0 is the ambient temperature. V is the volume of metal having an outer surface A, and V/A is the so-called casting modulus. All data used in the present calculations are listed in table 3. During solidification, the specific heat Cp and the density were calculated as a weighted average of the solid and liquid values.
Table 3. Values of the parameters that were used for calculations. V/A [m] [J·m-2·K
-1·s-0.5] liquid pC
[J·K-1·kg-1] solid pC
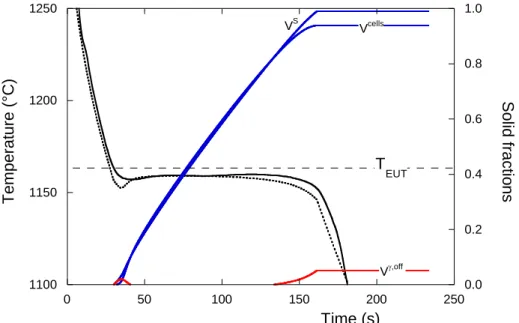
[J·K-1·kg-1] l [kg·m-3] [kg·m-3] g [kg·m-3] 0.009 728 before solidification 1215 after solidification 920 750 6800 7000 2200 5. Simulation resultsIt has been recently observed that soon after the nodularizing treatment, not inoculated alloys behave much alike inoculated ones [11]. This suggests that this treatment leads to the precipitation of magnesium oxides or sulfides that serve as graphite nuclei. Accordingly, the number of eutectic cells was set at the same value for all alloys at the start of the eutectic reaction. To determine this value, preliminary calculations were performed on sample 8.1+0.01%S with set constant at the value of 2.5 which was expected to apply for lamellar graphite. Figure 4 compares the experimental and calculated curves for NV finally set to 2585 mm-3. It is seen that the predicted and experimental eutectic
undercoolings are the same during most of the plateau, and this NV value was then used for all calculations.
On the graph in figure 4 are also plotted the evolution of the fraction of off-eutectic austenite, of eutectic cells and of the whole solid. It is seen that off-eutectic austenite forms at the beginning of the eutectic reaction, but then dissolves to reappear when the temperature decreases at the end of the eutectic plateau. On the whole, this simulation appears thus quite satisfactory but it is noticeable that the predicted maximum undercooling at the beginning of the eutectic reaction is much larger than the experimental one, this is further discussed below.
Figure 4. Comparison of the experimental (solid line) and calculated (dotted line) cooling curves for alloy 8.1+0.01%S. The predicted evolution of the fraction of off-eutectic austenite, Voff, lamellar
graphite cells, Vcells
, and total solid, VS, is also shown.
Figure 5 compares the calculated and experimental curves for samples 8.1 with lamellar and compacted graphite. For this latter, was varied from 2.5 to a maximum value of 7.5 which was found appropriate for retrieving the undercooling during the eutectic plateau. It is thus seen that even with a relatively high number of eutectic cells, their growth law may significantly affect the predicted eutectic plateau undercooling. However, the main difference between calculated and experimental curves for compacted graphite eutectic (sample 8.1+0.005% S) appears at the beginning of the bulk solidification where it is seen experimentally a short plateau while a deep undercooling is predicted. Nevertheless, it is noticed that the predicted recalescence is in quite good agreement with the measured one.
Finally, figure 6 compares the calculated cooling curve to the experimental one for sample 4.1 not-inoc which is very slightly hypo-eutectic. The origin of the discrepancy at the beginning of the eutectic reaction is then made evident. While austenite is predicted to precipitate as soon as the austenite liquidus temperature is reached, the corresponding thermal arrest is shifted by about 15°C on the experimental record. This undercooling has sometimes been simulated by assuming it is due to a nucleation barrier for austenite [12]. However, thermal cups are quite small castings and it is expected austenite nucleates at the wall of the cup and grows inwards in a columnar way. Accordingly, an alternative possibility is that the shift in the thermal arrest corresponds to the delay needed by the dendrites formed at the surface of the sample to reach the thermocouple located in the middle of the thermal cup. This would agree with the fact that this arrest is not associated with recalescence. When
1100 1150 1200 1250 0.0 0.2 0.4 0.6 0.8 1.0 0 50 100 150 200 250 Tempe ra ture (° C) So lid fr a ct io ns Time (s) Vcells VS V,off T EUT
the thermal arrest associated to austenite growth reaches the center of the cup, the cooling rate decreases giving more time to the eutectic cells to grow, hence the lower maximum undercooling experienced by the material upon the start of the eutectic reaction.
Figure 5. Comparison of calculated and experimental curves for alloy 8.1 with lamellar (LG) and compacted (CG) graphite. Experimental and calculated curves are in solid and dotted lines
respectively.
Figure 6. Comparison of calculated and experimental curves for alloy 4.1-not-inoc with compacted graphite. Experimental and calculated curves are in solid and dotted lines respectively. 6. Conclusion
Focusing on comparing lamellar and compacted graphite, it has been shown that it is possible to reproduce the change in eutectic plateau undercooling by simply considering the associated difference in branching capability of graphite during eutectic cell growth. It was also noticed that the predicted recalescence for compacted graphite is well reproduced.
1050 1100 1150 1200 1250 0 50 100 150 200 250 8.1+0.005%S 8.1+0.01%S T empera ture (° C) Time (s) T EUT CG LG 1050 1100 1150 1200 1250 0 50 100 150 200 250 T e mpe ratu re (° C ) Time (s) T EUT
Improvement of the present work could be achieved by accounting properly of the temperature distribution in the thermal cups during solidification instead of considering their temperature is homogeneous. This would certainly allow a better description of the cooling curves when austenite precipitation starts being sensed by the thermocouple. Also, no distinction was made in the modelling approach between flake and undercooled graphite while describing the transition from one to the other would certainly be of interest.
References
[1] Nechtelberger E, Puhr H, Nesselrode J B and Nakayasu A 1982 Cast iron with
vermicular/compacted graphite – State of the art. Development, production, properties, applications, Proc. Int. Foundry Congress, CIATF (Chicago) p 1-37
[2] Subramanian S V, Kay D A R and Purdy G R 1982 Compacetd graphite morphology control
AFS Trans. 90 589-603
[3] Bazdar M, Abbasi H R, Yaghtin A H and Rassizadehghani J 2009 Effect of sulfur on graphite aspect ratio and tensile properties in compacted graphite irons J. Mater. Proc. Tech. 209 1701-1705
[4] Lacaze J and Sertucha J 2018 Some paradoxical observations about spheroidal graphite degeneracy China Foundry 15 457-463
[5] Lacaze J, Connétable D and Castro de Roman M J 2019Effects of impurities on graphite shape during solidification of spheroidal graphite cast ions Materialia 8 100471
[6] Jones H and Kurz W 1981 Relation of interphase spacing and growth temperature to growth velocity in Fe-C and Fe-Fe3C eutectic alloys Z. Metallknde 72 792-797
[7] Castro M, Herrera M, Cisneros M M, Lesoult G and Lacaze J 1999 Simulation of thermal analysis applied to the description of the solidification of hypereutectic SG cast irons, Int. J.
Cast Metals Research 11 369-374
[8] Lesoult G, Castro de Roman M J and Lacaze J 1998 Solidification of spheroidal graphite cast irons – I. Physical modelling Acta Mater. 46 983-995
[9] Trivedi R and Kurz W 1988 Microstructure selection in eutectic binary systems, in
Solidification Processing of Eutectic alloys, Ed. D.M. Stefanescu, G.J. Abbaschian and R.J.
Bayuzick, The Metallurgical Society, pp. 3-34
[10] Zou Jie 1989 Simulation de la solidification eutectique, PhD thesis #774, EPFL
[11] Regordosa A, de la Torre U, Loizaga A, Sertucha J and Lacaze J Microstructure changes during solidification of cast irons - Effect of chemical composition and inoculation on competitive spheroidal and compacted graphite growth International Journal of Metalcasting, DOI : 10.1007/s40962-019-00389-y
[12] Suli Chang, Dongkai Shangguan and Stefanescu D M 1992 Modeling of the liquid/solid and the eutectoid phase transformations in spheroidal graphite cast iron Metall. Trans. A 23 1333-1346