HAL Id: hal-01851616
https://hal.archives-ouvertes.fr/hal-01851616
Submitted on 30 Jul 2018HAL is a multi-disciplinary open access archive for the deposit and dissemination of sci-entific research documents, whether they are pub-lished or not. The documents may come from teaching and research institutions in France or abroad, or from public or private research centers.
L’archive ouverte pluridisciplinaire HAL, est destinée au dépôt et à la diffusion de documents scientifiques de niveau recherche, publiés ou non, émanant des établissements d’enseignement et de recherche français ou étrangers, des laboratoires publics ou privés.
Evolution of gene dosage on the Z-chromosome of
schistosome parasites
Marion Picard, Celine Cosseau, Sabrina Ferré, Quack Thomas, C. Grevelding,
Yohann Coute, Beatriz Vicoso
To cite this version:
Marion Picard, Celine Cosseau, Sabrina Ferré, Quack Thomas, C. Grevelding, et al.. Evolution of gene dosage on the Z-chromosome of schistosome parasites. eLife, eLife Sciences Publication, 2018, 7, pp.e35684. �10.7554/eLife.35684�. �hal-01851616�
Full title: Evolution of gene dosage on the Z-chromosome of schistosome parasites 1
2
Short title: Dosage compensation evolution in schistosomes. 3
4
Keywords: Sex chromosome evolution, dosage compensation, Ohno’s hypothesis, female 5
heterogamety, schistosomes 6
7
Authors: Marion A. L. Picard1, Céline Cosseau2, Sabrina Ferré3, Quack Thomas4, Christoph G. 8
Grevelding4, Yohann Couté3, Beatriz Vicoso1,o 9
10
Author information: 11
1 Institute of Science and Technology Austria, Am Campus 1, 3400 Klosterneuburg, Austria 12
2 Université de Perpignan Via Domitia, IHPE UMR 5244, CNRS, IFREMER, Université de 13
Montpellier, F-66860 Perpignan, France. 14
3 Univ. Grenoble Alpes, CEA, Inserm, BIG-BGE, 38000 Grenoble, France 15
4 Institute for Parasitology, BFS, Justus-Liebig-University, 35392 Giessen, Germany. 16
°Corresponding author: beatriz.vicoso@ist.ac.at 17
18 19
Abstract: 20
XY systems usually show chromosome-wide compensation of X-linked genes, while in many 21
ZW systems, compensation is restricted to a minority of dosage sensitive genes. Why such 22
differences arose is still unclear. Here, we combine comparative genomics, transcriptomics and 23
proteomics to obtain a complete overview of the evolution of gene dosage on the Z-24
chromosome of Schistosoma parasites. We compare the Z-chromosome gene content of 25
African (Schistosoma mansoni and S. haematobium) and Asian (S. japonicum) schistosomes, 26
and describe lineage-specific evolutionary strata. We use these to assess gene expression 27
evolution following sex-linkage. The resulting patterns suggest a reduction in expression of Z-28
linked genes in females, combined with up-regulation of the Z in both sexes, in line with the first 29
step of Ohno's classic model of dosage compensation evolution. Quantitative proteomics 30
suggest that post-transcriptional mechanisms do not play a major role in balancing the 31
expression of Z-linked genes. 32
Introduction 33
In species with separate sexes, genetic sex determination is often present in the form of 34
differentiated sex chromosomes (1). A sex-specific chromosome can be carried by the male 35
(such as the Y of mammals and fruit flies, in male heterogamety) or by the female (such as the 36
W of birds, in female heterogamety). These sex chromosomes originally arise from pairs of 37
autosomes, which stop recombining after they acquire a sex-determining region (2,3). The loss 38
of recombination between X/Z and Y/W chromosomes is likely driven by selective pressures to 39
link the sex-determining gene and alleles with sexually antagonistic effects, and often occurs 40
through inversions on the sex-specific chromosome (4,5). The inverted Y/W-linked region stops 41
recombining entirely, which hampers the efficacy of selection and leads to its genetic 42
degeneration (3,6). The appearance of further sexually antagonistic mutations can restart the 43
process and select for new non-recombining regions, creating sex chromosome "strata" of 44
different ages (7–10). Eventually, this suppression of recombination can extend to most of the 45
chromosome, leading to gene-poor, mostly heterochromatic sex chromosomes such as the Y 46
chromosome of mammals (11). 47
The loss of one gene copy on the Y/W is predicted to result in a two-fold reduction of expression 48
in the heterogametic sex, as gene expression is correlated to gene copy number (12). This can 49
cause imbalances in gene networks composed of both X/Z-linked and autosomal genes (13). 50
Such imbalances can drive the appearance of dosage compensation mechanisms, which target 51
X/Z chromosomes and regulate their expression to restore optimal dosage (14,15). While X/Z 52
upregulation in the heterogametic sex is required to re-establish balanced levels of expression, 53
global downregulation in the homogametic sex is also observed (e.g. X-inactivation in 54
mammals). Ohno suggested a two-step mechanism, in which the initial upregulation of 55
expression is not sex-specific. This leads to an excess of dosage in the homogametic sex, and 56
secondarily selects for further repressing mechanisms (“Ohno’s hypothesis” of dosage 57
compensation, (14)). How relevant this model is to the evolution of mammalian dosage 58
compensation is still under debate (e.g. 16,18,19,21,22). Independent of the underlying 59
mechanisms, balanced gene expression between males and females in species with 60
differentiated sex chromosomes was used as diagnostic of a chromosome-wide (also referred to 61
as “global”, or “complete”) mechanism of dosage compensation in many different clades (21– 62
23). 63
In ZW systems, the loss of genes on the sex-specific W chromosome is generally accompanied 64
by unequal expression levels of the Z-chromosome between ZZ males and ZW females, as well 65
as reduced expression of the Z relative to the autosomes in females. This has generally been 66
interpreted as a lack of chromosome-wide dosage compensation (also referred to as “partial”, or 67
“incomplete”), with individual dosage-sensitive genes being independently regulated instead. 68
Incomplete dosage compensation was described in a wide range of species, including birds 69
(24–27), fishes (28) and snakes (9). So far, Lepidoptera are the only exception to this 70
observation (23,29). Why many ZW systems should fail to acquire a global mechanism of 71
dosage compensation is not entirely clear, though several and non-mutually exclusive 72
hypotheses have been put forward (see Discussion, and Gu and Walters (16) for a review). 73
Another possibility is that the male-bias of the Z is instead caused by an accumulation of genes 74
with male functions due to the male-biased transmission of the Z, which may favor the fixation of 75
sexually antagonistic male-beneficial mutations on this chromosome. 76
While the direct comparison of male and female expression of X/Z-linked and autosomal genes 77
has provided an overview of dosage compensation in many clades, it suffers from several 78
drawbacks (23). First, chromosome-wide dosage compensation can lead to strongly sex-biased 79
expression, if only the initial up-regulation of expression in both sexes has occurred (but not the 80
secondary down-regulation of the Ohno hypothesis (14)). This has been suggested for the flour 81
beetle (30) and for the young sex chromosomes of the threespine sticklebacks (31). Biases in 82
expression levels between sexes and/or chromosomes may also have been present ancestrally, 83
before the present sex-chromosomes evolved, and using a proxy for ancestral expression can 84
yield insights into the direct consequences of sex-linkage (17,32,33). Finally, the vast majority of 85
studies relied only on microarray or RNA-seq data and did not consider any post-transcriptional 86
regulation that might affect gene dosage at the protein level, but not at the transcript level 87
(whereas protein dosage is in most cases the functionally relevant measure). For instance, a 88
proteomic analysis in birds found that several genes appeared to be partially equalized at the 89
protein level despite being strongly male-biased at the transcript level (34). In humans, post-90
transcriptional regulation does not appear to play a major role in dosage compensation (35). 91
Here we combine comparative genomics, transcriptomics and quantitative proteomics to obtain 92
a complete overview of the evolution of gene dosage on the Z-chromosome of parasites of the 93
genus Schistosoma. Schistosomes are a group of blood parasites that can cause 94
schistosomiasis in humans (36). Their complex life cycle is characterized by a phase of clonal 95
multiplication in an intermediate mollusk host, and a phase of sexual reproduction in the final 96
warm-blooded host. Unlike the other 20,000 species of hermaphroditic platyhelminths, 97
schistosomes have separate sexes: sexual reproduction occurs immediately after the male and 98
female primary development in their definitive host, and mating is compulsory for the sexual 99
maturation of females (37,38). Sex determination is genetic, and relies on a pair of 100
cytogenetically well-differentiated ZW chromosomes (39). All schistosomes are thought to share 101
the same ancestral pair of ZW sex chromosomes, but differences in their morphology and in the 102
extent of heterochromatization of the W suggest that different strata were acquired 103
independently by different lineages (39,40). 104
The model blood fluke Schistosoma mansoni was one of the first ZW clades to be evaluated for 105
the presence of global dosage compensation, through the comparison of male and female 106
microarray data derived from several tissues (41). It showed reduced expression of Z-linked 107
genes in females relative (i) to the autosomes and (ii) to males, consistent with a lack of 108
chromosome-wide dosage compensation. Interestingly, the reduction of Z-expression in females 109
was less than two-fold, and the Z:autosome ratio of expression was slightly, but consistently, 110
greater than one in males. Our combined genomic, transcriptomic, and proteomic approaches 111
allow us to fully probe the evolution of the male-biased expression of the Z, and suggests a 112
more complex scenario than previously proposed. We discuss this in light of the different 113
hypotheses put forward to account for the evolution of gene dosage on Z chromosomes. 114
115
RESULTS 116
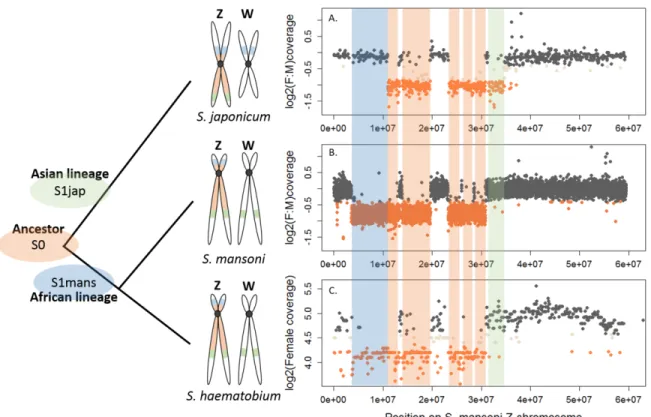
1. Genomic differentiation of ZW sex chromosomes in Asian and African lineages. 117
The difference in morphology of the ZW pair in African and Asian schistosomes suggests that 118
the two lineages may differ in their gene content (39). We compared the gene content of the Z-119
chromosomes of three different species: S. mansoni and Schistosoma haematobium, which 120
belong to African schistosomes, and Schistosoma japonicum, an Asian schistosome (Figure 1). 121
We first identified syntenic blocks between the S. mansoni genome and the S. haematobium 122
and S. japonicum scaffolds. To this end, we mapped all S. mansoni protein coding sequences to 123
the genome assemblies of the two other species and selected only the hits with the highest 124
scores, yielding 9,504 S. mansoni / S. haematobium orthologs and 8,555 S. mansoni / S. 125
japonicum orthologs (Table 1). Scaffolds were then assigned to one of the S. mansoni
126
chromosomes, based on their ortholog content (Figure 1-source data 1). 127
We further performed a comparative coverage analysis to define the Z-specific regions of the 128
three species. Z-derived sequences are expected to display half the genomic coverage in ZW 129
females as in ZZ males, and as the autosomes. We thus mapped male and female genomic 130
reads (or only female reads in the case of S. haematobium) to the reference genome of each 131
species (42–45). Publicly available raw reads were used for S. mansoni and S. haematobium 132
(Wellcome Trust Sanger Institute Bioprojects PREJB2320 and PREJB2425), while male and 133
female S. japonicum were sequenced for this study. We then estimated the per base genomic 134
coverage. Median coverage values were 18.40 and 18.99 for S. mansoni male and female 135
libraries; 23.5 and 7.43 for S. haematobium female#1 and female#2 libraries; 23.77 and 20.53 136
for S. japonicum male and female libraries. Z-specific genomic regions were defined by a 137
maximum value of the female:male ratio of coverage (S. mansoni: log2(female:male)=-0.4; S. 138
japonicum: log2(female:male)=-0.84), or a maximum value of female coverage (S.
139
haematobium: log2(female)=4.41). Details of how these cutoff values were obtained are
140
provided in the Methods and Appendix 1. This analysis resulted in 285 newly described Z-141
specific genes in S. mansoni that were previously located on 19 unplaced scaffolds longer than 142
50kb, and to a refined pseudoautosomal/Z-specific structure of the published ZW linkage group 143
(42,43) (Figure 1-source data 2). It further allowed us to define 379 Z-specific scaffolds 144
(containing 1,409 annotated genes with orthologs in S. mansoni) in S. haematobium (Figure 1-145
source data 3 for exhaustive list) and 461 Z-specific scaffolds (containing 706 annotated 146
orthologs) in S. japonicum (Figure 1-source data 4 for exhaustive list). 147
While the content of the Z was largely shared between the African S. mansoni and S. 148
haematobium (Table1, Figure 1), large differences were found between the African and Asian
149
lineages: only 476 Z-specific genes were shared by S. mansoni and S. japonicum, while 306 150
were only Z-specific in S. mansoni and 137 only in S. japonicum (Table1). Of all these Z-specific 151
genes, 613 were already mapped to the S. mansoni ZW linkage group (42,43) and, when 152
plotted along the Z-chromosome, outlined three different evolutionary strata: one shared 153
ancestral stratum (S0: 367 genes) and two lineage-specific strata (S1mans, specific to the 154
African schistosomes, with 180 genes; and S1jap, specific to S. japonicum, with 66 genes) 155
(Table 1, Figure 1, and Figure 1-source data 1). The presence of pseudoautosomal regions 156
throughout the S0 (Figure 1) is likely due to errors in the genome assembly. All further analyses 157
were run using all newly identified Z-specific genes, but hold when only Z-specific genes that 158
were previously mapped to the ZW linkage group are considered (Appendix 1). 159
160
Table 1. Number of orthologs assigned as Z-linked and autosomal in S. mansoni, S. 161
haematobium and S. japonicum, based on the female:male (or female for S. haematobium) 162
coverage patterns. 163
164
SCHISTOSOMA JAPONICUM SCHISTOSOMA HAEMATOBIUM
Categories Z-specific Autoso ma l Ambi guous Not co ve re d Z-specific Autoso ma l Ambi guous Not co ve re d SCHIS TOSO M A MANSO NI Z-specific 476 (S0) (S1mans)306 20 3 847 36 23 10 Autosomal (S1jap)137 7,062 91 13 216 7,462 262 105 Excluded 57 383 4 3 105 411 20 7 Orthologs total 8,555 9,504 165 166
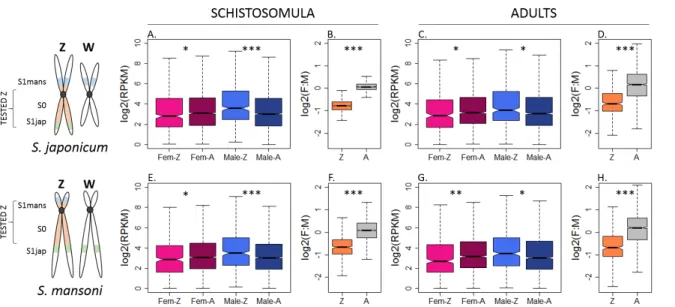
2. Consistent patterns of expression in S. mansoni and S. japonicum. 167
In order to test for dosage compensation, the median expression of Z-specific genes in ZW 168
females can be compared to the median autosomal expression (Z:AA ratio) and/or to the Z-169
specific gene expression in ZZ males (F:M ratio). In females, a Z:AA or F:M ratio of ~1 supports 170
global dosage compensation, while a ratio between 0.5 and 1 suggests partial or local dosage 171
compensation. We performed this analysis in S. mansoni and in S. japonicum, using publicly 172
available RNA-seq reads derived from a sexually undifferentiated stage (schistosomula, (46,47)) 173
and a sexually mature stage (adults, Wellcome Trust Sanger Institute Bioproject PRJEB1237, 174
(47)). The inclusion of a sexually immature stage is important, as much of the expression 175
obtained from adults will necessarily come from their well-developed gonads. Sex-linked genes 176
are often sex-biased in the germline, even in organisms that have chromosome-wide dosage 177
compensation (e.g. due to sex-chromosome inactivation during gametogenesis), and the 178
inclusion of gonad expression has led to inconsistent assessments of the status of dosage 179
compensation in other clades (16,29). Reads were mapped to their respective genomes, and 180
expression values in Reads Per Kilobase Million (RPKM) were calculated for each gene (Figure 181
2, Figure 2-source data 1 and 2); only genes with a minimum RPKM of 1 in both sexes were 182
considered. 183
We consistently observed a strong male bias in the expression of Z-specific genes in both 184
stages and species (F:M ratio between 0.58 and 0.69, Figure 2 and Supplementary File 1), 185
consistent with local or incomplete dosage compensation. While this was generally supported 186
by the lower expression levels of Z-specific genes in females when compared to the autosomes 187
(Z:AA ratio between 0.73 and 0.85; Figure 2, Supplementary File 1), this difference was only 188
apparent for some filtering procedures (Figure 2-figure supplement 1 to Figure 2-figure 189
supplement 14), and even then was not sufficient to fully account for the strong male-bias of the 190
Z. Instead, the higher expression of the male Z in both stages and species (ZZ:AA ratio between 191
1.25 and 1.46, Supplementary File 1) appeared to also contribute to the male-bias of Z-linked 192
genes. These patterns were qualitatively robust to changes in the methods used to estimate 193
expression (RPKM or TPM [Transcripts Per Kilobase Million]), in the filtering procedure 194
(RPKM>0, RPKM>1, TPM>0 or TPM>1), and when only genes that were previously mapped to 195
the ZW linkage group were considered. These analyses were further performed independently 196
in the S0, S1mans and S1jap strata, which showed no significant difference in the extent of their 197
male bias. All the resulting plots are shown in Figure 2-figure supplement 1 to Figure 2-figure 198
supplement 14. Finally, Z-specific genes were found to be male-biased even when only genes 199
with broad expression were considered (RPKM>1 and RPKM>3 in all samples, and when genes 200
with strong sex-biases in expression were excluded (M:F>2 or F:M>2, Figure 2-figure 201
supplement 15 and Figure 2-figure supplement 16, I-L panels), confirming that this pattern does 202
not appear to be driven simply by the presence of genes with sex-specific functions on the Z-203
chromosome. No further influence of known protein-protein interactions was detected (Figure 2-204
figure supplement 17, Appendix 1). 205
206 207
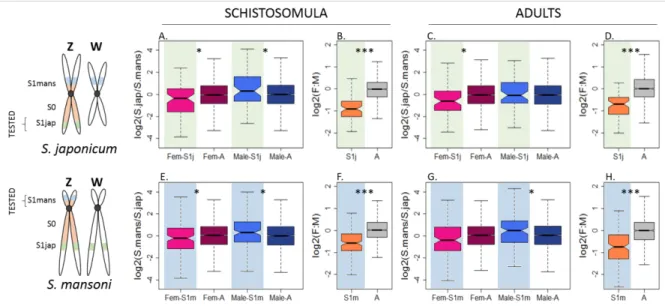
3. Convergent upregulation of the Z in both sexes 208
The previous patterns are consistent with an upregulation of the Z-chromosome in both sexes 209
after the degeneration of the W-specific region, and could represent the intermediate step in the 210
evolution of dosage compensation originally postulated by Ohno. However, they could also be 211
due to high expression of the ancestral proto-Z in both sexes, before sex chromosome 212
divergence. To exclude this, we identified one-to-one orthologs between genes annotated in 213
both species using a reciprocal best hit approach (7,382 orthologs, Figure 3-source data 1). All 214
genes that were classified as Z-specific in one species but as autosomal in the other were 215
considered to be part of the S1 strata (S1jap if they were Z-specific in S. japonicum or S1man if 216
they were Z-specific in S. mansoni). We then used the pseudoautosomal expression of these 217
lineage-specific strata as a proxy for the ancestral level of expression. For instance, in S. 218
japonicum, we estimated the S1jap:AA ratio, after normalizing the expression data by their 219
respective (pseudo)autosomal level in S. mansoni (Figure 3A and 3B). The reversed analysis 220
was performed for S1mans (Figure 3C and 3D). 221
Figure 3 confirms that the male-biased expression of Z-specific genes is a consequence of their 222
sex-linkage, and that the Z-chromosome has become under-expressed in females relative to the 223
ancestral expression. However, a full two-fold reduction in female expression is not observed, 224
consistent with partial upregulation, and/or full upregulation of a subset of dosage-sensitive 225
genes (Z:AA ranging from 0.68 to 0.83, Supplementary File 1)(48,49). Figure 3 also generally 226
supports an increase in expression in males (ZZ:AA ranging from 0.98 to 1.35, Supplementary 227
File 1). Male adults of S. japonicum are the exception, with a ZZ:AA of 0.98. However, given 228
that an excess of expression is observed when (i) we do not take into account the ancestral 229
expression (Figure 2), (ii) we focus on genes previously mapped to the ZW pair (Figure 2-figure 230
supplement 3, 4, 10 and 11), and (iiii) we consider the schistosomula stage (with or without the 231
ancestral expression and independent of the classification), this is likely due to noise in the 232
sample and not to a true biological difference (only 58 genes were tested). Figure 3 shows the 233
distributions for all genes with a minimum RPKM value of 1 in males and females of both 234
species. We repeated the analysis using the same filters as before (minimum RPKM of 0, TPM 235
of 0, TPM of 1), and with a publicly available list of 1:1 orthologs (obtained from the Wormbase 236
Biomart, see Methods). The resulting plots are shown in Figure 2-figure supplement 1 to Figure 237
2-figure supplement 14, and Figure 3-figure supplement 1 and 2. Gene expression values for 238
the orthologs of each species are provided in Figure 3-source data 2 and 3. 239
240
4. Male-biased protein dosage of Z-specific genes. 241
We tested for putative post-transcriptional mechanisms by assessing the dosage compensation 242
pattern at the proteomic level in adult S. mansoni, using a somatic tissue (head region) as well 243
as the gonads; three replicates were used for each tissue and sex. Heads and gonads were 244
chosen as they allowed us to compare Z-specific gene dosage in tissues with widespread 245
functional sex-specificity (ovary and testis), and in a tissue where most dosage imbalances are 246
likely to be deleterious. We used a label-free quantitative mass spectrometry approach to obtain 247
a relative quantification of the protein levels in each tissue depending of the sex (Figure 4-248
source data 1 to 5). Post-transcriptional dosage compensation mechanisms would be 249
detectable by (i) an equalization of the Z expression between sexes at the protein level (F:M 250
close to 1 for both the Z and the autosomes); (ii) a different correlation between F:M obtained 251
from mRNA and from proteins for Z-linked and autosomal genes. We used publicly available 252
head and gonad microarray data (50) as the transcriptomic reference (Figure 4-source data 6). 253
A significant and positive correlation was found between the F:M ratio derived from the 254
microarray and from the proteomic data (Figure 4), and between transcript and protein dosage 255
levels in both males and females (Figure 4-figure supplement 1 and 2), confirming the validity of 256
the comparison. 257
Similar to what was observed using RNA-seq, the expression of Z-specific genes was strongly 258
male-biased compared to that of autosomal genes in both heads (F:M of 0.68 for the Z 259
chromosome versus 0.92 for the autosomes; Figure 4A, Supplementary File 1) and gonads 260
(F:M of 0.78 versus 0.99; Figure 4B, Supplementary File 1). These F:M ratios are closer to each 261
other than in our RNA-seq analysis (Figure 2, Supplementary File 1), or than the microarray 262
data (Supplementary File 1), which could suggest a potential contribution of post-transcriptional 263
regulation to dosage equalization. However, Figure 4B shows that Z-linked and autosomal 264
genes show a similar correlation between the F:M ratios found for mRNAs and proteins (p>0.05 265
with a Fisher r-to-z transformation of the correlation coefficients, Figure 4C and 4D), which 266
argues against a major role of post-transcriptional regulation to balance expression. This 267
similarity between Z-linked and autosomal genes holds when only genes with male-biased 268
expression in the microarray data are considered (Figure 4-figure supplement 3), and when the 269
transcript and protein dosage of Z-linked autosomal genes are compared within each sex 270
(Figure 4-figure supplement 1 and 2). 271
272
DISCUSSION 273
1. Schistosome sex chromosome evolution in the age of genomics 274
S. mansoni, S. haematobium and S. japonicum are the main species responsible for human
275
schistosomiasis and have been the subject of many molecular and genomic studies. Despite the 276
availability of extensive genomic and transcriptomic resources (e.g. a genome assembly at the 277
near-chromosome level for S. mansoni (42,43), or sex- and stage-specific transcriptomes 278
(46,51–53), m
any basic questions remain regarding their reproduction and biology. For 279instance, the master sex-determining gene (and whether it is located on the W or Z) is still a 280
mystery (54,55). This is partly due to the inherent challenges of assembling genomes from 281
sequencing data, especially for regions rich in heterochromatin and repetitive sequences, such 282
as sex chromosomes. For instance, 416 scaffolds, including 3,893 genes (29% of the annotated 283
nuclear genes), are still unplaced. By basing our analysis on genomic coverage, we were able 284
to detect a further 285 Z-specific genes in S. mansoni; their role in sex determination can be 285
investigated further. Our comparative approach can also reduce the number of candidates, as 286
any gene involved in sex determination should in principle be found in the ancestral Z-specific 287
stratum; similar analyses in other species can in the future refine the candidate region. Another 288
advantage of basing our Z-assignment purely on coverage patterns is that our results should be 289
largely independent of potential biases in the current version of the genome. It should however 290
be noted that many genes are likely still missing from the current assembly (which has a 291
BUSCO score of 76% complete plus fragmented genes,
292
https://parasite.wormbase.org/index.html (56,57)), and that repeating these analyses using 293
future improved assemblies will be necessary to obtain the full set of sex-linked genes. 294
A gradient of ZW heteromorphism between schistosome species was revealed by cytogenetic 295
studies (39,58,59); in particular, African schistosomes were found to have much more extensive 296
ZW differentiation and W heterochromatinization than Asian species (60). Our results generally 297
support these cytogenetic data: we confirm the acquisition of independent evolutionary strata in 298
the sex chromosomes of S. mansoni and S. japonicum, and detect a larger number of Z-specific 299
genes in the African species (8% to 11% of all annotated orthologs, respectively, in S. mansoni 300
and S. haematobium) than in S. japonicum (5.5% of all annotated orthologs). Interestingly, 301
although the sex chromosomes of the African S. mansoni and S. haematobium differ 302
morphologically, they are largely similar in their gene content (Figure 1), consistent with their 303
much closer phylogenetic relationship (the median synonymous divergence between the two 304
species is around 17%, compared to 65% for S. mansoni / S. japonicum, Appendix 1). This may 305
be comparable to snakes, where ZW pairs with vastly different morphologies were all equally 306
differentiated at the genomic level (9), and highlights the contribution of other factors, such as 307
differential transposable element accumulation, to the large scale morphology of sex 308
chromosomes. 309
310
2. ZW systems and incomplete dosage compensation: gene-by-gene or partial shift? 311
ZW systems (aside from Lepidoptera) consistently show male-biased expression of the Z 312
chromosome (Gu and Walters, 2017). While female-biased expression of the X occurs in a few 313
young XY systems (16,31,57-61), well established X chromosomes generally show full 314
equalization of gene expression between the sexes. This difference has often been framed as 315
the acquisition of global mechanisms of dosage compensation, which affects the whole X/Z, 316
versus the acquisition of local compensation, in which dosage-sensitive genes become 317
individually regulated (61). Several parameters should influence this, and favor local 318
compensation in ZW systems: (i) The speed of the heterochromosome degeneration: when only 319
a few genes are lost at a time (because the region of suppressed recombination is small, or 320
because degeneration is slow), the establishment of a gene-by-gene dosage compensation may 321
be favored; on the other hand, the loss of many genes at once could favor global mechanisms 322
of dosage compensation (23,62). Since more mutations occur during spermatogenesis than 323
oogenesis, female-specific W chromosomes will generally have lower mutation and 324
degeneration rates than male-specific Ys, favoring local compensation; (ii) The effective 325
population size of Z (NeZ): NeZ is decreased when the variance in reproductive success of ZZ 326
males is larger than that of ZW females (e.g. in the presence of strong sexual selection). This 327
will impair the adaptive potential of the Z (63,64), such that only strongly dosage-sensitive 328
genes can become upregulated in the heterogametic sex, while the others remain 329
uncompensated; (iii) More efficient purging of mutations that are deleterious to males: strong 330
sexual selection can also increase the strength of purifying selection on males, by preventing all 331
but the fittest males from contributing to the next generations. If mutations that compensate for 332
the loss of Y/W-linked genes overexpress the X/Z copy in both sexes, they will be under 333
negative selection in the homogametic sex, and may be more efficiently selected against when 334
males are the homogametic sex (64). 335
Schistosomes are unusual among female-heterogametic clades in that they appear to have a 336
chromosome-wide upregulation of the Z in both sexes; such an increase in males was not 337
detected in birds (17) or snakes (9), even when ancestral expression was taken into account. 338
They therefore likely represent an intermediate between ZW species with true local 339
compensation, and the chromosome-wide compensation of the ZW Lepidoptera. These results 340
further show that, even if mutations that upregulate gene expression in both sexes are more 341
easily fixed on an evolving X-chromosome than on an evolving Z (64), this is not an absolute 342
barrier to the evolution of global dosage compensation. It is however still unclear why the 343
evolutionary dynamics appear to differ between schistosomes and most other ZW clades, as the 344
demographic and population genetics parameters of this group are largely unknown. The 345
observed male biased sex-ratio in adults, combined with a largely monogamous mating system 346
(65,66), may increase the reproductive variance of males and could reduce the effective 347
population size of the Z. This should also lead to stronger sexual selection in males than in 348
females (66,67), suggesting similar evolutionary dynamics as in other ZW systems. A detailed 349
characterization of the population genetics of the Z chromosome and autosomes will therefore 350
be crucial for understanding what may have driven the evolution of this unusual system. 351
352
3. The relevance of the Ohno’s hypothesis in the high-throughput sequencing era 353
Ohno’s hypothesis predicts that the heterochromosome is initially overexpressed in both sexes, 354
then secondarily downregulated in the homogametic sex (14),. This theoretical scenario was 355
first formulated to account for the inactivation of the X in mammals. Since then, similar 356
molecular mechanisms to downregulate the X/Z chromosome have been characterized in 357
nematodes and moths (68,69). If an initial upregulation of the X did occur in both sexes, then 358
inactivation in the homogametic sex should simply restore the ancestral expression levels, a 359
hypothesis that has been tested in many empirical studies in mammals. Most of them assumed 360
that the X and autosomes must have had similar ancestral levels of expression, and simply 361
compared their expression (17,19,20,23,35,70–75). These yielded mixed results, with some (20) 362
finding reduced expression of the X, while others (e.g. (71–73)) found similar levels of 363
expression for X-linked and autosomal genes, in agreement with Ohno’s predictions. Taking 364
ancestral gene expression into account, Julien et al. (17) found evidence of an Ohno-like 365
mechanism in the marsupials but not in placental mammals (17). Pessia et al. (49) recently 366
found that while individual dosage-sensitive genes do show evidence of up-regulation, the 367
majority does not. The evolution of X-inactivation may therefore have involved a complex 368
scenario under which a few dosage sensitive genes first became individually upregulated in 369
both sexes (gene-by-gene compensation), followed by the establishment of a chromosome-wide 370
mechanism to downregulate expression in females (global compensation) (48,49). 371
Our results, which consider ancestral expression and do not indicate a major influence of post-372
transcriptional regulation, suggest a scenario closer to Ohno’s original hypothesis, with the male 373
Z showing a consistent increase in expression. A similar pattern was observed in Tribolium 374
castaneum (Coleoptera, (30)), where the female X was found to be over-expressed relative to 375
the autosomes, and to the male X-chromosome. However, an RNA-seq analysis in the same 376
species did not detect this (76), so it is at this point unclear whether it truly represents an 377
example of Ohno’s model in action. The youngest evolutionary stratum of the young XY pair of 378
threespine sticklebacks also shows overexpression in females (31), even when ancestral 379
expression is accounted for (77). However, the interpretation of these patterns is complicated by 380
the fact that such an overexpression is also detected for the pseudoautosomal region, and that 381
the oldest evolutionary stratum appears to lack dosage compensation altogether. Schistosomes 382
may therefore not only represent an ideal system in which to investigate the evolution of dosage 383
compensation in a ZW system, but also an unparalleled system for understanding the relevance 384
of the model and predictions originally made by Ohno. 385
386 387
MATERIALS AND METHODS 388
A detailed description of the computational analyses, as well as all the scripts that were used, 389
are provided in Appendix 1. 390
391
DNA sequencing of S. japonicum males and females 392
Male and female worms preserved in ethanol of S. japonicum were provided by Lu Dabing from 393
Soochow University (Suzhou, China). DNA was extracted from 28 pooled males and 33 pooled 394
females. The worms were lysed using the Tissue Lyser II kit (QIAGEN) and DNA was isolated 395
using the DNeasy Blood & Tissue Kit (QIAGEN). DNA was then sheared with a AFA™ with 396
Covaris Focused-ultrasonicator. Library preparation and sequencing (HiSeq 2500 v4 Illumina, 397
125bp paired-end reads) were performed at the Vienna Biocenter Next Generation sequencing 398
facility (Austria). Reads have been deposited at the NCBI Short Reads Archive under accession 399
number SRP135770. 400
401
Publicly available DNA reads and genome assemblies 402
S. mansoni DNA libraries (100bp paired-end reads) were downloaded from the NCBI Sequence
403
Read Archive, under the accession numbers ERR562989 (~6,000 male pooled cercariae) and 404
ERR562990 (~6,000 female pooled cercariae). Female S. haematobium DNA libraries (80bp 405
paired-end reads) were found under accession numbers ERR037800 and ERR036251. No male 406
S. haematobium library was available. The reference genome assemblies of S. mansoni
407
(PRJEA36577, (78)), S. haematobium (PRJNA78265, (44)) and S. japonicum (PRJEA34885, 408
(45)) were obtained from the WormBase parasite database 409 (https://parasite.wormbase.org/index.html, (56,57)). 410 411 412 413
Orthology and assignment to the S. mansoni chromosomes 414
S. mansoni coding sequences and their respective chromosomal locations were obtained from
415
the WormBase Parasite database (https://parasite.wormbase.org/index.html, (56,57)). This 416
gene set was mapped to the S. haematobium and S. japonicum genome assemblies using Blat 417
(79) with a translated query and dataset (-dnax option), and a minimum mapping score of 50; 418
only the genome location with the best score was kept for each. When more than one gene 419
overlapped by more than 20 base pairs, only the gene that had the highest mapping score was 420
kept. Finally, each scaffold was assigned to one of the S. mansoni chromosomes, depending on 421
the majority location of the genes that mapped to it, or on their total mapping scores if the same 422
number of genes mapped to two separate chromosomes. The final chromosomal assignments 423
are provided in Figure 1-source data 1. 424
425
DNA read mapping and estimation of genomic coverage 426
For the S. japonicum DNA reads, adaptors were removed using Cutadapt (v1.9.1, (80)) and the 427
quality of the reads was assessed using FastQC (v0.11.2, 428
https://www.bioinformatics.babraham.ac.uk/projects/fastqc/); no further quality trimming was 429
deemed necessary. For the S. mansoni and S. haematobium reads, potential adaptors were 430
systematically removed, and reads were trimmed and filtered depending on their quality, using 431
Trimmomatic (v0.36, (81)). The resulting read libraries of each species were mapped separately 432
to their reference genomes using Bowtie2 (--end-to-end --sensitive mode, v2.2.9, (82)). The 433
resulting alignments were filtered to keep only uniquely mapped reads, and the male and female 434
coverages were estimated from the filtered SAM files with SOAPcoverage (v2.7.7., 435
http://soap.genomics.org.cn/index.html). Coverage values were calculated for each scaffold in 436
S. haematobium and S. japonicum, and for each 10kb non-overlapping window in S. mansoni.
437
The coverage values for each library are provided in Figure 1-source data 3 and 4. 438
439
Detection of Z-specific sequences 440
For each species, we calculated the log2(female:male) coverage of each scaffold or, in the case 441
of S. mansoni, of each 10Kb window along the genome. Since only female DNA data was 442
available for S. haematobium, the log2(female1+female2) was used instead for this species. 443
In order to determine the 95% and 99% percentile of log2(female:male) of Z-linked sequences, 444
which we use as cut-off values for assignment to Z-specific regions, we first excluded 445
scaffolds/windows that fit an autosomal profile. To do so, the 1st and 5th percentile of 446
log2(female:male) were estimated using all 10kb windows found on the annotated autosomes of 447
S. mansoni (78); in S. haematobium and S. japonicum, all scaffolds that mapped to the S.
448
mansoni autosomes were used for this purpose.
449
By plotting the distribution of log2(Female:Male) for the scaffolds/windows that map to each 450
chromosome (Appendix 1), we determined that: (i) for S. mansoni the 1st percentile 451
(log2(female:male)=-0.26) discriminates effectively between autosomal and Z-specific windows; 452
(ii) for S. haematobium and S. japonicum, which have noisier coverage, the 1st percentile 453
included a significant fraction of Z-derived genes, and the 5st percentile was used instead 454
(respectively log2(Female)=4.57 and log2(female:male)=-0.40). All scaffolds with higher 455
log2(female:male) or log2(female) were excluded. 456
The 95th and 99th quantiles of coverage were then calculated for the remaining, putatively Z-457
linked, sequences. By plotting all the coverage values along the S. mansoni Z-chromosome 458
(Appendix 1 and Figure 1), we determined that: (i) for S. mansoni and S. haematobium, the 95th 459
quantile (log2(female:male)=-0.4 and log2(female)=4.41, respectively) was an effective cut-off 460
for discriminating pseudoautosomal and Z-specific sequences; (ii) for S. japonicum, using the 461
95th percentile lead to the exclusion of many genes in Z-specific regions, and the 99st percentile 462
(log2(F:M)=-0.84) was used instead. The Z-specific or autosome assignation was finally 463
attributed as follows: (i) in S. mansoni, windows were classified as Z-linked if they displayed 464
log2(F:M)<-0.4 and as autosomal if log2(F:M)>-0.4; (ii) for S. haematobium, scaffolds with 465
log2(femalesum)<4.41 were classified as Z-linked, scaffolds with log2(femalesum)>4.57 as 466
autosomal, and all others as ambiguous; (iii) for S. japonicum, scaffolds with log2(F:M)<-0.84 467
were classified as Z-linked, scaffolds with log2(F:M)>-0.40 as autosomal, and all others as 468
ambiguous. For S. haematobium and S. japonicum, we considered only scaffolds with at least a 469
coverage of 1 in each library (n.a.). In S. mansoni, unplaced scaffolds shorter than 50kb were 470
excluded; five consecutive 10kb windows with consistent coverage patterns were required for a 471
region to be classified as either Z-specific or autosomal. Smaller regions, as well as the two 472
10Kb windows surrounding them, were excluded (see Appendix 1). The final classifications for 473
the three species are provided in Figure 1-source data 2, 3, and 4, and summarized for 474
orthologs in Figure 1-source data 1. 475
476
Definition of Z-specific strata in S. mansoni and S. japonicum 477
The specific gene content of S. mansoni and S. japonicum was compared in order to define Z-478
chromosome strata. Genes that were located on Z-specific scaffolds/windows in both species 479
were assigned to the shared stratum "S0". Genes that were assigned to Z-specific regions in 480
one species but not in the other were assigned to lineage-specific strata: “S1mans” genes were 481
Z-specific in S. mansoni and autosomal in S. japonicum, while “S1jap” genes were Z-specific in 482
S. japonicum and autosomal in S. mansoni. While the main figures consider all the genes that
483
were classified as Z-linked or autosomal based on coverage (referred to as the "exhaustive 484
classification" in Appendix 1 and Figures), independent of their original genomic location, we 485
repeated the analyses using only the Z-specific genes that were already assigned to the ZW 486
linkage map of S. mansoni (the "stringent classification" in Appendix 1). All genes belonging to 487
the categories “excluded”, “ambiguous”, “n.a.” or that did not have orthologs on S. japonicum 488
scaffolds were not further considered (Table 1). “PSA_shared” and “Aut_shared” are common to 489
the two classifications and correspond to genes that were classified as autosomal in both 490
species using coverage, and that were previously mapped to the ZW linkage group or to the 491
autosomes of S. mansoni, respectively (78). 492
493
Publicly available RNA reads and estimation of gene expression 494
S. mansoni and S. japonicum RNA-seq libraries were obtained from SRA (NCBI). Accession
495
numbers are: S. mansoni adult females: ERR506076, ERR506083, ERR506084; S. mansoni 496
adult males: ERR506088, ERR506082, ERR506090; S. mansoni schistosomula females: 497
SRR3223443, SRR3223444; S. mansoni schistosomula males: SRR3223428, SRR3223429 ; 498
S.japonicum adult females: SRR4296944, SRR4296942, SRR4296940; S.japonicum adult
499
males: SRR4296945, SRR4296943, SRR4296941; S. japonicum schistosomula females: 500
SRR4279833, SRR4279491, SRR4267990; S. japonicum schistosomula males: SRR4279840, 501
SRR4279496, SRR4267991. Raw reads were cleaned using trimmomatic (v 0.36,(81)), and the 502
quality of the resulting reads was assessed using FastQC (v0.11.2, 503
https://www.bioinformatics.babraham.ac.uk/projects/fastqc/). Reads were mapped to their 504
respective reference genomes used Tophat2 (83). Read counts were obtained with Htseq (84) 505
and expression values (in Reads Per Kilobase of transcript per Millionmapped reads, RPKM) 506
were calculated for each gene in each of the RNA-seq libraries (Figure 2-source data 1). TPM 507
(Transcripts Per Kilobase Million) values were also calculated using Kallisto (85) against set of 508
coding sequences of the respective species. All expression values are provided in Figure 3-509
source data 2 and 3. A Loess Normalization (R library Affy) was performed on the 510
schistosomulum data and on the adult data separately and all analyses were performed using 511
different thresholds (RPKM>0, RPKM>1, TPM>0 or TPM>1 in all the libraries of the studied 512
stage). The Loess normalization was applied to all conditions at once when we filtered for 513
minimum expression in all stages and sexes (RPKM>1 and RPKM>3, Figure 2-figure 514
supplement 15 -17, Figure 3-figure supplement 1 and 2). Correlation analyses were performed 515
for each developmental stage, considering libraries from both males and females, and both 516
species. As shown in Appendix 1, two S. mansoni libraries (ERR506076 and ERR506082) were 517
not well correlated with the other samples, and were excluded from our study. Expression 518
values were averaged for each stage and sex. The significance of differences between medians 519
of expression was tested with Wilcoxon rank sum tests with continuity correction. 520
521
Detection of S. mansoni and S. japonicum one-to-one orthologs 522
S. japonicum coding DNA sequences and their respective location on the genome scaffolds
523
were obtained from the WormBase Parasite database
524
(https://parasite.wormbase.org/index.html, (56,57)). The S. mansoni set of coding sequences 525
(see above) was mapped to the S. japonicum gene set using Blat (79) with a translated query 526
and dataset (-dnax option), and a minimum mapping score of 50; only reciprocal best hits were 527
kept. This reciprocal best hit ortholog list is provided in Figure 3-source data 1 and 2. A second 528
list of orthologs was obtained from the Biomart of WormBase Parasite, excluding paralogues, 529
and requiring a gene stable ID for both S. mansoni (PRJEA36577) and S. japonicum 530
(PRJEA34885) (in Figure 3-source data 1 and 3). In subsequent transcriptomic analyses each 531
list was used independently to ensure that the results were independent of the method used to 532 assign orthology. 533 534 Microarray analysis 535
Microarray data for male and female heads and gonads (50) were obtained from the Gene 536
Expression Omnibus (GEO) database (NCBI,
537
ftp://ftp.ncbi.nlm.nih.gov/geo/series/GSE23nnn/GSE23942/matrix/). A Loess Normalization (R 538
library Affy) was performed on the head and gonad data separately. When different probes 539
corresponded to one gene, their expression values were averaged. Gene expression was 540
available for a total of 6,925 genes. The normalized data are available in Figure 4-source data 541
6. 542
Protein extraction and proteomic analysis 543
Male and female adult S. mansoni gonads were sampled using the whole-organ isolation 544
approach described previously (86). Twenty ovaries and 20 testes, as well as five heads of each 545
sex, were sampled, in triplicate, from paired worms. All biological samples were resuspended in 546
Laemmli buffer, denatured and frozen at -20°C until further processing. Subsequent protein 547
treatment and analyses were performed at the “EDyP-service” – proteomic platform (Grenoble, 548
France). The extracted proteins were digested by modified trypsin (Promega, sequencing 549
grade). The resulting peptides were analyzed by nanoLC-MS/MS (Ultimate 3000 RSLCnano 550
system coupled to Q-Exactive Plus, both Thermo Fisher Scientific). Separation was performed 551
on a 75µm x 250mm C18 column (ReproSil-Pur 120 C18-AQ 1.9µm, Dr. Maisch GmbH) after a 552
pre-concentration and desalting step on a 300 µm × 5 mm C18 precolumn (Pepmap, Thermo 553
Fisher Scientific). 554
MS and MS2 data were acquired using Xcalibur (Thermo Fisher Scientific). Full-scan (MS) 555
spectra were obtained from 400 to 1600m/z at a 70.000 resolution (200m/z). For each full-scan, 556
the most intense ions (top 10) were fragmented in MS2 using high-energy collisional dissociation 557
(HCD). The obtained data were processed in MaxQuant 1.5.8.3 against the database loaded 558
from Uniprot (taxonomy Schistosoma mansoni, October 26th, 2017, 13.521 entries) and the 559
MaxQuant embedded database of frequently observed contaminants. The resulted iBAQ values 560
(87) were loaded into ProStaR (88) for statistical analysis. Contaminant and reverse proteins 561
were removed and only the proteins with three quantified values in at least one condition were 562
taken into account. 563
After log2 transformation, the iBAQ values were normalized by overall-wise median centering 564
followed by imputation using detQuantile algorithm with quantile set to 1 (Figure 4-source data 1 565
and 2). An alternative set of data without imputed values is available in Figure 4-source data 3 566
and 4. 1,988 and 2,750 Schistosoma mansoni proteins were identified in heads and in gonads, 567
respectively (See Figure 4-source data 1 and 2 for statistical testing of differential abundance 568
between male and female samples). Among them, 1,741 and 2,516 could be attributed 569
unambiguously to a Schistosoma mansoni gene, and were represented by more than one 570
peptide; these were subsequently analyzed (See Figure 4-source data 5). 571
572
Data availability 573
DNA reads of male and female S. japonicum will be released upon publication on the SRA 574
database under study number SRP135770. Sex and tissue specific S. mansoni label-free 575
proteomic data are provided in Figure 4-source data 1 to 4. 576
577
Code availability 578
The full bioinformatic pipeline used in this study is provided in Appendix 1. 579
580
ACKNOWLEDGMENTS 581
We are grateful to Lu Dabing (Soochow University, Suzhou, China) for providing Schistosoma 582
japonicum samples, to Ariana Macon (IST Austria) and Georgette
583
Stovall (JLU Giessen) for technical assistance, to IT support at IST Austria for providing optimal 584
environment to bioinformatic analyses, and to the Vicoso lab for comments on the manuscript. 585
We thank the support of the discovery platform and informatics group at EDyP. Proteomic 586
experiments were partly supported by the Proteomics French Infrastructure (ANR-10-INBS-08-587
01 grant) and Labex GRAL (ANR-10-LABX-49-01); and the Wellcome Trust, grant 588
107475/Z/15/Z to CG.G. and T.Q. (FUGI). This project was funded by an Austrian Science 589
Foundation FWF grant (Project P28842) to B.V. 590
591
CONFLICT OF INTEREST STATEMENT 592
The authors declare that they have no conflict of interest. 593
594
LIST OF FIGURES 595
Figure 1. Shared and lineage-specific evolutionary strata on the Z-chromosome. 596
Figure 2. Patterns of expression on the Z and autosomes of S. japonicum and S. mansoni 597
species. 598
Figure 3. Convergent changes in the expression of Z-linked genes in S. japonicum and S. 599
mansoni after sex chromosome differentiation.
600
Figure 4. Transcript and protein dosage of Z-linked and autosomal genes in S. mansoni heads 601 and gonads. 602 603 LIST OF TABLES 604
Table 1. Number of genes assigned as Z-linked and autosomal in S. mansoni , S. haematobium 605 and S. japonicum 606 607 SUPPLEMENTARY FILES 608
Supplementary File 1. Comparison of the ratio of expression between the Z-linked and 609
autosomal genes (Z:A), and comparison of expression between males and females (F:M) in the 610
different species, stages and methods (Supplementary Table 1). Comparison of female:male 611
ratios of expression (F:M) using microarray and proteomics (Supplementary Table 2) 612
Appendix 1: Full description of the bioinformatics pipelines used for each analysis. 613
614
SUPPLEMENTARY FIGURES 615
Figure 2 - figure supplements 2 to 14. Adult/Schistosomulum expression patterns (in 616
RPKM/TPM) of genes located in the different strata of the Z (S0, S1man and S1jap), as well as 617
pseudoautosomal and autosomal genes. 618
Figure 2 - figure supplement 15. Z-linked and autosomal female:male ratio of gene expression 619
using different filters. 620
Figure 2 - figure supplement 16. Z-linked and autosomal gene expression in females and 621
males using different filters. 622
Figure 2 - figure supplement 17. Z-linked and autosomal female:male ratio of gene expression 623
according to presence/absence of known protein-protein interactions. 624
Figure 3 - figure supplement 1. Z-linked and autosomal female:male ratio of gene expression, 625
normalized by ancestral autosomal expression, and using different filters. 626
Figure 3 - figure supplement 2. Z-linked and autosomal gene expression in females and 627
males, normalized by ancestral autosomal expression, and using different filters. 628
Figure 4 - figure supplement 1. Pearson correlations between gene dosage at the transcript 629
and protein levels in male heads and gonads. 630
Figure 4 - figure supplement 2. Pearson correlations between gene dosage at the transcript 631
and protein levels in female heads and gonads. 632
Figure 4 - figure supplement 3. Pearson correlations between the female:male of expression 633
obtained by proteomics (y-axes) and by microarrays (x-axes) in S.mansoni heads and gonads, 634
using only genes with male-biased expression in the microarray data. 635
636
SUPPLEMENTARY DATASETS 637
Figure 1 - source data 1. Comparative genomics: coverage analysis and strata identification 638
Figure 1 - source data 2. S. mansoni reference species: coverage analysis and Z-Autosome 639
assignment 640
Figure 1 - source data 3. S. haematobium autosome vs Z-specific region assigment 641
Figure 1 - source data 4. S. japonicum autosome vs Z-specific region assigment 642
Figure 2 - source data 1. RPKM calculation for S. mansoni gene expression 643
Figure 2 - source data 2. RPKM calculation for S. japonicum gene expression 644
Figure 3 - source data 1. One-to-one orthology S. mansoni vs S. japonicum 645
Figure 3 - source data 2. Transcriptomic data, for blat 1-to-1 orthologs 646
Figure 3 - source data 3. Transcriptomic data, for WormBase Biomart orthologs 647
Figure 4 - source data 1. Proteomic data with imputed values – GONADS 648
Figure 4 - source data 2. Proteomic data with imputed values – HEADS 649
Figure 4 - source data 3. Proteomic data without imputed values – GONADS 650
Figure 4 - source data 4. Proteomic data without imputed values – HEADS 651
Figure 4 - source data 5. Correspondance between Gene_Id and Protein_ID 652
Figure 4 - source data 6. Microarray data 653
654 655
REFERENCES 656
657
1. Bachtrog D, Mank JE, Peichel CL, Kirkpatrick M, Otto SP, Ashman T-L, et al. Sex 658
Determination: Why So Many Ways of Doing It? PLoS Biol. 2014;12(7):e1001899. 659
2. Charlesworth B. The evolution of sex chromosomes. Science. 1991;251(4997). 660
3. Charlesworth D, Charlesworth B, Marais G. Steps in the evolution of heteromorphic sex 661
chromosomes. Heredity. 2005;95(2):118–28. 662
4. Rice WR. The Accumulation of Sexually Antagonistic Genes as a Selective Agent 663
Promoting the Evolution of Reduced Recombination between Primitive Sex 664
Chromosomes. Evolution. 1987;41(4):911. 665
5. Bergero R, Charlesworth D. The evolution of restricted recombination in sex 666
chromosomes. Trends Ecol Evol. 2009;24(2):94–102. 667
6. Engelstadter J. Muller’s Ratchet and the Degeneration of Y Chromosomes: A Simulation 668
Study. Genetics. 2008;180(2):957–67. 669
7. Ellegren H. Sex-chromosome evolution: recent progress and the influence of male and 670
female heterogamety. Nat Rev Genet. 2011;12(3):157–66. 671
8. Wang J, Na J-K, Yu Q, Gschwend AR, Han J, Zeng F, et al. Sequencing papaya X and 672
Yh chromosomes reveals molecular basis of incipient sex chromosome evolution. Proc 673
Natl Acad Sci. 2012;109(34):13710–5. 674
9. Vicoso B, Emerson JJ, Zektser Y, Mahajan S, Bachtrog D. Comparative Sex 675
Chromosome Genomics in Snakes: Differentiation, Evolutionary Strata, and Lack of 676
Global Dosage Compensation. PLoS Biol. 2013:e1001643. 677
10. Vicoso B, Kaiser VB, Bachtrog D. Sex-biased gene expression at homomorphic sex 678
chromosomes in emus and its implication for sex chromosome evolution. Proc Natl Acad 679
Sci. 2013;110(16):6453–8. 680
11. Lemaitre C, Braga MD V, Gautier C, Sagot M-F, Tannier E, Marais GAB. Footprints of 681
inversions at present and past pseudoautosomal boundaries in human sex 682
chromosomes. Genome Biol Evol. 2009;1(0):56–66. 683
12. Guo M, Davis D, Birchler JA. Dosage effects on gene expression in a maize ploidy series. 684
Genetics. 1996;142(4):1349–55. 685
13. Wijchers PJ, Festenstein RJ. Epigenetic regulation of autosomal gene expression by sex 686
chromosomes. Trends Genet. 2011;27(4):132–40. 687
14. Ohno S. Sex Chromosomes and Sex-linked Genes. Springer-Verlag. 1967. 688
15. Gartler SM. A brief history of dosage compensation. J Genet. 2014;93(2):591–5. 689
16. Gu L, Walters JR. Evolution of Sex Chromosome Dosage Compensation in Animals: A 690
Beautiful Theory, Undermined by Facts and Bedeviled by Details. Genome Biol Evol. 691
2017;9(9):2461–76. 692
17. Julien P, Brawand D, Soumillon M, Necsulea A, Liechti A, Schütz F, et al. Mechanisms 693
and Evolutionary Patterns of Mammalian and Avian Dosage Compensation. PLoS Biol. 694
2012;10(5):e1001328. 695
18. Lin F, Xing K, Zhang J, He X. Expression reduction in mammalian X chromosome 696
evolution refutes Ohno’s hypothesis of dosage compensation. Proc Natl Acad Sci. 697
2012;109(29):11752–7. 698
19. Nguyen DK, Disteche CM. Dosage compensation of the active X chromosome in 699
mammals. Nat Genet. 2006;38(1):47–53. 700
20. Xiong Y, Chen X, Chen Z, Wang X, Shi S, Wang X, et al. RNA sequencing shows no 701
dosage compensation of the active X-chromosome. Nat Genet. 2010;42(12):1043–7. 702
21. Vicoso B, Bachtrog D. Progress and prospects toward our understanding of the evolution 703
of dosage compensation. Chromosome Res. 2009;17(5):585–602. 704
22. Mank JE. Sex chromosome dosage compensation: definitely not for everyone. Trends 705
Genet. 2013;29(12):677–83. 706
23. Gu L, Walters JR. Evolution of Sex Chromosome Dosage Compensation in Animals: A 707
Beautiful Theory, Undermined by Facts and Bedeviled by Details. Genome Biol Evol. 708
2017;9(9):2461–76. 709
24. Itoh Y, Melamed E, Yang X, Kampf K, Wang S, Yehya N, et al. Dosage compensation is 710
less effective in birds than in mammals. J Biol. 2007;6(1):2. 711
25. Ellegren H, Hultin-Rosenberg L, Brunström B, Dencker L, Kultima K, Scholz B. Faced 712
with inequality: chicken do not have a general dosage compensation of sex-linked genes. 713
BMC Biol. 2007;5(1):40. 714
26. Arnold AP, Itoh Y, Melamed E. A Bird’s-Eye View of Sex Chromosome Dosage 715
Compensation. Annu Rev Genomics Hum Genet. 2008;9(1):109–27. 716
27. Wolf JB, Bryk J. General lack of global dosage compensation in ZZ/ZW systems? 717
Broadening the perspective with RNA-seq. BMC Genomics. 2011;12(1):91. 718
28. Chen S, Zhang G, Shao C, Huang Q, Liu G, Zhang P, et al. Whole-genome sequence of 719
a flatfish provides insights into ZW sex chromosome evolution and adaptation to a 720
benthic lifestyle. Nat Genet. 2014;46(3):253–60. 721
29. Huylmans AK, Macon A, Vicoso B. Global Dosage Compensation Is Ubiquitous in 722
Lepidoptera, but Counteracted by the Masculinization of the Z Chromosome. Mol Biol 723
Evol. 2017;34(10):2637–49. 724
30. Prince EG, Kirkland D, Demuth JP. Hyperexpression of the X Chromosome in Both 725
Sexes Results in Extensive Female Bias of X-Linked Genes in the Flour Beetle. Genome 726
Biol Evol. 2010;2(0):336–46. 727
31. Schultheiß R, Viitaniemi HM, Leder EH. Spatial Dynamics of Evolving Dosage 728
Compensation in a Young Sex Chromosome System. Genome Biol Evol. 2015;7(2):581– 729
90. 730
32. Vicoso B, Bachtrog D. Numerous Transitions of Sex Chromosomes in Diptera. PLOS 731
Biol. 2015;13(4):e1002078. 732
33. Gu L, Walters JR, Knipple DC. Conserved Patterns of Sex Chromosome Dosage 733
Compensation in the Lepidoptera (WZ/ZZ): Insights from a Moth Neo-Z Chromosome. 734
Genome Biol Evol. 2017;9(3):802–16. 735
34. Uebbing S, Konzer A, Xu L, Backström N, Brunström B, Bergquist J, et al. Quantitative 736
Mass Spectrometry Reveals Partial Translational Regulation for Dosage Compensation in 737
Chicken. Mol Biol Evol. 2015;32(10):2716–25. 738
35. Chen X, Zhang J. No X-Chromosome Dosage Compensation in Human Proteomes. Mol 739
Biol Evol. 2015;32(6):1456–60. 740
36. Chitsulo L, Loverde P, Engels D. Schistosomiasis. Nat Rev Microbiol. 2004;2(1):12–3. 741
37. Loker ES, Brant S V. Diversification, dioecy and dimorphism in schistosomes. Trends 742
Parasitol. 2006;22(11):521–8. 743