HAL Id: cea-01484019
https://hal-cea.archives-ouvertes.fr/cea-01484019
Submitted on 6 Mar 2017
HAL is a multi-disciplinary open access
archive for the deposit and dissemination of
sci-entific research documents, whether they are
pub-lished or not. The documents may come from
teaching and research institutions in France or
abroad, or from public or private research centers.
L’archive ouverte pluridisciplinaire HAL, est
destinée au dépôt et à la diffusion de documents
scientifiques de niveau recherche, publiés ou non,
émanant des établissements d’enseignement et de
recherche français ou étrangers, des laboratoires
publics ou privés.
Optical observation of spin-density-wave fluctuations in
Ba122 iron-based superconductors
B. Xu, Y. Dai, H. Xiao, B. Shen, Z.R. Ye, A. Forget, D. Colson, D.L. Feng, H.
Wen, X. G. Qiu, et al.
To cite this version:
B. Xu, Y. Dai, H. Xiao, B. Shen, Z.R. Ye, et al.. Optical observation of spin-density-wave fluctuations
in Ba122 iron-based superconductors. Physical Review B: Condensed Matter and Materials Physics
(1998-2015), American Physical Society, 2016, 94, pp.085147. �10.1103/PhysRevB.94.085147�.
�cea-01484019�
arXiv:1608.05474v1 [cond-mat.supr-con] 19 Aug 2016
superconductors
B. Xu,1, 2, 3 Y. M. Dai,2, 3, 4,∗ H. Xiao,1 B. Shen,5 Z. R. Ye,6 A. Forget,7 D. Colson,7 D. L. Feng,6 H. H. Wen,5 X. G. Qiu,2 and R. P. S. M. Lobo3, 4,†
1
Center for High Pressure Science and Technology Advanced Research, Beijing 100094, China
2
Beijing National Laboratory for Condensed Matter Physics, Institute of Physics, Chinese Academy of Sciences, Beijing 100190, China
3
LPEM, ESPCI Paris, PSL Research University, CNRS, 10 rue Vauquelin, F-75231 Paris Cedex 5, France
4
Universit´e Pierre et Marie Curie, Sorbonne Universit´es, F-75005 Paris Cedex 5, France
5
National Laboratory of Solid State Microstructures and Department of Physics, Nanjing University, Nanjing 210093, China
6
State Key Laboratory of Surface Physics, Department of Physics, and Advanced Materials Laboratory, Fudan University, Shanghai 200433, China
7
IRAMIS, SPEC, CEA, 91191 Gif sur Yvette, France (Dated: August 22, 2016)
In iron-based superconductors, a spin-density-wave (SDW) magnetic order is suppressed with doping and unconventional superconductivity appears in close proximity to the SDW instability. The optical response of the SDW order shows clear gap features: substantial suppression in the low-frequency optical conductivity, alongside a spectral weight transfer from low to high frequencies. Here, we study the detailed temperature dependence of the optical response in three different series of the Ba122 system [Ba1−xKxFe2As2, Ba(Fe1−xCox)2As2and BaFe2(As1−xPx)2]. Intriguingly, we
found that the suppression of the low-frequency optical conductivity and spectral weight transfer appear at a temperature T∗ much higher than the SDW transition temperature T
SDW. Since this
behavior has the same optical feature and energy scale as the SDW order, we attribute it to SDW fluctuations. Furthermore, T∗is suppressed with doping, closely following the doping dependence of
the nematic fluctuations detected by other techniques. These results suggest that the magnetic and nematic orders have an intimate relationship, in favor of the magnetic-fluctuation-driven nematicity scenario in iron-based superconductors.
PACS numbers: 72.15.-v, 74.70.-b, 78.30.-j
Iron-based superconductors (FeSCs) feature complex phase diagrams with multiple phase transitions, includ-ing unconventional superconductivity, magnetic and ne-matic phases. Unconventional superconductivity always appears in the vicinity of other competing phases.1 In FeSCs, the main competing phases are the SDW mag-netic and nematic orders. By applying carrier doping, isovalent substitution, or pressure, the SDW and nematic orders are suppressed and unconventional superconduc-tivity emerges.1,2
In FeSCs, the competing phases usually consist of var-ious symmetry-breaking orders, which interact with su-perconductivity in a complicated way.1,2The SDW mag-netic order is of the stripe type (spins aligned ferromag-netically in one direction and antiferromagferromag-netically in the other).3,4 Such an order breaks the O(3) spin-rotational symmetry.5 The nematic order breaks the C4 symme-try, which is characterized by inequivalent a and b lat-tice parameters and anisotropic electronic properties.6–13 The nematic order often occurs either simultaneously or slightly above the SDW transition, making these two or-ders track each other closely. At present, there are two scenarios for the development of nematic order and its relation to SDW magnetic order. One scenario is that nematic order is driven by orbital ordering of the iron 3d electrons. The orbital fluctuations trigger the magnetic transition and induce the striped SDW order.14–16
An-other scenario is that the nematic order is driven by mag-netic fluctuations, which produce a spin-nematic phase associated with the fact that the striped SDW order can be along either a or b axis.17–20However, it is not easy to assess the relative importance of orbital fluctuations and spin fluctuations from measurable quantities, making the origin of nematicity remain a controversial issue.5 It is known that the superconducting order parameter due to spin fluctuations has s± symmetry,21,22 whereas the one due to orbital fluctuations has s++symmetry.23,24 There-fore, to understand the unconventional superconductivity in FeSCs, it is important to investigate these compet-ing orders, as well as correspondcompet-ing fluctuations, since the unconventional superconductivity may be driven by these fluctuations.5
Optical spectroscopy probes the charge dynamics in solid materials, providing important information about phase transitions. The optical response of the SDW and SC transitions in FeSCs has been studied by many previ-ous works,25–30where clear gap features have been identi-fied. However, optical investigations into these materials with detailed temperature and doping dependence across the SDW or nematic transitions are still lacking, since a large amount of measurements are required. Here, we fill this gap by presenting a systematic optical study on a series of high quality K-, Co-, and P-doped Ba122 single crystals. We observed strong SDW fluctuations above
2 0 200 400 600 800 0.80 0.85 0.90 0.95 1.00 300 K 250 K 200 K 150 K 130 K R e f l e c t i v i t y BFA, T SDW 135 K (a) 0 400 800 1200 0 1 2 3 4 5 6 (e) 300 K 250 K 200 K 150 K 130 K W ave number (cm -1 ) 1 ( 1 0 3 -1 c m -1 ) 0 200 400 600 800 (b) 300 K 250 K 150 K 125 K 100 K BK16, T SDW 117 K 0 200 400 600 800 (c) 200 K 150 K 100 K 50 K 35 K 5 K BK27, T c 31 K 0 200 400 600 800 BK40, T c 39 K (d) 200 K 150 K 100 K 50 K 40 K 5 K 0 400 800 1200 (f) 300 K 250 K 150 K 125 K 100 K W ave number (cm -1 ) 0 400 800 1200 (g) 200 K 150 K 100 K 50 K 35 K 5 K W ave number (cm -1 ) 0 400 800 1200 (h) 200 K 150 K 100 K 50 K 40 K 5 K W ave number (cm -1 )
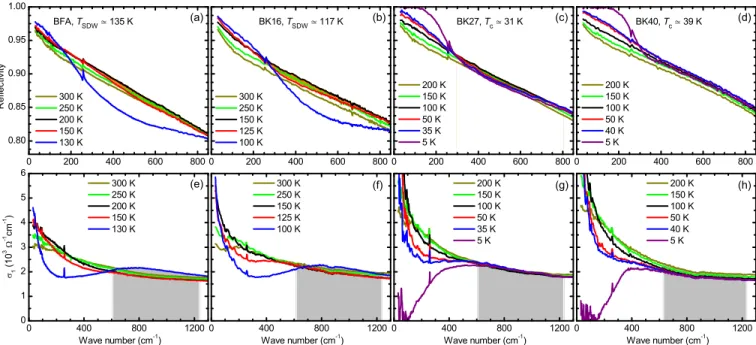
Figure 1. (Color online) (a–d) show the far-infrared reflectivity at different temperatures for BFA, BK16, BK27 and BK40, respectively. (e–h) display the corresponding optical conductivity curves obtained by the Kramers–Kronig analysis. The orange filled area indicates the signature of the anomalous behavior above TSDW. The grey area indicates the spectral weight transfer
region due to the opening of the SDW gap.
the SDW transition temperature. The onset SDW fluc-tuations temperature T∗ is defined by tracking the tem-perature evolution of the reflectivity and spectral weight. By plotting T∗in the phase diagrams, we find that it is in good agreement with the doping dependence of nematic fluctuations reported by previous works,9,31suggesting a close connection between the magnetic and nematic or-ders.
In this work, we study three series of Ba122 FeSCs, including Ba1−xKxFe2As2 (Ref. 32), Ba(Fe1−xCox)2As2 (Ref. 33), and BaFe2(As1−xPx)2 (Ref. 34). For each se-ries, high-quality single crystals of various dopings were synthesized with the methods described in the cited ref-erences. The samples are named by their dopant per-centages throughout the paper. For example, the x = 0, 0.08, 0.16, 0.20, 0.23, 0.27, and 0.40 samples of Ba1−xKxFe2As2 are named BFA, BK8, BK16, BK20, BK23, BK27, and BK40, respectively. In all three series, as shown by the transport properties in Appendix A, the undoped and underdoped compounds show a magnetic transition at TSDW, while the superconducting com-pounds undergo a superconducting transition at Tc.
The ab-plane reflectivity, R(ω), was measured at a near-normal angle of incidence on Bruker IFS66v and IFS113v spectrometers. An in situ gold overfilling tech-nique35 was used to obtain the absolute reflectivity of the samples. Data from 30 to 15 000 cm−1were collected at different temperatures on freshly cleaved surface for each sample, and then we extended the reflectivity to 40 000 cm−1 at room temperature with an AvaSpec-2048 × 14 optical fiber spectrometer. The optical
conduc-tivity, σ1(ω), was obtained by Kramers-Kronig analysis of the reflectivity. At low frequencies, we employed a Hagen-Rubens (R = 1 − A√ω) or a superconducting (R = 1 − Aω4) extrapolation. Above 15 000 cm−1, for all temperatures, we utilized the room temperature data, followed by a constant reflectivity up to 12.5 eV, and ter-minated by a free-electron (ω−4) response.
We start with our data analysis in the hole-doped compounds Ba1−xKxFe2As2. In this system, the opti-cal response is expected to exhibit distinct changes at each phase transition. Figure 1 shows R(ω) in pan-els (a–d) and σ1(ω) in panpan-els (e–h) for Ba1−xKxFe2As2 at different temperatures. Generally, the normal state (T > TSDW, Tc) optical spectra exhibit typical metal-lic response, realized by the relatively high R(ω) and the Drude-like behavior in σ1(ω). As the temperature is lower, R(ω) increases continuously, but is suppressed in the frequency range of 200–900 cm−1 for T < TSDW in BFA and BK16. Meanwhile, the corresponding σ1(ω) is also severely suppressed and most of spectral weight below ∼ 600 cm−1 is transferred to higher-energy region forming a peak around 900 cm−1. This spectral evolution manifests the behavior of the SDW gap on the Fermi sur-face.25,28 Upon entering the superconducting state, the low-frequency R(ω) develops a sharp edge and rises to a flat 100% value, as shown by the 5 K data for BK27 and BK40. This is a signature of the superconducting gap. In BK27 and BK40, σ1(ω) at 5 K drops to zero at low frequencies, indicating a fully open superconducting gap.26,29
asso-0.94 0.96 0.98 1.00 1.02 100 150 200 250 0.9 1.0 1.1 1.2 0 50 100 150 200 100 150 200 250 100 150 200 250 100 150 200 2500 50 100 150 200 0 50 100 150 T SDW (a) R ( = 5 0 0 c m -1 , T ) BFA (f) BK27 T* T c (b) BK8 T* T SDW T* T (K) (h) S 1 1 0 0 c m -1 7 0 0 c m -1 ( T ) T (K) (m) T (K) (i ) (d) BK20 T SDW T* (k) T (K) (g) BK40 T c T (K) (n) (c) BK16 T SDW T* (j ) T (K) T c (e) BK23 T SDW T* T (K) (l )
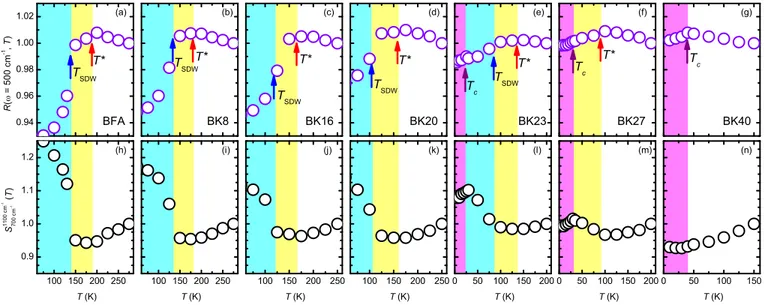
Figure 2. (Color online) Temperature dependence of R(ω = 500 cm−1) (a–g) and S1 100 cm−1
700 cm−1 (h–n) in Ba1−xKxFe2As2. All values are normalized to the highest temperature given in the panels for the best comparison. The red, blue and purple arrows indicate the onset temperature of the fluctuations T∗, SDW transition temperature T
SDW and superconducting transition
temperature Tc, respectively. 0 10 20 30 40 50 0 50 100 150 200 T ( K ) Tet / PM N e m a ti c f lu ct u a t io n s Doping x % Ba 1-x K x Fe 2 As 2 T* T SDW T c SC Ort / SDW
Figure 3. (Color online) Phase diagram of Ba1−xKxFe2As2.
The crosses denote the onset temperature T∗ of the
fluctu-ations. The solid circles mark the SDW transition temper-ature TSDW. The open squares represent the
superconduct-ing transition temperature Tc. The background of the phase
diagram was extracted from Ref. 31. The superconducting, orthorhombic SDW, and tetragonal paramagnetic phases are abbreviated as SC, Ort/SDW, and Tet/PM, respectively.
ciated with the SDW and superconducting gaps, we ob-serve an anomalous behavior. As indicated by the orange filled area in Fig. 1(a–c), above TSDW, a small suppres-sion of R(ω) sets in between ∼ 300 and 800 cm−1, which falls into the energy scale of the SDW gap. This be-havior can also be recognized on σ1(ω). For instance, in BFA [Fig. 1(e)], σ1(ω) decreases continuously from 300 to 200 K in the grey filled region (∼ 600–1 200 cm−1), owing to the narrowing of the Drude peak. However, we note that at 150 K the value of σ1(ω) becomes slightly higher than that at 200 K. This is explicit evidence of
the spectral weight transfer from low to high frequencies above TSDW. With more doping, this behavior becomes weaker in BK27, and finally disappears in the optimally-doped compound BK40 above the SC transition.
In the following, we determine the onset temperature of the anomalous behavior observed above TSDW. One convenient way is to track the temperature dependence of R(ω) at a certain frequency in the suppressed region. Here, we take the value of R(ω) at 500 cm−1, R(ω = 500 cm−1), and plot it as a function of temperature for each doping [Fig. 2(a–g)]. In the parent compound BFA, as shown in Fig. 2(a), R(ω = 500 cm−1) increases as the temperature is reduced, which is expected for a metallic behavior. In sharp contrast, R(ω = 500 cm−1) begins to decrease at a temperature T∗ (indicated by the red arrow at ≃ 185 K). Below TSDW (indicated by the blue arrow), R(ω = 500 cm−1) exhibits a more dramatic drop due to the opening of the SDW gap. In other samples, similar behavior is revealed, allowing the determination of the onset temperature T∗ for each doping. However, it is worth pointing out that R(ω = 500 cm−1) does not show any anomaly above Tc in BK40, implying that this behavior is absent.
Anomalies at T∗ can also be verified by a spectral weight analysis. The spectral weight is defined as Sωb
ωa =
Rωb
ωa σ1(ω)dω, where ωa and ωb are the lower and upper
cutoff frequency, respectively. Figs. 2(h–n) depict the spectral weight between 700–1 100 cm−1, S1 100 cm−1
700 cm−1 , for
each doping. S1 100 cm−1
700 cm−1 decreases continuously upon
cooling due to the narrowing of the Drude peak, but starts to increase at T∗signaling the onset of the anoma-lous spectral weight transfer from low to high frequencies. Below TSDW, the increase of S1 100 cm−1
4 0.94 0.96 0.98 1.00 1.02 50 100150200 80 160 240 0.9 1.0 1.1 1.2 0 50 100 150 50 100 150 0 50 100 80 160 240 (l) BP15 T SDW T* R ( = 4 0 0 c m -1 , T ) (i) BC1.5 T SDW T* (n) BP30 T c T* (m) BP23 T SDW T* (r) T (K) (o) T (K) S 1 0 0 0 c m -1 6 0 0 c m -1 ( T ) (t) T (K) (s) T (K) (k) BC8 T c T* (q) T (K) (j ) BC4 T SDW T* (p) T (K) (u) Tet / PM SC Ort / SDW N e m a tic flu ctu a tio n s T* T S DW T c Ba(Fe 1-x Co x ) 2 As 2 0 5 10 15 0 50 100 150 200 T ( K ) Doping x % (v) SC T* T S DW T c Ort / SDW N e m a tic flu ctu a tio n s Tet / PM BaFe 2 (As 1-x P x ) 2 0 10 20 30 40 50 60 70 0 50 100 150 200 T ( K ) Doping x % 0 200 400 600 800 0.80 0.85 0.90 0.95 1.00 R e f l e c t i v i t y (a) 300 K 250 K 150 K 125 K 100 K BC1.5, T N = 116 K 0 200 400 600 800 (b) 200 K 150 K 100 K 50 K 30 K BC8, T c = 23 K 0 200 400 600 800 (c) 300 K 250 K 150 K 100 K 50 K BP15, T N = 90 K 0 200 400 600 800 1000 (d) 200 K 150 K 100 K 50 K 30 K BP30, T c = 28 K 0 400 800 1200 1 2 3 4 (e) 1 ( 1 0 3 -1 c m -1 ) 300 K 250 K 150 K 125 K 100 K W ave number (cm -1 ) 0 400 800 1200 (f) 200 K 150 K 100 K 50 K 30 K W ave number (cm -1 ) 0 400 800 1200 (g) 300 K 250 K 150 K 100 K 50 K W ave number (cm -1 ) 0 400 800 1200 (h) 200 K 150 K 100 K 50 K 30 K W ave number (cm -1 )
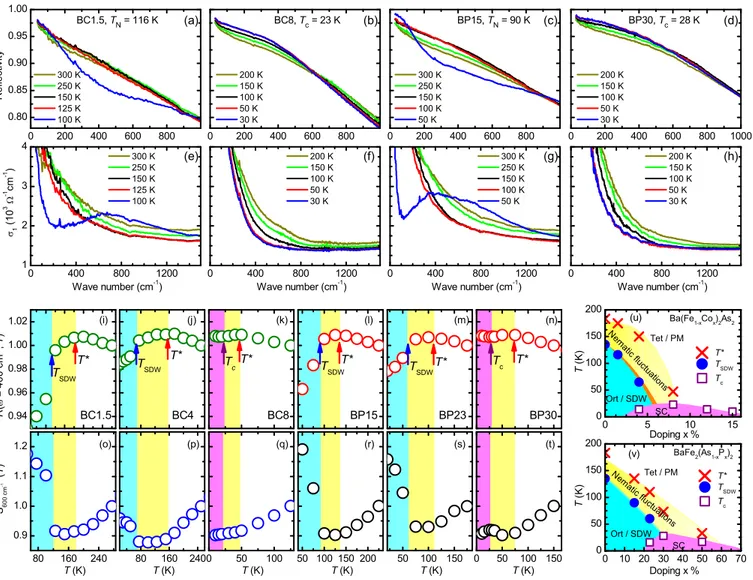
Figure 4. (Color online) Far-infrared reflectivity (a–d) and optical conductivity (e–h) for BC1.5, BC8, BP15 and BP30, respec-tively. Temperature dependence of R(ω = 400 cm−1) (i–n) and S1 000 cm−1
600 cm−1 (o–t) for Ba(Fe1−xCox)2As2and BaFe2(As1−xPx)2. All values are normalized to the highest temperature given in the panels for the best comparison. The red, blue and purple arrows indicate T∗, T
SDW and Tc, respectively. (u) and (v) depict the phase diagrams of Ba(Fe1−xCox)2As2 and BaFe2(As1−xPx)2,
respectively. The background of the phase diagrams were extracted from Refs. 9 and 31.
substantial, which is caused the opening of the SDW gap. In Fig. 3, we summarize the doping evolution of T∗ (red crosses) in the phase diagram of Ba1−xKxFe2As2: with increasing K concentration, T∗ is suppressed and termi-nates on the border of the SDW phase.
In order to confirm whether these observations are common in all Ba122 compounds, it is instructive to look into the electron-doped Ba(Fe1−xCox)2As2 and isovalent-doped BaFe2(As1−xPx)2. Figure 4 manifests that these two series show identical optical response above the SDW transition. T∗ is also extracted from the temperature dependence of R(ω) and spectral weight. The phase diagrams in Fig. 4(u) and Fig. 4(v) summa-rized the doping evolution of T∗ in Ba(Fe1−xCox)2As2 and BaFe2(As1−xPx)2, respectively. In both series, T∗ is suppressed with increasing doping, following the trend of the SDW order. Interestingly, T∗ survives up to the
op-timal doping in Ba(Fe1−xCox)2As2, and the overdoping in BaFe2(As1−xPx)2.
Based on the above optical results in all three se-ries of the Ba122 system, we summarize our new find-ings: (i) the onset temperature (T∗) of the low-frequency σ1(ω) suppression and spectral weight transfer is above the SDW transition; (ii) the optical response and en-ergy scale of the above anomalous behavior are the same as the SDW gap; (iii) the doping evolution of T∗ is similar to the SDW order; (iv) T∗ disappears in the underdoped region for Ba1−xKxFe2As2, while it sur-vives up to the optimally-doped and overdoped region in Ba(Fe1−xCox)2As2 and BaFe2(As1−xPx)2, respectively. These facts suggest that the phenomenon we observed is likely to arise from SDW fluctuations, and these fluc-tuations span different regions of the phase diagram for different doping types.36–40
Having attributed the observed anomalous behavior to SDW fluctuations, we now discuss its relation to nematic-ity in these compounds. In FeSCs, the electronic ne-maticity is characterized by anisotropic properties along the a and b axis.6–10,31 In the SDW state, anisotropic energy gap and density of states have been revealed by previous theoretical work.41 The yz orbital has fewer electronic states at the Fermi level than the xz orbital. Therefore, the optical response of the SDW order is affected by these anisotropic electronic states. In the detwinned Co-doped Ba122 FeSCs, anisotropic optical properties have been experimentally observed below and slightly above the SDW transition temperature.11–13 Al-though optical measurement on twinned crystals is not sensitive to the nematic order or fluctuations, we found that, as shown by the phase diagrams in Figs. 3, 4(u) and 4(v), T∗ follows the reported doping dependence of nematic fluctuations9,31 (yellow areas) quite well in all three series. This implies that SDW fluctuations and the nematicity are closed tied to each other. More in-terestingly, in Ba1−xKxFe2As2, where SDW fluctuations vanish in the underdoped region, nematic fluctuations disappear at approximately the same doping, while in BaFe2(As1−xPx)2, where SDW fluctuations exist up to the overdoped region, nematic fluctuations persist to the overdoped regime. These observations indicate that the SDW and nematic fluctuations are governed by the same physics in all three series, which is in favor of the spin-fluctuation-driven nematicity scenario.
The distinct doping dependence of T∗ in Ba1−xKxFe2As2, Ba(Fe1−xCox)2As2 and BaFe2(As1−xPx)2 may result from the complicated interaction between magnetism, nematicity and super-conductivity, which depends on doping types. Recently, in the hole-doped Ba122 FeSCs, a C4-symmetric magnetic phase has been revealed by the neutron scattering and thermodynamic experiments.20,42 This C4 magnetic phase exists at the boundary between the superconductivity and SDW magnetic order in the phase diagram, reflecting the strong competition between the magnetism, nematicity and superconductivity. In Ba1−xKxFe2As2, the termination of the nematic fluctu-ations in the underdoped regime is likely a direct result of the existence of this C4 state. T∗ also disappears at the same doping where the nematic order vanishes, suggesting the intimate relation between nematicity and SDW magnetism.
To summarize, we performed systematic opti-cal studies on three series of Ba122 single crys-tals, including Ba1−xKxFe2As2, Ba(Fe1−xCox)2As2 and BaFe2(As1−xPx)2. In the underdoped regime, optical ev-idence for strong SDW fluctuations has been revealed. As x approaches the optimal doping, this behavior
dis-appears in the K-doped compounds and becomes weaker in the Co- and P-doped compounds. By examining the doping evolution of the onset temperature of the SDW fluctuations, we found it agrees very well with the doping dependence of nematic fluctuations measured by other techniques. Our observations point to an intimate rela-tionship between magnetic fluctuations and nematicity, supporting the spin-fluctuation-driven namaticity sce-nario.5,20
This work was supported by NSFC, Grant No. U1530402. Work at IOP CAS was supported by MOST (973 Projects No. 2015CB921303, 2015CB921102, 2012CB921302, and 2012CB821403), and NSFC (Grants No. 91121004, 91421304, and 11374345).
Appendix A: Transport properties
Fig. 5(a) shows temperature dependence of the in-plane resistivity ρ(T ) for Ba1−xKxFe2As2. Resistivity of the undoped and underdoped compounds shows a sharp drop at TSDW and a metallic behavior below TSDW. For the superconducting compounds, such as BK40, ρ(T ) shows a sharp SC transition. Fig. 5(b) shows the mag-netic susceptibility as a function of temperature, mea-sured in a 10 Oe magnetic field. Tccan be defined by the onset of the zero-field-cooling diamagnetic susceptibility. Similarly, Fig. 5(c) and Fig. 5(d) display the transport properties in Ba(Fe1−xCox)2As2 and BaFe2(As1−xPx)2, respectively. 0 10 20 30 40 50 -1.0 -0.5 0.0 0 10 20 30 40 50 -1.0 -0.5 0.0 0 100 200 300 0 100 200 300 400 0 100 200 300 0 100 200 300 400 BK20BK23BK27 BK40 Ba 1-x K x Fe 2 As 2 (b) M / M ( 2 K ) T (K) BK16 BaFe 2 (As 1-x P x ) 2 (d) M / M ( 2 K ) T (K) BP30 BP50 BP23 Ba 1-x K x Fe 2 As 2 (a) ( c m ) T(K) BFA BK8 BK16 BK20 BK23 BK27 BK40 Ba(Fe 1-x Co x ) 2 As 2 (c) ( c m ) T (K) BC1.5 BC4 BC8
Figure 5. (Color online) Temperature dependence of (a) the in-plane resistivity and (b) the magnetic susceptibility in Ba1−xKxFe2As2. (c) Temperature dependence of the
in-plane resistivity in Ba(Fe1−xCox)2As2. (d) Temperature
de-pendence of the magnetic susceptibility in BaFe2(As1−xPx)2.
6
1
J. Paglione and R. L. Greene, Nature Physics 6, 645 (2010).
2
D. N. Basov and A. V. Chubukov, Nat. Phys. 7, 272 (2011).
3
D. S. Inosov, J. T. Park, P. Bourges, D. L. Sun, Y. Sidis, a. Schneidewind, K. Hradil, D. Haug, C. T. Lin, B. Keimer, et al., Nat. Phys. 6, 178 (2009).
4
P. Dai, J. Hu, and E. Dagotto, Nat. Phys. 8, 709 (2012).
5
R. M. Fernandes, A. V. Chubukov, and J. Schmalian, Nat. Phys. 10, 97 (2014).
6
J.-H. Chu, J. G. Analytis, K. De Greve, P. L. McMahon, Z. Islam, Y. Yamamoto, and I. R. Fisher, Science 329, 824 (2010).
7
M. Yi, D. Lu, J. J.-H. Chu, J. G. Analytis, A. P. Sorini, A. F. Kemper, B. Moritz, S.-K. Mo, R. G. Moore, M. Hashimoto, et al., Proc. Natl. Acad. Sci. 108, 6878 (2011).
8
M. A. Tanatar, E. C. Blomberg, A. Kreyssig, M. G. Kim, N. Ni, A. Thaler, S. L. Bud’ko, P. C. Canfield, A. I. Gold-man, I. I. Mazin, et al., Phys. Rev. B 81, 184508 (2010).
9
S. Kasahara, H. J. Shi, K. Hashimoto, S. Tonegawa, Y. Mizukami, T. Shibauchi, K. Sugimoto, T. Fukuda, T. Terashima, A. H. Nevidomskyy, et al., Nature 486, 382 (2012).
10
R. M. Fernandes and J. Schmalian, Supercond. Sci. Tech-nol. 25, 84005 (2012).
11
M. Nakajima, T. Liang, S. Ishida, Y. Tomioka, K. Kihou, C. H. Lee, A. Iyo, H. Eisaki, T. Kakeshita, T. Ito, et al., Proc. Natl. Acad. Sci. U. S. A. 108, 12238 (2011).
12
M. Nakajima, S. Ishida, Y. Tomioka, K. Kihou, C. H. Lee, A. Iyo, T. Ito, T. Kakeshita, H. Eisaki, and S. Uchida, Phys. Rev. Lett. 109, 217003 (2012).
13
A. Dusza, A. Lucarelli, F. Pfuner, J.-H. Chu, I. R. Fisher, and L. Degiorgi, EPL (Europhysics Lett. 93, 37002 (2011).
14
F. Kr¨uger, S. Kumar, J. Zaanen, and J. van den Brink, Phys. Rev. B 79, 054504 (2009).
15
W. Lv, J. Wu, and P. Phillips, Phys. Rev. B 80, 224506 (2009).
16
C.-C. Chen, J. Maciejko, A. P. Sorini, B. Moritz, R. R. P. Singh, and T. P. Devereaux, Phys. Rev. B 82, 100504 (2010).
17
I. Eremin and A. V. Chubukov, Phys. Rev. B 81, 024511 (2010).
18
C. Xu, M. M¨uller, and S. Sachdev, Phys. Rev. B 78, 020501 (2008).
19
R. M. Fernandes, A. V. Chubukov, J. Knolle, I. Eremin, and J. Schmalian, Phys. Rev. B 85, 024534 (2012).
20
S. Avci, O. Chmaissem, J. M. Allred, S. Rosenkranz, I. Eremin, a. V. Chubukov, D. E. Bugaris, D. Y. Chung, M. G. Kanatzidis, J.-P. Castellan, et al., Nat. Commun. 5, 3845 (2014).
21
I. I. Mazin, D. J. Singh, M. D. Johannes, and M. H. Du, Phys. Rev. Lett. 101, 057003 (2008).
22
K. Kuroki, S. Onari, R. Arita, H. Usui, Y. Tanaka, H. Kon-tani, and H. Aoki, Phys. Rev. Lett. 101, 087004 (2008).
23
H. Kontani and S. Onari, Phys. Rev. Lett. 104, 157001 (2010).
24
H. Kontani, T. Saito, and S. Onari, Phys. Rev. B 84, 024528 (2011).
25
W. Z. Hu, J. Dong, G. Li, Z. Li, P. Zheng, G. F. Chen, J. L. Luo, and N. L. Wang, Phys. Rev. Lett. 101, 257005 (2008).
26
G. Li, W. Z. Hu, J. Dong, Z. Li, P. Zheng, G. F. Chen, J. L. Luo, and N. L. Wang, Phys. Rev. Lett. 101, 107004 (2008).
27
R. P. S. M. Lobo, Y. M. Dai, U. Nagel, T. R˜o om, J. P. Carbotte, T. Timusk, A. Forget, and D. Colson, Phys. Rev. B 82, 100506 (2010).
28
Y. M. Dai, B. Xu, B. Shen, H. H. Wen, J. P. Hu, X. G. Qiu, and R. P. S. M. Lobo, Phys. Rev. B 86, 100501 (2012).
29
Y. M. Dai, B. Xu, B. Shen, H.-H. Wen, X. G. Qiu, R. P. S. M. Lobo, and R. P. S. M. Lobo, EPL (Europhysics Let-ters) 104, 47006 (2013).
30
Y. M. Dai, H. Miao, L. Y. Xing, X. C. Wang, C. Q. Jin, H. Ding, and C. C. Homes, Phys. Rev. B 93, 054508 (2016).
31
E. C. Blomberg, M. a. Tanatar, R. M. Fernandes, I. I. Mazin, B. Shen, H.-H. Wen, M. D. Johannes, J. Schmalian, and R. Prozorov, Nat. Commun. 4, 1914 (2013).
32
B. Shen, H. Yang, Z.-S. Wang, F. Han, B. Zeng, L. Shan, C. Ren, and H.-H. Wen, Phys. Rev. B 84, 184512 (2011).
33
F. Rullier-Albenque, D. Colson, A. Forget, and H. Alloul, Phys. Rev. Lett. 103, 057001 (2009).
34
Z. R. Ye, Y. Zhang, F. Chen, M. Xu, Q. Q. Ge, J. Jiang, B. P. Xie, and D. L. Feng, Phys. Rev. B 86, 035136 (2012).
35
C. C. Homes, M. Reedyk, D. A. Cradles, and T. Timusk, Appl. Opt. 32, 2976 (1993).
36
S. D. Wilson, Z. Yamani, C. R. Rotundu, B. Freelon, P. N. Valdivia, E. Bourret-Courchesne, J. W. Lynn, S. Chi, T. Hong, and R. J. Birgeneau, Phys. Rev. B 82, 144502 (2010).
37
F. L. Ning, K. Ahilan, T. Imai, A. S. Sefat, M. A. McGuire, B. C. Sales, D. Mandrus, P. Cheng, B. Shen, and H.-H. Wen, Phys. Rev. Lett. 104, 037001 (2010).
38
Y. Nakai, T. Iye, S. Kitagawa, K. Ishida, H. Ikeda, S. Kasahara, H. Shishido, T. Shibauchi, Y. Matsuda, and T. Terashima, Phys. Rev. Lett. 105, 107003 (2010).
39
Z. Li, D. L. Sun, C. T. Lin, Y. H. Su, J. P. Hu, and G.-q. Zheng, Phys. Rev. B 83, 140506 (2011).
40
S. J. Moon, Y. S. Lee, A. A. Schafgans, A. V. Chubukov, S. Kasahara, T. Shibauchi, T. Terashima, Y. Matsuda, M. A. Tanatar, R. Prozorov, et al., Phys. Rev. B 90, 014503 (2014).
41
Z. P. Yin, K. Haule, and G. Kotliar, Nat. Phys. 7, 294 (2011).
42
A. E. B¨ohmer, F. Hardy, L. Wang, T. Wolf, P. Schweiss, and C. Meingast, Nat. Commun. 6, 7911 (2015).
![[PDF] Cours avancé sur GIMP : Menus et icônes | Formation informatique](data:image/gif;base64,R0lGODlhAQABAIAAAP///wAAACH5BAEAAAAALAAAAAABAAEAAAICRAEAOw==)