Journal of Dairy Research (1984), 51, 103-111 Printed in Great Britain 1 0 3
Effect of calcium on the hydration of casein. I. Water vapour
sorption and fine structure of calcium caseinates compared with
sodium caseinates in the pH range 4-6-80
BY MAX RUEGG AND URSULA MOOR
Federal Dairy Research Institute, CH-3097 Liebefeld, Switzerland (Received 31 March 1983 and accepted for publication 7 July 1983)
SUMMARY. Hydration of Ca and Na caseinates which were prepared from whole casein at different pH levels (range 4-7-8-0) was determined by means of water vapour sorption measurements in the water activity (aw) range O58-O95. Water uptake of
Ca caseinates was systematically lower than that of Na caseinates prepared at equal pH, the differences increasing with increasing pH and aw. Plots of the water content v. the amount of added hydroxide at constant aw revealed a linear relationship
between water uptake and cation content, suggesting that the increase in water uptake is mainly determined by the amount and type of cations associated with the caseins. In the aw range tested, Ca2+ adsorbed about 2-7 and Na+ 3-18 mol water/mol
of cation. This implies that replacement of one mol of casein-bound Na+ by Ca2+ is accompanied by a displacement of 1-11 mol water at aw 0-58-0-95. The loss of water
is a consequence of conformational changes induced by the chelating and cross-linking effects of Ca2+, which also lead to micelle formation.
The interaction between Ca and caseins plays a key role in the formation and structure of casein micelles. It also influences the behaviour of the caseins during the manufacture of milk products. The most striking effects of the binding of the divalent ion to whole casein, or its principal components, asl- and /?-casein, are the aggregation
and the decrease in solvation. Isolated /c-casein, which comprises about 14 % of whole bovine casein, differs somewhat in its behaviour. It remains soluble even at high concentrations of Ca2+. In the presence of the divalent ion, /c-casein forms micelles with either asl- or /?-casein, stabilizing the latter against precipitation. Ca-induced
aggregation and precipitation of caseins have been investigated in great detail using a variety of methods. However, little information is available on Ca-induced changes in hydration. A decrease in the amount of solvation water has been observed when Ca2+ was added to purified caseins (Waugh et al. 1971; Slattery & Waugh, 1973) or casein micelle suspensions in dilute solutions (Green & Marshall, 1979). Also, a negative correlation has been found between the Ca content of casein micelles and their solvation (Sood et al. 1979a, b).
Ca-binding by caseins is pH-dependent (Carr, 1953; Zittle et al. 1958; Dickson & Perkins, 1971). A pH increase is generally accompanied by a greater Ca-binding capacity. Also, a pH shift is observed upon Ca-binding by caseins, due to the displacement of protons (Kiermeier, 1952; Kiermeier & Galanos, 1957; Waugh et al. 1971). The solvent systems used to study the influence of pH on Ca-binding and hydration usually contained both Ca2+ and monovalent cations, mainly Na+.
Therefore, the changes in hydration observed were to some extent caused by the transformation of Na into Ca caseinate. A study of the water-binding properties of the pure caseinates is an essential preliminary to a better understanding of the way in which Ca2+ interacts with casein and influences its hydration. Furthermore, it seems worthwhile to make this type of study not only in dilute solutions but also in semi-dry systems with reduced water activity (aw). Various milk products in which
the interaction of Ca with casein is important have low aw levels compared with those
of most model systems used in the past.
The present paper is concerned with hydration of pure Ca and Na caseinates in the aw range O58-0-95. Water vapour sorption was measured as a function of pH
and water activity, using isopiestic techniques. In addition, the fine structure of the caseinates was studied by transmission electron microscopy.
MATERIALS AND METHODS Materials
Whole casein was prepared from milk of Simmental cows by acid precipitation. With vigorous stirring diluted skim-milk was slowly brought to pH 4-6 using 5 % acetic acid. The precipitate was washed 3 times with deionized water and redissolved in water at pH 70 with the aid of 2 M-NaOH. After removing undissolved particles by filtration the precipitation procedure was repeated twice and the final preparation lyophilized. Electrophoretic examination on polyacrylamide gel (Groves & Kiddy, 1968) revealed a mean composition of 47 % as-, 38 % /?-, 15 % <-, and 14 % y-casein.
The acid casein contained 75/tmol Ca, 13/miol Mg, 500/jmol Na, 41 /tmol K and 25 /imo\ P/100 g dry protein. The cations were analysed by atomic absorption spectrophotometry after mineralization in hot 65 % nitric acid. Phosphorus content was measured using a standard photometric method (Schweizerisches Lebensmittel-buch, 1969).
To obtain Ca and Na caseinates at various pH levels, 5 g portions of acid casein were dispersed in 50 ml water and 0-01 M-Ca(0H)2 or 0-1 M-NaOH were added. The
suspensions were allowed to equilibrate over 3 d and then lyophilized. The pH range tested (pH 4-7 to about 80) corresponded to a cation content of 0-07-45 mmol Ca or 0-50-84 mmol Na/100 g dry casein.
Methods
Water sorption measurements. Water vapour sorption isotherms at 25-0+ 0 1 °C
were determined using an isopiestic method. The apparatus and technique of this method are described in detail by Gal (1975) and Gal & Hunziker (1977). The following saturated salt solutions were used to obtain equilibrium water contents in the water activity range 0-58-0-95: NaBr (aw = 0-576 + 0-004), KI (0-689 + 0-002),
NaCl (0-753 + 0-001), KC1 (0-843+ 0003), CaCl2 (0-902), and KN03 (0-936±0006)
(Stokes, 1949; Greenspan, 1977). The highest humidity level (0-950 + 0-001) was produced with a sulphuric acid solution (Riiegg, 1980). In preliminary measurements, the dry samples were exposed directly to each humidity (integral sorption). This procedure was found not to be suitable because of extremely long equilibration times and irregular weight gain curves. Better results were achieved by increasing the humidity stepwise from the lowest to the highest level at 7-d intervals (differential sorption). The values of equilibrium water content are based on the dry weight obtained after heating for 6 h at 60 °C in a vacuum oven and subsequent cooling over
Hydration of caseinates 105
Mathematical analysis of sorption data. The sorption equation according to themodel of Guggenheim, Anderson and de Boer, (G.A.B. equation), proposed for food materials by van den Berg (1981), has been used to fit an isotherm to the experimental points. This 3-parameter equation can be rearranged into a second degree polynomial and is then mathematically identical to the isotherm equation derived from the model of Hailwood & Horrobin (1946):
(W: water uptake on dry basis; a, ft, y. coefficients related to number of primary sorption sites, heat of sorption and factor correcting properties of water in multi-layers). Regression analyses were made using BMDP computer programs (BMDP Statistical Software 1981, University of California Press, Berkeley, CA, USA) and special plots were drawn with the aid of DISSPLA subroutines (DISSPLA Version 8-2, Integrated Software Systems Corp., San Diego, CA, USA.)
Electron microscopy. The caseinates were fixed with glutaraldehyde and acrolein
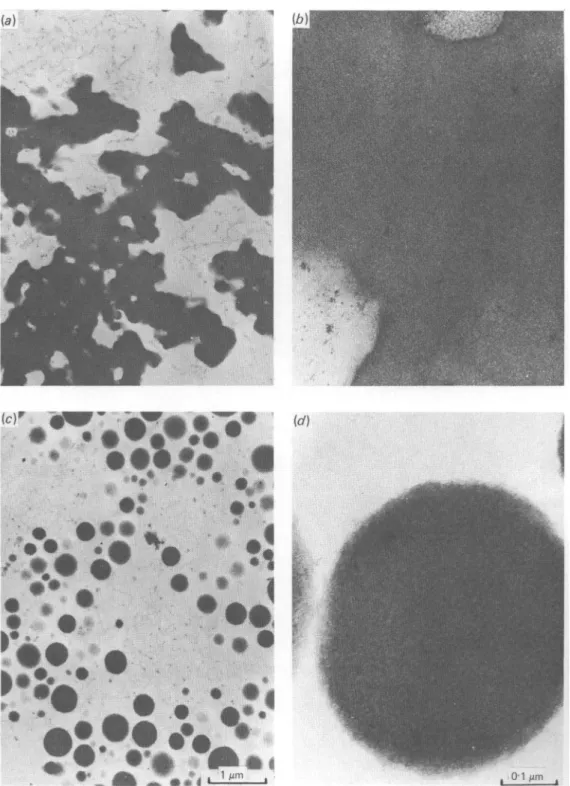
and embedded in agar for better handling during the dehydration and epoxy resin embedding procedure (Blanc et al. 1980). The very fine agar fibrils are visible in the electron microscope but can clearly be distinguished from casein aggregates (Fig. 1). The procedure of Goldsmith (1967) was used to estimate the distribution of casein particles from the distribution of their cross-sections observed in the electron microscope. (A slice thickness of 30 nm was assumed).
RESULTS AND DISCUSSION
When Ca(OH)2 was added to the suspension of whole casein a colloidal dispersion
of spherical particles was formed above a pH of about 5-8. The Ca caseinate particles had a volume/surface average diam. of dvs = 380 nm. (The observed number-average
diam. was 200 nm.) The distribution width, expressed as coefficient of variation of
dvs, was 54%. Fig. 1 shows electron micrographs typical for the undissolved Ca
caseinate in the pH region before and after formation of a colloidal dispersion. The material in the pH range 4-6 to ~ 57 appears mostly homogeneous. The spherical particles showed a substructure, but not as pronounced as natural and artificial micelles which also contain phosphate and citrate (Schmidt et al. 1974; Knoop et al. 1979).
During the course of titration with NaOH the casein gradually dissolved. Compared with the individual casein components (Bingham, 1971) the solubilization of whole casein occurred at higher pH values. The solubility increased from about 0-05 mg/ml at pH 5-7 to 20 mg/ml around pH 60.
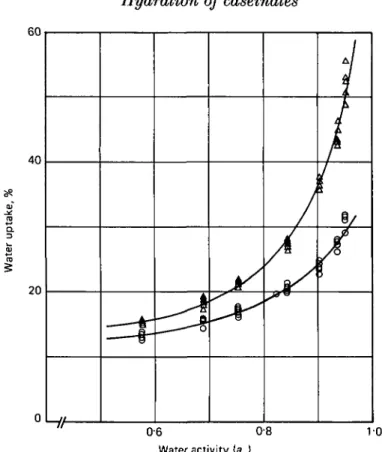
At the same pH levels, the Na caseinates always absorbed a higher amount of water than in Ca caseinates. Fig. 2 shows 2 water sorption isotherms typical for the caseinates in the aw range 0-55-095. The difference between the water uptake
of Na and Ca caseinate increased with increasing pH and aw. This can be clearly seen
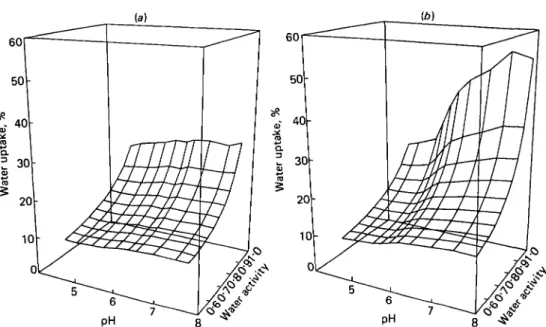
in Fig. 3, where the measured sets of isotherms are represented in 3-dimensional plots. The surface formed by the isotherms of Ca caseinates if flat over the whole range tested compared with that for Na caseinates.
The curves parallel to the pH axis in Fig. 3 represent isopsychric lines. They are not smooth because they were drawn by connecting points, representing equal a^-levels, on the regression lines of the isotherms. Two isopsychric functions, one for a medium and the other for a high water activity, are shown in detail in Fig. 4. In
(c)' (c/)
• * • % • . •
• -
•i
Fig. 1. Electron micrographs of Ca caseinates. (a) and (6) Fine structure of insoluble Ca caseinate at pH 5-1 (0-033 mmol Ca/g casein), typical for the samples in the pH range of 4-6 to 5-8 (0-002 to ~ 0-18 mmol Ca/g casein), (c) and (d) Micelles of Ca caseinate at pH 6-1 (0-24 mmol Ca/g casein), typical for the dispersions formed in the approximate pH range 5-8-80 (018-0-45 mmol Ca/g casein).
Hydration of caseinates
107
60 40 20 ft / A / / 8/ 0 6 0 8 10Water activity [ajl
Fig. 2. Water sorption isotherm of Ca and Na caseinate at 25 °C and pH 7-5. The curves correspond to the G.A.B.-isotherm obtained by regression analysis. A, Na caseinate; O, Ca caseinate.
the pH range 4-6 to about 5*5, the water uptake by the 2 caseinates was not significantly different. At higher pH levels, however, the isopsychric curves begin to separate. The separation coincides with the formation of Ca caseinate micelles.
In Figs 2 and 3 the comparison of water absorption by caseinates is made in relation to pH. It must be considered that in the case of Ca and Na caseinate an equal degree of protonization represents a difference in cation content of a factor of about 2. Therefore, it is meaningful to discuss the water sorption capacity of the caseinates also as a function of the amount of cation associated with the proteins. The data in Fig. 4 (a) have been replotted in Fig. 4(6) as a function of the concentration of Ca and Na in units of mmol/g dry and cation-free casein. The experimental points now apparently follow a straight line. This phenomenon has already been observed for Na caseinates and casein hydrochlorides in a limited aw and pH range (Signer & Gal,
1961; Riiegg & Blanc, 1976). Linear least squares regression lines are drawn in Fig. 4(6). Although close inspection of the residuals of the regression analysis indicated a sigmoid shaped isopsychric curve, the deviation from linearity was not statistically significant. The slope and intercept values for the regression lines are given in Table 1. The intercept corresponds to the water content of whole casein at pH 4-7, before the addition of hydroxide. The slope values represent the contribution of the protein-bound cations. The apparently linear relationship suggests that the increase in water uptake is mainly determined by the amount and type of cations bound by whole casein. The amount of water associated with the peptide chain seems to play a minor role. The slope values thus are an estimate of the hydration of the casein-bound cations in units of g water/100 mmol of Ca2+ or Na+.
(a) U»
Fig. 3. Water uptake of (a) Ca and (6) Na caseinates in the high o^-range as a function of pH at 25 °C. The 2 sets of sorption isotherms (water content v. aw functions) were obtained by regression analysis
of the experimental points and represent G.A.B.-functions (details are given in the experimental section). Water content v. pH curves in the surface are isopsychric lines.
a 60 40 20 20
t
-©§if
A S « = -A—*" a » = Ai
0902 -tr-0576 pH 0 0 0-2 0-4 0-6 0-8 Ca or Na, mmol/g casein10
Fig. 4. Isopsychric curves for Ca and Na caseinates at 25 °C. (a) Water uptake at aw = 0-576 and 0-902
as a function of pH. (6) Same data plotted as a function of the amount of Ca(0H)2 and NaOH added
to isoelectric whole casein. Linear least squares regression lines are shown for the data in Fig. 4(6). Arrows point to the region of formation of Ca caseinate micelles. (Ordinate: water content on dry and metal-free basis). A, Na caseinate; O, Ca caseinate.
Hydration of caseinates
109
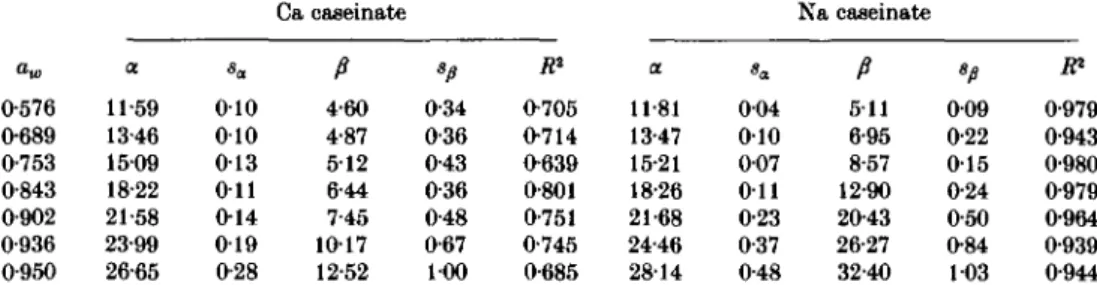
Table 1. Isopsychric lines for Ca and Na caseinates. Regression coefficients of the
apparent linear relationship between water uptake (W) at 25 °C and molar concentration of cations (c); W = a + /?. c* Ca caseinate Na caseinate 0-576 0-689 0-753 0-843 0-902 0-936 0-950 a 11-59 13-46 1509 18-22 21-58 23-99 26-65 010 010 0 1 3 O i l 0 1 4 0 1 9 0-28 P 4-60 4-87 512 6-44 7-45 1017 12-52 0-34 0-36 0-43 0-36 0-48 0-67 100 fl2 0-705 0-714 0-639 0-801 0-751 0-745 0-685 a 11-81 13-47 15-21 18-26 21-68 24-46 2814 004 010 007 O i l 0-23 0-37 0-48 P 511 6-95 8-57 12-90 20-43 26-27 32-40 */» 009 0-22 0 1 5 0-24 0-50 0-84 103 0-979 0-943 0-980 0-979 0-964 0-939 0-944 * Water uptake (W) in g/100 g dry and cation-free protein; cation concentration in mmol/g protein. sa, Sp, standard deviations. .ft2, coefficient of determination. o O •5 "S _Q 8 20 -1-0 Water activity (a
Fig. 5. Hydration of Ca2+ and Na+ in caseinates in the aw-range 0-58-0-95, compared with the hydration
of the corresponding chlorides and NaOH. The sorption isotherms for the individual cations in the caseinates were estimated from the slopes of the isopsychric curves (see Fig. 4(6) and Table 1). The isotherms for the chlorides and for NaOH were calculated from data of Robinson & Stokes (1959). 1, CaCl2; 2, NaCl; 3, NaOH; 4, Na+ (caseinate); 5, Ca2+ (caseinate).
It is interesting to note that the hydration of casein-bound Na+ is systematically higher than that of Ca2+. This can clearly be seen in Fig. 5, which shows the water sorption isotherms of the casein-bound cations. (The slope values in Table 1 have been recalculated on a molar basis and plotted against the water activity). For comparison, water uptake of NaCl, NaOH and CaCl2 has been calculated from other data
(Robinson & Stokes, 1959) and the corresponding curves included in Fig. 5. In protein-free aqueous salt solutions, primary hydration numbers for Ca2+ are systematically greater than for Na+. From entropy and ion-mobility data, the number of tightly bound water molecules in a first shell has been estimated as 7-12 for Ca2+ and 2-4 for Na+ (see e.g. review by Kortiim, 1962). Ions of high charge density usually increase
the order of the water structure and have higher primary hydration numbers. The different situation in caseinate systems can be explained by the chelating and cross-linking effect of Ca2+. For steric reasons, water is displaced from the primary and secondary shell of hydration of Ca2+ after binding to deprotonized groups at protein side chains. The chelating and cross-linking effects eventually lead to micelle formation. Hydrophobic interactions are also important in the polymerization process as electrostatic repulsion is reduced by Ca2+-binding (Slattery, 1979).
Fig. 5 also shows that the difference between the hydration of Ca2+ and Na+ in caseinates increases from about 1 to 11 mol water/mol cation in the aw range 070-095.
We are grateful to Dr P. Bican for the electrophoretic analysis, to Mr P. Schmitz (Institut fur Tieranatomie, Universitat Bern) for cutting the ultra-thin sections and to the analytical section of our Institute for chemical analyses.
REFERENCES
BlNQHAM, E. W. 1971 Influence of temperature and pH on the solubility of a,,-, fi- and /(-casein. Journal of
Dairy Science 54 1077-1080
BLANC, B., FLUCKIGER, E., RUEGG, M. & STEIGBR, G. 1980 [Changes in biochemical, physical, technological
and sensory properties of UHT milk during storage.] Alimenta (Sonderausgabe 1980) 27-47
CARR, C. W. 1953 Studies on the binding of small ions in protein solutions with the use of membrane electrodes. IV. The binding of calcium ions in solutions of various proteins. Archives of Biochemistry and Biophysics 46 424-431
DIOKSON, I. R. & PERKINS, D. J. 1971 Studies on the interactions between purified bovine caseins and alkaline earth metal ions. Biochemical Journal 124 235-240
GAL, S. 1975 Recent advances in techniques for the determination of sorption isotherms. In Water Relations
of Foods pp. 139-154 (Ed. R. B. Duckworth) London: Academic Press
GAL, S. & HUNZIKER, M. 1977 [Sodium chloride binding capacity of casein at high water activities. Studies using a new isopiestic sorption apparatus.] Afakromolekulare Chemie 178 1535-1544
GOLDSMITH, P. L. 1967 The calculation of true particle size distributions from the sizes observed in a thin slice.
British Journal of Applied Physics 18 813-830
GREEN, M. L. & MARSHALL, R. J. 1979 Interaction of ionic materials with casein micelles. Journal of Dairy
Research 46 365-367
GREENSPAN, L. 1977 Humidity fixed points of binary saturated aqueous solutions. Journal of Research of the
National Bureau of Standards 81A 89-96
GROVES, M. L. & KIDDY, C. A. 1968 Polymorphism of y-casein in cow's milk. Archives of Biochemistry and
Biophysics 126 188-191
HAILWOOD, A. J. & HORROBIN, S. 1946 Absorption of water by polymers: analysis in terms of a simple model.
Transactions of the Faraday Society 42B 84-102
KIERMEIER, F. 1952 [Foods as ion exchangers. II. On the reaction of calcium salts in aqueous casein suspensions.] Zeitschrift fur Lebensmittel-Uniersuchung und -Forschung 95 85-89
KIERMEIER, F. & GALANOS, D. S. 1957 [Foods as ion exchangers. VI. Exchange of casein cations on addition of calcium chloride.] Zeitschrift fur Lebensmittel-Uniersuchung und -Forschung 106 109-116
KNOOP, A.-M., KNOOP, E. & WEICHEN, A. 1979 Sub-structure of synthetic casein micelles. Journal of Dairy
Research 46 347-350
KORTUM, G. 1962 Lehrbuch der Elektrochemie, 3rd edn p. 121. Weinheim/Bergstr.: Verlag Chemie
ROBINSON, R. A. & STOKES, R. H. 1959 Electrolyte Solutions, 2nd edn pp. 476, 478,510. London: Butterworths RUEGG, M. 1980 [Calculation of the activity of water in sulphuric acid solutions at various temperatures.]
Lebensmittelwissenschaft und Technologie 13 22-24
RUEGG, M. & BLANC, B. 1976 Effect of pH on water vapor sorption by caseins. Journal of Dairy Science 59 1019-1024
SCHMIDT, D. G., VAN DER SPEK, C. A., BUCHHEIM, W. & HINZ, A. 1974 On the formation of artificial casein micelles. Milchwissenschaft 29 455-459
SCWEIZERISCHES LEBENSMITTELBUCH. 1969 Vol. II, chapter 1, method 28
SIGNER, R. & GAL, S. 1961 [Study of the binding of sodium and chloride ions by casein with water vapour sorption measurements.] Makromolekulare Chemie 44-46 259-268
SLATTERY, C. W. 1979 A phosphate-induced sub-micelle-micelle equilibrium in reconstituted casein micelle systems. Journal of Dairy Research 46 253-258
SLATTERY, C. W. & WAUGH, D. F. 1973 Cation binding to /?-casein. A comparison of electrostatic models.
Hydration of caseinates 111
SOOD, S. M., GAIND, D. K. & DEWAN, R. K. 1979a Correlation between micelle solvation and calcium content.
New Zealand Journal of Dairy Science and Technology 14 32-34
SOOD, S. M., SIDHU, K. S. & DEWAN, R. K. 19796 Heat stability and the voluminosity and hydration of casein micelles from milk of different species. New Zealand Journal of Dairy Science and Technology 14 217-225 STOKES, R. H. 1949 Standard solutions for humidity control at 25 °C. Industrial and Engineering Chemistry
41 2013
VAN DEN BERG, C. 1981 Vapour sorption equilibria and other water-starch interactions; a physico-chemical approach pp. 106-110. Thesis, Agricultural University, Department of Food Science. Wageningen, The Netherlands
WAUGH, D. F., SLATTERY, C. W. & CREAMER, L. K. 1971 Binding of cations to caseins. Site binding, Donnan binding, and system characteristics. Biochemistry 10 817-823
ZITTLE, C. A., DELLAMONICA, E. S., RUDD, R. K. &CUSTER, J. H. 1958 Binding of calcium to casein: influence