Sorption, Desorption and Exchange of Cesium on Glaciofluvial Deposits
By A. Grütter', H. R. von Gunten'-^, M. Kohler^'^ and E. Rössler'' Paul Scherrer Institut, CH-5232 Villigen PSI, Switzerland
^ Laboratorium für Radiochemie, Universität Bern, CH-3000 Bern, Switzerland ^ Now at Stanford University, Stanford, CA, USA
(Received August 23,1989)
Sorption / Cesium / Distribution ratlos /
Glacioßuvial deposits / Clays, synthetic groundwater
Summary
Distribution ratios and isotherms for Sorption, desorption and isotope-exchange of cesium (labelled with Cs-137) were mea-sured on grain size fractions ( < 2 m m ) of quatemary glaciofluvial deposits. Sediment materiais from two locations within Switzerland and synthetic groundwaters of different com-positions were used. The investigated concentration ränge for cesium was 1 0 " " — 1 0 " ' M . Cesium introduced into the system with the solid phase may influence the measurements at the lowest concentrations.
Depending on the experimental conditions, the distribution ratios vary between 3 and 30'000 ml/g. The isotherms are non-linear. Normalization of the cesium concentration in the solid with the cation-exchange capacity leads to nearly identical iso-therms for all size fractions of the two geographic locations. Desorption and exchange are retarded at the higher cesium concentrations. This can be explained by structural changes in clay minerals which dominate the Sorption of cesium on this material. Variations in the composition of the groundwater influ-ence the Sorption of cesium only sHghtly; potassium and hydro-gen ions are the main competitors.
1. Introdnction
The use of nuclear energy and the application of radio-nuclides in research, technology and medicine has led to a rise in the radioactive contamination of the vironment. Radioactive pollution may eventually en-danger the biosphere and the food chains. In the latter, drinking water plays an important role in the exposure pathway for many radionuclides [1], Drinking water is recovered in the alpine and peri-alpine regions to a large extent from shallow aquifers in unconsolidated deposits of quatemary glaciofluvial origin. It is, there-fore, important that one leams to understand the pro-cesses and mechanisms of interactions between radio-nuclides and the solid materiais in these aquifers. Cat-ionic species of radionuclides may be sorbed on the aquifer material by processes such as ion-exchange, precipitation or surface interaction, thus retarding their transport by or even eliminating them from the groundwater.
Cesium-135 and -137 are among the most hazard-ous nuclides due to their long half-lives and the high solubilities of most cesium Compounds. The Solution chemistry of cesium is simple and suitable for investi-gations of sorption processes, even in complex natural
systems. A review of the abundant literature on the Sorption of cesium on a variety of minerals and rocks was given by Andersson and Allard [2]. U p to now only a relatively small number of investigations [3 — 6] on the sorption of cesium were performed with materiais from unconsolidated deposits. However, the compositions and mineralogy of these materiais and the groundwater quality were different from those of alpine and peri-alpine regions. Furthermore, the sorption of cesium was investigated only at one or a few concentrations. A better understanding of pro-cesses governing sorption, desorption and isotope-ex-change is reached by measurements of sorption iso-therms. The knowledge of the sorption and desorption behaviour for a large concentration ränge of cesium and for different groundwater compositions is also of practical importance, since the concentrations of cesium and groundwater components may vary during an accident Situation.
2. Experimental M a t e r i a l s
The glaciofluvial sediments containing drinking water resources cover large areas of the peri-alpine plaines of Switzerland. They consist of gravel, sand, silt and clay. Materials were taken from two geographic lo-cations. They were deposited by 2 different glaciers during the ice age and subsequently transported and rearranged by rivers. The samples were taken from the water-saturated part of a core drilled at Glattfelden (20 km north of Zürich) and from a gravel pit at Rubigen (15 km southeast of Bern).
The samples were size fractionated by wet sieving and Sedimentation. Those with sizes > 32 um were cleaned from adhering fines by ultrasonic treatments. The weight distributions and the cation-exchange ca-pacities ( Q are shown in Table 1. A sample of < 32-Hm material from Glattfelden taken at a depth of 12 — 12.4 m was separated into smaller size fractions. The weight distribution of this material refers only to the <32-|im material. The cation-exchange capacities were measured by sodium Saturation in 1 M solutions of sodium acetate according to the procedure of Chap-man [7], modified for small samples using Na-22. At small grain sizes the cation-exchange capacity de-creases with increasing grain size. However, at larger
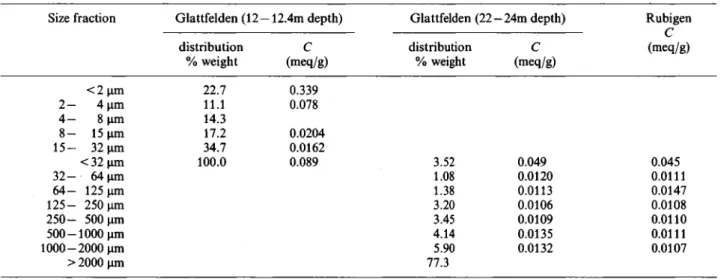
Table 1. Weight distributions (%) and cation-exchange capacities (C) of unconsolidated materials
Size fraction Glattfelden (12-- 12.4m depth) Glattfelden (22--24m depth) Rubigen C (meq/g) Size fraction distribution % weight C (meq/g) distribution % weight C (meq/g) Rubigen C (meq/g) < 2 um 22.7 0.339 2— 4 um 11.1 0.078 4 - 8 um 14.3 8 - 15 um 17.2 0.0204 1 5 - 32 um 34.7 0.0162 < 3 2 um 100.0 0.089 3.52 0.049 0.045 3 2 - 64 um 1.08 0.0120 0.0111 6 4 - 125 um 1.38 0.0113 0.0147 1 2 5 - 250 um 3.20 0.0106 0.0108 2 5 0 - 500 um 3.45 0.0109 0.0110 500-1000 tim 4.14 0.0135 0.0111 1000-2000 um 5.90 0.0132 0.0107 >2000^m 77.3
Table 2. Mineralogical composition (%) of selected size fractions (Tj. Peters and Ch. Buehler: private communication) Glattfelden (drill cores) Rubigen (gravel pit) 1 2 - 1 2 . 4 mdepth 2 2 - 2 4 mdepth < 2 um 1 5 -32 ^m < 32 ^m < 32 um 3 2 -64 |im 6 4 -125 ^m <32 um 3 2 -64 um 3 2 6 4 -64 um* 125 um* Illite 30 3 19 9 6 8 11 7 25** 11** Chlorite 16 2 11 5 4 5 4 3 25 14 Montmorillonite 9 — 2 1 — — — — — Kaolinite 2 - - - -Quartz 11 30 22 31 53 55 24 41 — — Calcite 26 31 16 36 22 21 52 33 — -Dolomite 3 28 17 7 4 4 1 1 — — Albite 3 5 9 11 9 5 8 9 — — K-Feldspar - - 4 - 2 2 - 4 C (meq/g) 0.339 0.0162 0.089 0.049 0.0120 0.0113 0.045 0.0111 0.1111 (1.1(19 * Magnetically separated fractions (composition determined by microscopy): The rest of these fractions is made up of weathering
products + opaque minerals + hydroxides (32%, 61%), heavy minerals such as Pyroxene, Epidote and Zircone (13%, 9%) and Hornblende (5%, 5%).
** Biotite makes up 80% of this illite.
grain sizes it is nearly constant. This is probably due to the fact that the macropores of the large grains remained at least partly filled with fine grained ma-terial. The mineralogical compositions of selected size fractions are presented in Table 2 which shows, that the clay minerals are enriched in the finest fractions and in the magnetically separated samples. Illite + biotite, and chlorite are the most abundant clay min-erals.
S y n t h e t i c g r o u n d w a t e r
Synthetic groundwater with the following compo-sition (in meq/litre) was used for the majority of the experiments: Ca^ +, 4.50; Mg^+, 1.69; Na+, 0.67; K , 0.084; S O r , 0.57; Cl", 0.74; N O J , 5.21; alkalinity, 0.42; pH, 7.9. It is typical for the composition of groundwaters of calcite-rich aquifers except that the
bicarbonate ion was replaced to a large extent by nitrate to allow experimenting at ambient CO2 pres-sure. It is slightly undersaturated with respect to cal-cite. The composition of the synthetic groundwater was varied in the experiments dealing with the influ-ence of the water chemistry. The details are given in the 3rd section of "Results and discussion".
P r o c e d u r e
A batch method was used: between 50 and 200 mg of solid material (0.5—2.0 g of the 1 — 2 mm size fraction) were contacted with 20 ml of synthetic groundwater in a 40-ml polyallomer centrifuge tube closed with a screw cap. The weighed solid material remained within this tube throughout the sequence: (1) pretreatment, (2) Sorption and (3) desorption or exchange. The samples with materials < 32 um were shaken on a
mechanical shaker, those of larger sizes were turned head-over-end at 1 rpm to avoid mechanical abrasion. After each step they were centrifuged at 12000 rpm in swing-out head of a cooling centrifuge. The small amount (0.1 — 0.5 ml) of Solution remaining in the cen-trifuge tube after Separation of the phases was deter-mined by weighing. The activity of the Cs-137 tracer was measured on a Ge(Li)-detector, using 5-ml ali-quots of the solutions.
Düring the pretreatment (three treatments of 2 — 5 days each) the solid material was equilibrated with the synthetic groundwater. After Separation of the phases 20 ml of a new Solution were added. The con-centrations of the major cations and the p H changed only slightly during this equilibration. For the Sorp-tion Step, synthetic groundwater containing cesium in the concentration ränge of 10"® —10~^M and labelled with Cs-137 was added to the samples. For the desorption step "cesium free" ( < 10~'° M) synthetic groundwater was added. For most experiments, times of 7 and 28 days were used. The results for 7 and 28 days did not differ significantly except for the 1 — 2 mm size fraction, for which the duration was ex-tended to 100 days. In the exchange experiments, samples of < 32-nm material were exposed for 7 days to synthetic groundwater containing 10"® M cesium labelled with Cs-137, thus loading the solid material with labelled cesium at a low concentration. After Separation of the phases, this material was contacted for another 7 days with synthetic groundwater con-taining non-labelled cesium in the concentration ränge of l O ' ^ - l O ' ^ ^ M . All data shown in the Figures 1 — 7 are mean values of parallel samples.
C a l c u l a t i o n s
The following formulae were used for the calculation of the distribution ratios:
—
w
An
V-^aq.n - V,,. (1)
Ro_„ is the distribution ratio for cesium, As,„ the radio-activity of Cs-137 per gram of solid material and the radioactivity of Cs-137 per ml of Solution at the end of Step n; At,„ is the total radioactivity of Cs-137 and Vt,„ the total volume of Solution (ml) in the system;
w is the weight (g) of solid material. n denotes the step
in the sequence Sorption, 1 st desorption, 2nd desorp-tion, etc. The total volume of Solution is given by
+ ( 2 )
the total radioactivity for the sorption step (subscript ad)by
(3) and for all subsequent steps by
A n = ^,.„-1 - - (4) F„ is the amount of Solution (ml) added at the
begin-ning and A V„ the amount of Solution (ml) in the tube at the end of step n; is the radioactivity per ml of the Solution added at the beginning of the sorption Step. For small distribution ratios and for the multiple desorption experiments the calculations were performed in reversed order:
A,n = + AV„). (5)
If n refers to the last step, then +1 is the separately determined radioactivity which remained in the centri-fuge tube after the Separation of the phases at the end of the experiments.
The following formulae apply for sorption and desorption. They are only valid under equilibrium con-ditions.
[CsU„ = [CsLVd- fn
[Cs]s,„ — Ro.n • [Cs]aq,„.
(6) (7)
[ C s ] a q , „ is the molar cesium concentration in the
Solu-tion and [ C s ] s , „ the concentration of cesium in the solid
(meq/g) at the end of step n. [Cs]aq,ad is the cesium concentration in the Solution added at the beginning of the sorption step. The correction factor/represents the change in specific radioactivity of Cs-137 during the experiment and is given by
/ =
[Cs]°q.ad- Fa, -f 1. (8)
[Cs]f is the concentration of exchangeable cesium in the solid material at the beginning of the sorption step and was determined as follows: the concentration of total cesium was measured in a Solution with very low cesium content using neutron activation analysis. By inserting this value in equation (6) the correction factor / and subsequently with (8) [Cs]° was deter-mined. Using this value, / was then calculated for all other cesium concentrations. The same correction factor applied for sorption and desorption due to the very low cesium concentration in the synthetic ground-water added at the beginning of the desorption step. In this case, equations (6) and (7) are valid for desorp-tion also if equilibrium is not reached. The uncorrected results presented in Figures 1 and 7 were obtained by setting / = 1 at all concentrations. This leads to operational quantities, if the exchangeable cesium in-troduced with the solid contributes significantly to the total amount of cesium in the system, i.e. i f / > 1. The influence of exchangeable cesium in the solid on the data will be discussed in the last section of "Results and discussion".
The cesium concentrations at the end of the ex-change experiments (subscript ex) were calculated in the following manner: The point on the sorption iso-therm corresponding to the total amount of exchange-able cesium in the system (right hand side of equation 9) was determined by iteration.
[CsL,ex-H' + [Cs]aq.ex-I^..« (9) = [Cs]s.ad • W + [Cs]aq.ad + [Cs]aq
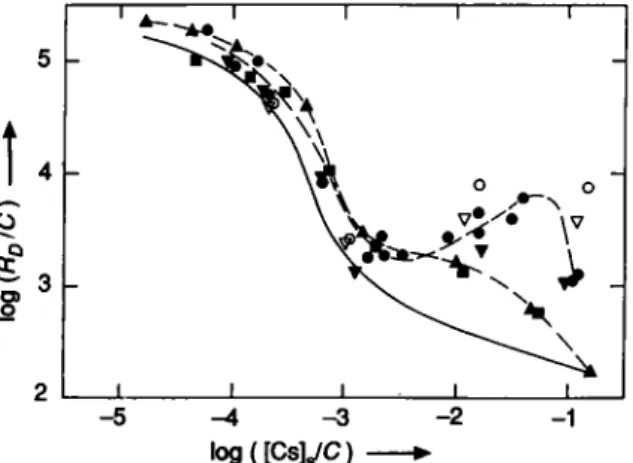
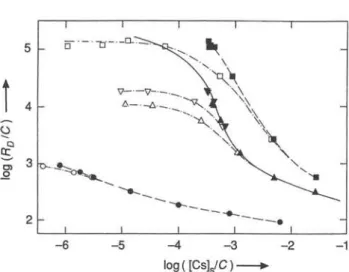
- 4 - 3 log([Cs]3/C)
Fig. 1. Sorption, desorption and exchange of cesium in synthetic groundwater on < 32-nm material from Glattfelden (depth: 22 — 24m) and from Rubigen. • Sorption; O Desorption (Ist Step); — multiple desorption; A Exchange; + Sorption (data
not corrected for changes in the specific activity of Cs-137).
3. Results and discussion
S o r p t i o n b e h a v i o u r of c e s i u m on < 3 2 - | x m size f r a c t i o n s
In this chapter general aspects of the sorption behav-iour of cesium and effects attributed to structural changes occuring in clay minerals will be discussed. The most extensively investigated size fractions are the <32nm materials from Glattfelden (depth: 2 2 -24 m) and from Rubigen. The results for these size fractions are summarized in Figure 1. In the chosen representation, errors in the distribution ratio Üb as well as in the cation-exchange capacity C influence the scales of both axes, since the concentration of cesium in the solid [Cs]s is calculated using equation (7). Too large distribution ratios or too small a cation-exchange capacity shift the data points to the upper right along straight lines with slopes of 45°. For a given material, the cation-exchange capacity contributes a constant error for all data, whereas errors in the distribution ratio scatter from data point to data point. Both errors are estimated to be < + 1 0 % .
At the lowest fractional loadings the isotherms approach linearity. A linear isotherm is equivalent to constant distribution ratios. However, at medium fractional loadings ([CsyC = lO"'^ - 10"^), the iso-therms are strongly non-linear: the sorption energy varies considerably with loading in this region. At fractional loadings < 10"^, the data for sorption, de-sorption and exchange agree within experimental
errors indicating a nearly reversible behaviour of cesium. Up to these loadings the sorption curves for the materials from Glattfelden and from Rubigen are also very similar. However, they clearly differ at higher fractional loadings, where also the data for sorption, desorption and exchange deviate considerably from each other. These differences are most pronounced between the data for sorption and those for exchange, demonstrating that only a small fraction of the labelled cesium in the solid was accessible to exchange at loadings >10"^. This is also demonstrated by the results of the multiple desorption experiments (dashed lines), where ten desorption steps were carried out in sequence. The desorption curves obtained at the 3 highest concentrations of cesium bear no resemblance to the sorption curves.
Jacobs and Tamura [8], Jacobs [9], and Tamura [10] demonstrated that sorption of cesium induces a collpase of the c-spacing of vermiculite layers from 14 to 10 Ä. Their sorption curves for vermiculite are characterized by a maximum at high concentrations of cesium and resemble that for the < 40-nm chlorite shown in Figure 5. The experimental fmdings for the < 32-nm size fractions in Figure 1 can be interpreted, if one assumes i) that clay minerals are responsible for the sorption, desorption and exchange behaviour of cesium, ii) that they have small structural regions with vermiculite-like character and iii) that sorption of cesium leading to fractional loadings > induces a collpase of the layer spacing in these regions. At these fractional loadings, the shapes of the sorption curves are sensitive to such structural effects, and the desorption and exchange of the sorbed cesium is hindered, since part of the cesium is buried within these collapsed structures of the clay minerals.
I n f l u e n c e of g r a i n size a n d m i n e r a l o g y Since the glaciofluvial deposits are very heterogeneous with respect to grain size and mineralogy, various grain size fractions were investigated. Figure 2 summarizes the sorption data obtained with grain size fractions ranging from < 2 um to 2 mm which were isolated from the core drilled at Glattfelden. Materials from two depths were used, namely 12.0 —12.4 m and 22—24 m. This figure demonstrates that nearly one curve results for all size fractions, if the scales are normaUzed with the cation-exchange capacity C. If the distribution ratios are not normalized, they are spread out over a ränge of nearly two Orders of magni-tude at any fractional loading. The results obtained for grain size fractions isolated from material taken in a gravel pit at Rubigen are shown in Figure 3. If the data from Glattfelden and Rubigen are combined the scatter of the sorption data for the various grain size fractions remains small at fractional loadings < 1 0 " ' . At higher loadings, a larger scatter of the data is caused by the structural effects discussed in the previous sec-tion. The size fractions of 32 — 64 um and 64—125 |im
5
4
-E 3
-- 5 - 4 - 3 - 2
l o g ( [ C s V C ) •
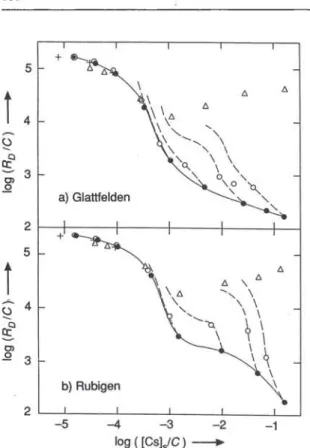
Fig. 2. Sorption of cesium in synthetic groundwater on various grain size fractions isolated from a core drilled at Glattfelden. Depth 1 2 - 1 2 . 4 m : A < 2 um; • 2 - 4 jim; T 8 - 1 5 um; • 1 5 3 2 u m ; » < 3 2 ^m. Depth 2 2 2 4 m : O < 3 2 ^ m ; + 3 2
-64^m; x 6 4 - 1 2 5 um; A 2 5 0 - 5 0 0 um; • 1000 - 2000 um.
- 4 - 3 l o g ( [ C s V C )
Fig. 3. Sorption of cesium in synthetic groundwater on various grain size fractions isolated from the material taken in a gravel pit at Rubigen. A < 3 2 um; • 3 2 - 6 4 um; • 6 4 - 1 2 5 um; • 250 — 500 um. Magnetically separated fractions: O 32—64 um;
V 6 4 1 2 5 um. < 3 2 um from Glattfelden, depth: 2 2 -24m (also shown in Figures la and 2).
from Rubigen show the largest effects due to structural changes (Figure 3). They are smallest for the Glattfelden material. But also here, the flattening of the Sorption curves observed at fractional loadings > 1 0 " ^ is attributed to such effects. Figure 4 summarizes the results for the grain size fractions from Glattfelden and Rubigen in a different presentation (fractional loading of the solid versus concentration in the Solution). All the data shown in Figures 2 and 3 lie between the curves for the size fractions of < 2 |im from Glattfelden and < 32 |im from Rubigen, except the data for the size fractions of 32—64 and 64 — 125 um from Rubigen at fractional loadings > 310"^ represented by the dashed line.
The mineralogical compositions of the size frac-tions investigated vary considerably (Table 2): for those isolated from the material from Glattfelden at a depth of 12 —12.4 m, the <2-nm fraction contains ten times as much clays as the 15-32-|im fraction.
- 1 0 - 8 - 7 - 6
log[Cs]3p 1
Fig. 4. Sorption isotherms for cesium in synthetic groundwater for size fractions from Glattfelden and Rubigen. O < 2 um (Glattfelden); • < 3 2 um (Glattfelden, depth: 22 - 24m); A
< 3 2 ^m (Rubigen); — 3 2 - 6 4 um (Rubigen).
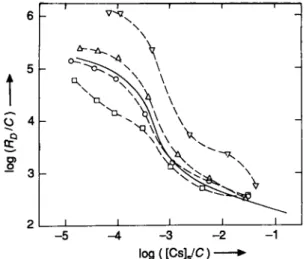
- 4 - 3 log([CsyC) •
Fig. 5. Sorption of cesium in synthetic groundwater on clay minerals: O Montmorillonite; • lUite; A <40-nm Chlorite;
V < 2-nm Chlorite.
Nevertheless, the sorption curves are very similar, when normalized with the cation-exchange capacity C (Figure 2). The clays are also considerably enriched in the materials which were magnetically separated from two size fractions from Rubigen (U. Waber: personal communication). The sorption curves for the magneti-cally enriched size fractions resemble very much those of the unseparated materials (Figure 3). This similarity and the fact that the clay minerals make up 50— 60% of the < 2-\an material and of the magnetically separated 32 — 64 |im size fraction demonstrate that ion-exchange on the clays is the process dominating the sorption of cesium on the glaciofluvial materials investigated in this work.
Three clays were also investigated, namely a mont-morillonite from Crook County, Wyoming, USA (C = 0.89 meq/g), an illite from Puy-en-Velay, France (C = 0.36 meq/g), and a chlorite [11] from Grimsel, Switzerland (C = 0.0145 meq/g for the <40-nm ma-terial and C = 0.38 for the mama-terial ground to
< 2 um). Figure 5 shows, that the sorption curves of the illite and the <40-|im chlorite are strongly non-linear, whereas that of the montmorillonite
approaches linearity. This means that the illite and the <40-nm chlorite have sorption sites with largely varying sorption energies, whereas those of the mont-morillonite are energetically similar, as expected. The ground chlorite with its intermediate slope lies between these extremes. Therefore, sorption sites of greater homogeneity than those of the original < 40-nni chlor-ite were created by grinding. The sorption curve of illite could not be investigated at smaller fractional loadings than those shown in Figure 5 due to its high content of exchangeable cesium. Its high distribution ratio of about 45'000 prohibited displacement of a major part of this cesium by one of the major cations in the synthetic groundwater. The clays in the alpine and peri-alpine glaciofluvial deposits are mainly made up of illite and chlorite (Table 2) and in fact similar shapes are observed for these materials as a compari-son of Figure 5 with Figures 2 and 3 shows.
- 3 - 2 l o g ( [ C s y C ) —
Fig. 6. Sorption of cesium in synthetic groundwaters of different composition (size fraction: < 3 2 jim from Glattfelden, depth: 2 2 - 2 4 m ) . SGW; O SGW-l/2[Ca, Mg]; A SGW-1/3 K;
V SGW-OK; • SGW-HCOj (see text).
I n f l u e n c e of S o l u t i o n c h e m i s t r y
The compositions of the groundwaters vary quite con-siderably in the peri-alpine regions of Switzerland. However, all the data reported up to now were obtained with one synthetic groundwater (SGW). Its composition is given in the experimental section. The sensitivity of the sorption data to changes in the groundwater composition was investigated with the following solutions: synthetic groundwater with halved concentrations of calcium and magnesium ions (SGW-l/2[Ca,Mg]), with a potassium ion content of one third (SGW-1/3 K) or with no potassium ions at all (SGW-OK), with normal contents of the major cations but considerably increased concentration of bicarbonate (SGW-HCO3). The experiments with SGW-HCO3 were performed at an elevated partial pressure of carbon dioxide of 10"^ bar. The solutions had pH-values dose to 7.9, except SGW-HCO3, whose p H amounted to 7.2.
The results obtained with these solutions are summarized in Figure 6. Those in SGW-l/2[Ca,Mg] do not differ significantly from those in SGW (solid line). A clear, though rather small increase in the distri-bution ratios over the whole concentration ränge is observed if the potassium ion concentration is reduced by a factor of 3. Eliminating potassium from the syn-thetic groundwater (SGW-OK) increases the distri-bution ratios considerably. The potassium ion concen-tration in the Solution increased during the exper-iment, but did not exceed 10% of that in SGW. At fractional loadings > 10" ^ the effects due to structural changes are enhanced in SGW-OK. This is consistent with the ideas developed in the first section of "Results and discussion", since potassium ions also induce col-lapse of the layer spacing in vermiculites, though in a less pronounced manner than cesium ions [9]. Since the concentration of the potassium ions is by far the lowest of the major cationic species in SGW, it is evident that they are the main competitors to the
cesium ions for sorption sites. The results presented in Figure 6 indicate, that the variations in the compo-sition of cations expected for shallow groundwaters in calcite-rich glaciofluvial deposits will not significantly change the sorption behaviour of cesium: the concen-trations of calcium and magnesium vary within a factor of about 2 with respect to those in SGW and that of potassium is expected to lie within those of SGW-1/3 K and SGW (W. Stumm: personal com-munication).
The results obtained with SGW-HCO3 deviate sig-nificantly from those with SGW only at fractional loadings below 10"^'^. One half of these samples were desorbed in SGW-HCO3 and the other half in SGW: The desorption data obtained in SGW-HCO3 co-incided with the sorption curve obtained in SGW-HCO3, whereas those desorbed in SGW coincided with the sorption curve measured in SGW. This behav-iour is best explained by assuming that hydrogen ions interfere notably with cesium ions if their concen-tration is roughly equal to or larger than that of the cesium ions: the hydrogen ion concentration of 10" "'•^M in SGW-HCO3 is approximately 5 times higher than in SGW, and fractional loadings of
<10"^-^ correspond to cesium ion concentrations in Solution of M.
I n f l u e n c e of t h e e x c h a n g e a b l e c e s i u m in t h e s o l i d
The concentration of exchangeable cesium in the solid will usually vary with the materials investigated. Its influence on the sorption isotherms will therefore also be variable. It will be significant, if the amount of exchangeable cesium introduced with the solid is con-siderable, compared to the amount introduced with the Solution. This usually happens at low concen-trations and if so, the specific activity of Cs-137 changes during the experiment. Concentrations and
0?
log{[CsyC)-Fig. 7. Sorption behaviour of Cs-137 (open symbols) and of total cesium (filled symbols) in synthetic groundwater. O • Sorption on Montmorillonite; • • Sorption on Illite; A • Sorption and V • desorption on a < 32-nm fraction from Glattfelden with
artificially increased content of exchangeable cesium.
loadings not corrected for these changes are oper-ational quantities and represent the behaviour of the tracer. Up to now the discussion was Umited to correct-ed data, i.e. those for total cesium. For the size frac-tions isolated from glaciofluvial deposits these correc-tions are small and the shape of the Sorption curves is only slightly influenced by them. This can be judged from Figure 1, where corrected and uncorrected Sorp-tion data are shown.
In the following, the influence of the exchangeable cesium in the solid on the sorption curves for illite and montmorillonite and on the sorption and desorption curves for <32-nm material (Glattfelden, 2 2 - 2 4 m depth) will be discussed in more detail. In the latter the concentration of exchangeable cesium was artificially increased prior to the sorption experiment by treating the solid with synthetic groundwater, which contained cesium at a concentration of 3 1 0 " ^ M. The concen-trations of exchangeable cesium in the solids amounted to: 4.0'10"'' meq/g of montmorillonite, 1.25-10 " meq/g od illite and 2.55-10~ ^ meq/g of < 32-Hm material. For these three materials, both the cor-rected and the uncorcor-rected data are shown in Figure 7. As expected, they are indistinguishable on the high concentration side of the curves, where open and filled symbols coincide. Here, the total amount of exchange-able cesium in the system is dominated by the cesium introduced with the Solution. The other extreme is characterized by essentially constant concentrations of total cesium, but largely different specific activities of Cs-137. This case is expected at low concentrations and is most drastically illustrated by the data for illite. Under these circumstances inactive cesium is desorbed from the solid phase during the sorption step, whereas Cs-137 is sorbed due to isotope-exchange, i.e. total cesium and Cs-137 show opposite behaviours. The sorption curves for cesium on illite found in the litera-ture [8,9,12,13] resemble that for the uncorrected data in Figure 7. They all show a more or less pronounced
plateau at low concentrations. Since the concen-trations of total cesium were not determined in these works, an unequivocal Interpretation of the plateau region is impossible. For the <32-nm material, in which the cesium content was artificially increased, the uncorrected data differ at low loadings from the curve for the starting material represented by the solid line in Figure 7. However, the corrected data for sorp-tion and desorpsorp-tion coincide with that curve indicating reversible behaviour. Therefore, for uncorrected re-sults in the plateau region at low concentrations, the fact that the desorption curve lies above the sorption curve is not sufficient to prove irreversible behaviour.
4. Conclusions
— The isotherms for sorption, desorption and ex-change of cesium on materials from quaternary glaciofluvial deposits are non-linear.
— After normalization with the cation-exchange ca-pacity the isotherms for size fractions of glaciofluvial materials from different depths and different geographic locations agree within a factor o f 2 .
— Realistic variations in the composition of the syn-thetic groundwater have only a small influence on the sorption behaviour of cesium; potassium ions and, at low concentrations of cesium, hydrogen ions mainly compete for sorption sites with the cesium ions.
— The clay minerals illite and chlorite are mainly responsible for the sorption of cesium in the inves-tigated glaciofluvial deposits.
— At higher cesium concentrations, desorption and exchange are strongly hindered by structural changes induced by the sorption of cesium in the clay minerals. Exchange experiments are sensitive indicators of such changes.
— For a better understanding of the processes, the exchangeable concentration of cesium in the solid should be taken into account at low concentrations. — The presented isotherms characterize the sorption of cesium in groundwaters of the Swiss plaines and peri-alpine regions quite well. This result is valuable for equilibrium predictions on the mi-gration of cesium in these extended geological for-mations. However, kinetic effects may significantly influence the actual behaviour.
Acknowledgements
The authors thank Ch. Buehler, H. N. Erten, R. Grauer, A. Kandil, R. Giovanoli, Tj. Peters, W. Stumm, U. Waber and D. Zimmermann for exper-imental contributions and/or discussions. The work was supported by the Institute for Aquatic Sciences
(EAWAG) and the Swiss National Science Foun-dation.
References
1. Grogan, H.: Biosphere Modelling for a HLW Repository-Scenario and Parameter Variations, EIR-Bericht Nr. 561, Eidg. Institut für Reaktorforschung, Würenlingen 1985. 2. Andersson, K., Allard, B.: Sorption of Radionuclides on
Geologie Media, SKBF-KBS-TR-83-07, Svensk Käms-bränstefSrsörjning, Stockholm 1983.
3. Lang, H.: Deutsche Gewässerkundliche Mitteilung 26, 69 (1982).
4. Schwarzer, K., Thelen, J., Katscher, W.: Nucl. Techn. 60, 97 (1983).
5. Lieser, K. H., Steinkopff, Th.: Radiochim. Acta 46, 39 (1989).
6. Lieser, K. H., Steinkopff, Th.: Radiochim. Acta 47, 55 (1989).
7. Chapman, H . D.: Cation-Exchange Capacity, in: Methods of Soil Analysis (Black, C. A., ed.), Amer. Soc. Agron. Puhl., Madison 1965.
8. Jacobs, D. G., Tamura, T.: Trans. 7th Int. Congr. Soil Sei., Madison 1960, International Society of Soil Science, Elsevier, Amsterdam 2, 206 (1961).
9. Jacobs, D. G.: Proc. Int. Clay Conf., Stockholm 1963 (I. Th. Rosenquist and P. Graff-Petersen, eds.), Pergamon Press, New York 1, 239 (1963).
10. Tamura, T.: Trans. 8th Int. Congr. Soil Sei., Bucharest 1964, Publishing House, Academy Sodalist Republic of Rumania, Bucharest 3, 465 (1964).
11. Grütter, A., von Gunten, H. R., Rössler, E.: Clays Clay Miner. 34, 677 (1986).
12. Gaudette, H . E., Grim, R. E., Metzger, C. F.: Am. Mineral. 51,1649 (1966).
13. Brouwer, E., Baeyens, B., Maes, A., Cremers, A.: J. Phys. Chem. 87,1213 (1983).