EUROPEAN ORGANISATION FOR NUCLEAR RESEARCH (CERN)
Eur. Phys. J. C 78 (2018) 129
DOI:10.1140/epjc/s10052-018-5595-5
CERN-EP-2017-187 26th February 2018
Direct top-quark decay width measurement in the
t ¯t lepton
+jets channel at
√
s
= 8 TeV with the
ATLAS experiment
The ATLAS Collaboration
This paper presents a direct measurement of the decay width of the top quark using t¯t events in the lepton+jets final state. The data sample was collected by the ATLAS detector at the LHC in proton–proton collisions at a centre-of-mass energy of 8 TeV and corresponds to an integrated luminosity of 20.2 fb−1. The decay width of the top quark is measured using a template fit to distributions of kinematic observables associated with the hadronically and semileptonically decaying top quarks. The result,Γt = 1.76 ± 0.33 (stat.)+0.79−0.68(syst.) GeV
for a top-quark mass of 172.5 GeV, is consistent with the prediction of the Standard Model.
c
2018 CERN for the benefit of the ATLAS Collaboration.
Contents
1 Introduction 3
2 ATLAS detector 4
3 Data and simulated event samples 4
4 Event reconstruction and selection 6
4.1 Event reconstruction 6
4.2 Event selection 7
4.3 Reconstruction of the t¯t decay 8
5 Template fit 12
6 Systematic uncertainties 15
6.1 Uncertainties in detector modelling 15
6.2 Uncertainties in background modelling 16
6.3 Uncertainties in signal modelling 17
6.4 NLO and off-shell effects in the top-quark decay 18
6.5 Template statistical uncertainty 18
7 Result 18
8 Conclusion 21
1 Introduction
The top quark is the heaviest particle in the Standard Model (SM) of elementary particle physics, dis-covered more than 20 years ago in 1995 [1, 2]. Due to its large mass of around 173 GeV [3–5], the lifetime of the top quark is extremely short. Hence, its decay width is the largest of all SM fermions. A next-to-leading-order (NLO) calculation predicts a decay width ofΓt = 1.33 GeV for a top-quark mass
(mt) of 172.5 GeV [6,7]. Variations of the parameters entering the NLO calculation, the W-boson mass,
the strong coupling constant αS, the Fermi coupling constant GFand the Cabibbo–Kobayashi–Maskawa
(CKM) matrix element Vtb, within experimental uncertainties [8] yield an uncertainty of 6%. The recent
next-to-next-to-leading-order (NNLO) calculation predicts Γt = 1.322 GeV for mt = 172.5 GeV and
αS= 0.1181 [9].
A deviation from the SM prediction could indicate non-SM decay channels of the top quark or non-SM top-quark couplings, as predicted by many beyond-the-Standard-Model (BSM) theories. The top-quark decay width can be modified by direct top-quark decays into e.g. a charged Higgs boson [10,11] or via flavour-changing neutral currents [12, 13] or by non-SM radiative corrections [14]. Furthermore, some vector-like quark models [15] modify the |Vtb| CKM matrix element and thusΓt. Precise measurements
ofΓt can consequently restrict the parameter space of many BSM models.
Extractions ofΓt from the t → Wb branching ratio B and the single-top t-channel cross-section, such
as those of Refs. [16, 17], have reached a precision of 0.14 GeV, but depend on the assumption that P
qB(t → Wq) = 1 with q = d, s, b, and use theoretical SM predictions for Γ(t → Wb) and the
single-top t-channel cross-section. Some BSM models, vector-like quark models for example [15], predict a sizeable deviation from the assumptions used in indirect measurements. This provides a motivation to perform a direct measurement ofΓt. However, such a measurement is not yet sensitive to alternative
BSM models with the current precision. A direct measurement ofΓt, based on the analysis of the
top-quark invariant mass distribution was performed at the Tevatron by the CDF Collaboration [18]. A bound on the decay width of 1.10 <Γt < 4.05 GeV for mt = 172.5 GeV was set at 68% confidence level. Direct
measurements are limited by the experimental resolution of the top-quark mass spectrum, and so far are significantly less precise than indirect measurements, but avoid model-dependent assumptions.
This analysis is based on ATLAS data recorded at a centre-of-mass energy of √s = 8 TeV in 2012 in LHC proton–proton collisions. The top-quark decay width is extracted using t¯t events in the lepton+jets channel with t → Wb, where one W boson from the two top quarks decays hadronically into a pair of quarks and the other one decays leptonically into a charged lepton and a neutrino (the corresponding top quarks are referred to as hadronically and semileptonically decaying, respectively). Thus, the final state consists of four jets, two of which are b-jets, one charged electron or muon and missing transverse momentum (EmissT ) due to the undetected neutrino. Additional jets can originate from initial- or final-state radiation (ISR or FSR). Selected events include W-boson decays into a τ lepton if the τ decays leptonically.
The measurement is performed using two observables sensitive toΓt: m`b, which is the reconstructed
invariant mass of the system formed by the b-jet and the charged lepton ` from the semileptonic top-quark decay, and∆Rmin( jb, jl), defined as the angular distance1 between the b-jet jb associated with the 1ATLAS uses a right-handed coordinate system with its origin at the nominal interaction point (IP) in the centre of the detector
and the z-axis along the beam pipe. The x-axis points from the IP to the centre of the LHC ring, and the y-axis points upwards. Cylindrical coordinates (r, φ) are used in the transverse plane, φ being the azimuthal angle around the z-axis. The pseudorapidity is defined in terms of the polar angle θ as η= − ln tan(θ/2). Angular distance is measured in units of
hadronic top-quark decay and the closest light jet jl from the hadronically decaying W boson. This
approach exploits the kinematic information from both the hadronically and semileptonically decaying top quarks. A template method is used to measure the top-quark decay width. Templates for the two observables are built for all contributing SM processes. Distributions for multijet production are formed using a data-driven method. Templates for the other SM processes, including top-quark pair production and electroweak single-top production, are generated using Monte Carlo (MC) simulations. Templates for different top-quark decay width values are constructed by reweighting MC events. These templates are used in a binned likelihood fit to data to extractΓt.
The ATLAS detector is described in the next section. Section3introduces MC simulated samples and the dataset, followed by a description of the event selection and reconstruction in Section4. The template fit is described in Section5, the systematic uncertainties are estimated in Section6. Section7presents the results of the measurement and Section8gives the conclusions.
2 ATLAS detector
The ATLAS experiment [19] at the LHC is a multi-purpose particle detector with a forward-backward symmetric cylindrical geometry and a near 4π coverage in solid angle. It consists of an inner tracking detector surrounded by a thin superconducting solenoid providing a 2 T axial magnetic field, electro-magnetic and hadron calorimeters, and a muon spectrometer. The inner tracking detector covers the pseudorapidity range |η| < 2.5. It consists of silicon pixel, silicon microstrip, and transition radiation tracking detectors. Lead/liquid-argon (LAr) sampling calorimeters provide electromagnetic (EM) energy measurements with high granularity. A hadron (steel/scintillator-tile) calorimeter covers the central pseu-dorapidity range (|η| < 1.7). The endcap and forward regions are instrumented with LAr calorimeters for both the EM and hadronic energy measurements up to |η| = 4.9. The muon spectrometer surrounds the calorimeters and features three large air-core toroid superconducting magnets with eight coils each. The field integral of the toroids ranges between 2.0 and 6.0 Tm across most of the detector. It includes a system of precision tracking chambers and fast detectors for triggering. A three-level trigger system is used to select events. The first-level trigger is implemented in hardware and uses a subset of the detector information to reduce the accepted rate to at most 75 kHz. This is followed by two software-based trigger levels that together reduce the accepted event rate to 400 Hz on average.
3 Data and simulated event samples
The decay width of the top quark is measured using data which correspond to an integrated luminosity of 20.2 fb−1[20]. Single-lepton triggers for electrons and muons under stable beam conditions were used. For each lepton type, two single-lepton triggers with the transverse momentum, pT, thresholds of 24 (24)
and 60 (36) GeV for electrons (muons) were used. The two triggers with the lower pTthresholds imposed
additional isolation requirements on the lepton to keep the trigger rate low. No isolation requirement was used by the higher pTthreshold triggers.
The nominal signal t¯t MC sample was generated assuming a top-quark mass of mt = 172.5 GeV using
the Powheg-Box (v1) event generator [21–23], referred to in the following as Powheg, providing NLO ∆R ≡ p(∆η)2+ (∆φ)2.
QCD matrix-element (ME) calculations [24]. The hdampparameter that regulates the high-pTradiation in
Powheg was set to mt. The CT10 parton distribution function (PDF) set [25] was used. The event
gener-ator was interfaced with Pythia 6.425 [26] for parton showering (PS), hadronisation and underlying event modelling, using the Perugia 2011C set of tuned parameters [27] and the CTEQ6L1 PDF set [28]. To estimate the impact of the parton shower and hadronisation model choice, a Powheg+Pythia6 sample is compared to a sample generated with Powheg interfaced with Herwig 6.520 [29] using Jimmy v4.31 [30] to simulate the underlying event. The latter sample is referred to as Powheg+Herwig in the following. The hdampparameter was set to infinity in both samples used to assess the systematic uncertainty due to
parton shower modelling. The uncertainty due to the MC event generator choice is estimated using the alternative MC event generator MC@NLO [31,32] for the hard process, interfaced to Herwig for shower-ing, hadronisation and the simulation of the underlying event which is compared to the Powheg+Herwig sample. To assess the impact of the initial- and final-state radiation, samples generated with Powheg were interfaced to Pythia with different settings for the event generator parameters regulating ISR and FSR. In these samples, the hdampparameter and the factorisation and renormalisation scales in Powheg, as well
as the transverse momentum scale for space-like parton shower evolution in Pythia were varied to cover the range in additional jet multiplicity corresponding to the uncertainty of t¯t production measurements in association with jets [33, 34]. The t¯t samples are normalised using the theoretical cross-section of σt¯t = 253+15−16 pb, based on a calculation performed with the Top++2.0 [35–40] program that includes
NNLO corrections and resums next-to-next-to-leading-logarithmic-order (NNLL) soft gluon terms. PDF and scale variations, the choice of αS, and the input top-quark mass are regarded as sources of systematic
uncertainty.
Background events containing a W or a Z boson produced in association with jets were generated us-ing the Alpgen 2.14 [41] LO event generator with up to five additional partons and the CTEQ6L1 PDF set [28]. Parton shower and hadronisation were modelled with Pythia 6.425. Separate samples were generated for W/Z+ b¯b, W/Z + c¯c, W + c, and W/Z+light jets. A parton–jet matching scheme (“MLM matching”) [42] is used to prevent double-counting of jets generated by both the matrix-element calcu-lation and the parton-shower evolution. The W+jets events are normalised using a data-driven method exploiting the asymmetry of W± production in pp collision [43]. The corrections for event generator mismodelling in the fractions of different flavour components (W + b¯b, W + c¯c, W + c and W+light jets) are estimated in a sample with the same lepton and ETmissselections as the signal selection, but with only two jets and no b-tagging requirement. The b-jet multiplicity, in conjunction with knowledge of the b-tagging and mistag efficiency, is used to extract the heavy-flavour fractions. The correction factors extracted from the MC simulation and used in the analysis are Kb¯b = Kc¯c = 1.50 ± 0.11 (stat.+syst.),
Kc = 1.07±0.27 (stat.+syst.) and Klight= 0.80±0.04 (stat.+syst.) [43]. The Z+jets events are normalised
using the inclusive NNLO theoretical cross-section [44].
Diboson background samples were generated with the Sherpa 1.4.1 event generator [45] with up to three additional partons in the LO matrix elements using the CT10 PDF set. The samples are normalised with the NLO theoretical cross-sections [46].
At leading order, three single-top-quark production mechanisms, s-channel, t-channel and associated Wt production, contribute to the single-top-quark background. These processes were simulated with Powheg [47,48] using the CT10 PDF set. All samples were interfaced to Pythia 6.425 with the CTEQ6L1 PDF set and the Perugia 2011C tune. Overlaps between the t¯t and Wt final states were removed [49]. All individual single-top-quark samples are normalised using their corresponding approximate NNLO theoretical cross-sections [50,51] based on an MSTW 2008 NNLO PDF set calculation [52].
Multijet events can pass the selection because of the misidentification of a jet or a photon as an electron or muon (fake lepton) or because of the presence of a non-prompt lepton (electron or muon), which can originate from semileptonic decays of heavy-flavour hadrons. This background, referred to as multijet background in the following, is estimated directly from data using a data-driven matrix method [53]. The detector response [54] was simulated using the GEANT 4 simulation toolkit [55]. To estimate some systematic effects, samples passed through a fast simulation [56] are used. This simulation utilises a parameterisation of the response of the EM and hadronic calorimeters while a full simulation is used for the tracking systems. The effects of in-time and out-of-time pile-up (multiple pp interactions from the same or neighbouring bunch-crossings) are included in these simulations. Events from minimum-bias interactions were simulated with the Pythia 8.1 event generator with the MSTW 2008 LO PDF set and the A2 tune [57] and overlaid on signal and background processes to simulate the effect of pile-up. The
simulated events are reweighted in order to match the distribution of the average number of collisions per bunch crossing in the data. MC events are processed through the same reconstruction algorithms as the data.
4 Event reconstruction and selection
4.1 Event reconstruction
Electrons, muons, jets, b-jets and missing transverse momentum are used to select t¯t events in this ana-lysis.
Electron candidates are reconstructed using energy deposits in the electromagnetic calorimeter matched to reconstructed inner-detector tracks [58]. These electron candidates are required to have pT > 25 GeV
and |η| < 2.47, with the transition region between the barrel and endcap detector 1.37 < |η| < 1.52 excluded. Isolation requirements are used to reduce the background from fake and non-prompt electrons. A pT- and η-dependent isolation requirement is placed on the sum of transverse energy deposited within
a cone of size∆R = 0.2 around the calorimeter cells associated to the electron. This energy sum excludes cells in the cluster associated with the electron and is corrected for leakage from that cluster and for energy deposits from pile-up. Another pT- and η-dependent isolation requirement is made on the scalar
sum of track transverse momenta around the electron within a cone of size∆R = 0.3. Furthermore, the longitudinal impact parameter |z0| of the electron track with respect to the selected event primary vertex2
(PV) is required to be smaller than 2 mm.
Muon candidate reconstruction is based on tracks in the muon spectrometer which are matched to inner-detector tracks [59]. The combined muon track must satisfy pT > 25 GeV and |η| < 2.5 and its
longit-udinal impact parameter z0with respect to the PV is required to be smaller than 2 mm. Muon candidates
have to be separated from any jet by∆R > 0.4 and are required to satisfy a pT-dependent track-based
isolation requirement. Specifically, the scalar sum of the transverse momenta of tracks within a cone of size∆R = 10 GeV/pT around the muon candidate (excluding the muon track itself) has to be less than
5% of the muon transverse momentum.
2The primary vertex is required to have at least four associated tracks with p
T> 400 MeV. If more than one vertex fulfils this
criterion, the one with the largest sum of squared transverse momenta from its associated tracks is defined to be the primary vertex.
Jets are reconstructed using the anti-kt algorithm [60], implemented in the FastJet package [61], with a
radius parameter of R= 0.4. The jet reconstruction starts from calibrated topological clusters [62] which are built from energy deposits in the calorimeters. To correct for effects due to the non-compensating calorimeter response, dead material and out-of-cluster leakage, a local cluster calibration scheme [63,64] is applied prior to jet finding. Simulations of charged and neutral particles are exploited to estimate these corrections. The jets are calibrated by applying energy- and |η|-dependent calibration factors, derived from simulations, to the mean energy of the jets built from the stable particles [65]. In addition, a residual calibration [66] of the jet energy scale (JES) was performed using data taken in 2012. Dijet events are used to calibrate jets in the forward region against jets in the central region. Photon+jet as well as Z+jet events are used to calibrate central jets, and multijet events are used to calibrate high-pT jets. These
measurements are then combined. Jets are accepted if they fulfil pT > 25 GeV and |η| < 2.5 after energy
calibration. To reduce the contribution from jets associated with pile-up, jets having pT < 50 GeV and
|η| < 2.4 must satisfy a requirement [67] for the jet vertex fraction,3 JVF > 0.5. To prevent double-counting of electrons as jets, the closest jet lying∆R < 0.2 of a selected electron is discarded. If the nearest jet surviving the selection described above is within∆R = 0.4 of the electron, the electron is discarded.
The purity of the selected sample is improved by tagging jets containing b-hadrons on the basis of their large mass and decay time. The MV1 algorithm [69] based on multivariate techniques is utilised to identify jets originating from the hadronisation of a b-quark. The chosen working point corresponds to an efficiency of 70% to correctly identify a b-quark jet in simulated t¯t events, with a light-jet rejection factor of around 130 and a c-jet rejection factor of 5. The tagging efficiencies in simulation are corrected to match the results of the calibrations based on data [70,71].
The EmissT serves as a measure of the transverse momentum of the neutrino which originates from the leptonically decaying W boson. It is calculated using all reconstructed and calibrated particles (electrons, muons, photons) and jets in the transverse plane. Contributions from unassociated energy depositions are also taken into account [72].
4.2 Event selection
According to the signature of the t¯t signal in the lepton+jets decay channel, events are required to have exactly one reconstructed electron or muon and at least four jets, at least one of which is required to be b-tagged. This selection includes W-boson decays into a τ lepton if the τ decays leptonically. Events are required to pass a single-electron or single-muon trigger. If at least one of the jets having pT > 20 GeV
is identified as out-of-time activity from a previous pp collision, as calorimeter noise or non-collision background, the event is not considered [73].
Events with exactly one b-tagged jet need to have EmissT > 20 GeV and EmissT +mWT > 60 GeV, where mWT is the transverse mass of the leptonically decaying W boson defined as mWT =
q
2p`TEmissT (1 − cos∆φ(`, ETmiss)). These requirements suppress the background due to misidentified leptons. As this background becomes very small in high b-tag multiplicity regions, these requirements are not applied to events with at least two b-tagged jets. Selected events are reconstructed under the t¯t decay hypothesis using a likelihood-based
3The jet vertex faction (JVF [68]) is the ratio of the sum of the p
Tof tracks associated with the jet and the primary vertex to the
sum of pTof all tracks associated with the jet, while the pTof the involved tracks needs to exceed 1 GeV. Hence, this selection
ensures that at least 50% of the sum of the pTof tracks associated with the jet belongs to tracks compatible with originating
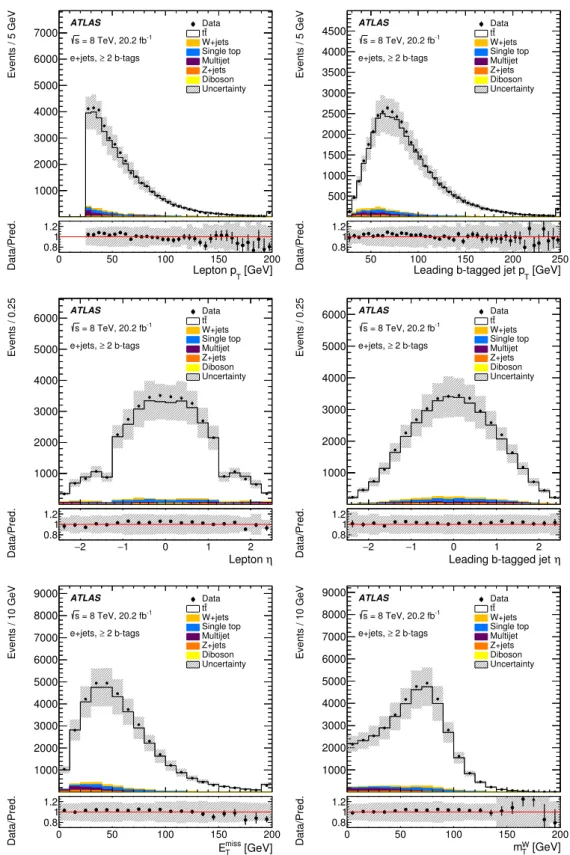
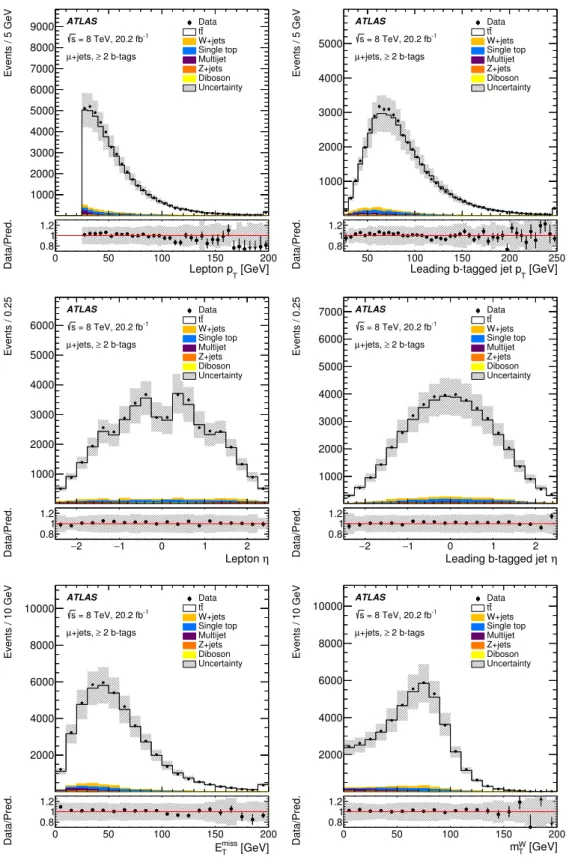
method described in Section4.3. The logarithm of the likelihood has to satisfy ln(L) > −50 to suppress the combinatorial background due to wrongly reconstructed events and to decrease other backgrounds. This improves the sensitivity of the measurement by increasing the fraction of well-reconstructed t¯t events in the selected sample. Events satisfying all selection criteria are separated into eight mutually exclusive analysis regions. The events are categorised according to the flavour of the selected lepton and whether they have exactly one or at least two b-tagged jets. They are further split into two |η| regions, a central region with all four jets associated with the t¯t decay having |η| ≤ 1 and a second one with at least one jet with |η| > 1. This approach takes advantage of the different sensitivity of these regions to detector res-olution effects and pile-up contributions and different amounts of background. The corresponding event yields are listed in Table1. Figures1 and 2show the distributions of the lepton and leading b-tagged jet pT, lepton and leading b-tagged jet η, EmissT and mWT for events with at least two b-tagged jets in the
electron and muon channels, respectively. Good agreement within the assigned statistical and systematic uncertainties is observed between data and the predictions from simulation.
4.3 Reconstruction of the t ¯t decay
The correct assignment of reconstructed jets to partons originating from a t¯t decay is important for this measurement. This is achieved using a likelihood-based method (Kinematic Likelihood Fitter, KLFit-ter [74]) which makes use of the Bayesian Analysis Toolkit [75]. KLFitter maps the four partons of the t¯t decay to four reconstructed jets using mass constraints on the top-quark mass mt and the W-boson mass
mW. In this analysis the four jets with the highest pT are used as input to KLFitter. A likelihood L is
maximised for all resulting 24 permutations. For each permutation the likelihood is defined as
L= BW(mq1q2q3|mt, Γt) · BW(mq1q2|mW, ΓW) · BW(mq4`ν|mt, Γt) · BW(m`ν|mW, ΓW)
·
4
Y
i=1
W(Eimeas|Ei) · W(E`meas|E`) · W(Emissx |p ν
x) · W(Eymiss|p ν
y) . (1)
The W(EmeasP |EP) are transfer functions, where EmeasP is the measured energy of the jet or lepton P, EP
is the energy of the corresponding parton or lepton, and pνx and pνy are the momentum components of
the neutrino ν in the transverse plane. These momentum components as well as the energies EP are free
parameters of the likelihood maximisation. The component pνz is initially calculated using a constraint
on the W-boson mass m2W = (pν+ p`)2 with the four-momenta pν and p` [74]. Transfer functions for electrons, muons, b-jets, light jets (including c-jets) and Emiss
T are used. They are derived from simulated
t¯tevents using MC@NLO+Herwig [29,31,32]. The decay products of the t¯t pair are uniquely matched to reconstructed particles to obtain a continuous function which describes the relative energy difference between a parton and a reconstructed jet or particle as a function of the parton energy. Parameterisations are derived for different |η| regions. The BW(mi j(k)|mt/W, Γt/W) terms represent Breit–Wigner functions
which stand for the probability distribution of the reconstructed W-boson or top-quark mass given the assumed mass mt/W and a decay width Γt/W. Indices q1–q4 refer to the four quarks mapped to the
reconstructed jets.
To exploit the presence of two quarks in a t¯t decay, kinematic information is complemented by b-tagging. To take it into account, the likelihood definition of Eq. (1) is extended and turned into an event probability which, for a given permutation i, is expressed as
0 50 100 150 200 Events / 5 GeV 1000 2000 3000 4000 5000 6000 7000 Data t t W+jets Single top Multijet Z+jets Diboson Uncertainty ATLAS 2 b-tags ≥ e+jets, -1 = 8 TeV, 20.2 fb s [GeV] T Lepton p 0 50 100 150 200 Data/Pred. 0.81 1.2 50 100 150 200 250 Events / 5 GeV 500 1000 1500 2000 2500 3000 3500 4000 4500 Datatt W+jets Single top Multijet Z+jets Diboson Uncertainty ATLAS 2 b-tags ≥ e+jets, -1 = 8 TeV, 20.2 fb s [GeV] T
Leading b-tagged jet p
50 100 150 200 250 Data/Pred. 0.81 1.2 2 − −1 0 1 2 Events / 0.25 1000 2000 3000 4000 5000 6000 Datatt W+jets Single top Multijet Z+jets Diboson Uncertainty ATLAS 2 b-tags ≥ e+jets, -1 = 8 TeV, 20.2 fb s η Lepton 2 − −1 0 1 2 Data/Pred. 0.8 1 1.2 −2 −1 0 1 2 Events / 0.25 1000 2000 3000 4000 5000 6000 Datatt W+jets Single top Multijet Z+jets Diboson Uncertainty ATLAS 2 b-tags ≥ e+jets, -1 = 8 TeV, 20.2 fb s η Leading b-tagged jet
2 − −1 0 1 2 Data/Pred. 0.8 1 1.2 0 50 100 150 200 Events / 10 GeV 1000 2000 3000 4000 5000 6000 7000 8000 9000 Data t t W+jets Single top Multijet Z+jets Diboson Uncertainty ATLAS 2 b-tags ≥ e+jets, -1 = 8 TeV, 20.2 fb s [GeV] miss T E 0 50 100 150 200 Data/Pred. 0.81 1.2 0 50 100 150 200 Events / 10 GeV 1000 2000 3000 4000 5000 6000 7000 8000 9000 Data t t W+jets Single top Multijet Z+jets Diboson Uncertainty ATLAS 2 b-tags ≥ e+jets, -1 = 8 TeV, 20.2 fb s [GeV] W T m 0 50 100 150 200 Data/Pred. 0.81 1.2
Figure 1: Distributions of the lepton and leading b-tagged jet pT, lepton and leading b-tagged jet η, ETmissand mWT in
the electron+jets channel for events with at least two b-tagged jets after event selection. The hatched bands show the normalisation uncertainty in the signal and background contributions and the signal model systematic uncertainties. The first and last bins contain underflow and overflow events, respectively.
0 50 100 150 200 Events / 5 GeV 1000 2000 3000 4000 5000 6000 7000 8000 9000 Datatt W+jets Single top Multijet Z+jets Diboson Uncertainty ATLAS 2 b-tags ≥ +jets, µ -1 = 8 TeV, 20.2 fb s [GeV] T Lepton p 0 50 100 150 200 Data/Pred. 0.81 1.2 50 100 150 200 250 Events / 5 GeV 1000 2000 3000 4000 5000 Data t t W+jets Single top Multijet Z+jets Diboson Uncertainty ATLAS 2 b-tags ≥ +jets, µ -1 = 8 TeV, 20.2 fb s [GeV] T
Leading b-tagged jet p
50 100 150 200 250 Data/Pred. 0.81 1.2 2 − −1 0 1 2 Events / 0.25 1000 2000 3000 4000 5000 6000 Data t t W+jets Single top Multijet Z+jets Diboson Uncertainty ATLAS 2 b-tags ≥ +jets, µ -1 = 8 TeV, 20.2 fb s η Lepton 2 − −1 0 1 2 Data/Pred. 0.8 1 1.2 −2 −1 0 1 2 Events / 0.25 1000 2000 3000 4000 5000 6000 7000 Data t t W+jets Single top Multijet Z+jets Diboson Uncertainty ATLAS 2 b-tags ≥ +jets, µ -1 = 8 TeV, 20.2 fb s η Leading b-tagged jet
2 − −1 0 1 2 Data/Pred. 0.8 1 1.2 0 50 100 150 200 Events / 10 GeV 2000 4000 6000 8000 10000 Data t t W+jets Single top Multijet Z+jets Diboson Uncertainty ATLAS 2 b-tags ≥ +jets, µ -1 = 8 TeV, 20.2 fb s [GeV] miss T E 0 50 100 150 200 Data/Pred. 0.81 1.2 0 50 100 150 200 Events / 10 GeV 2000 4000 6000 8000 10000 Datatt W+jets Single top Multijet Z+jets Diboson Uncertainty ATLAS 2 b-tags ≥ +jets, µ -1 = 8 TeV, 20.2 fb s [GeV] W T m 0 50 100 150 200 Data/Pred. 0.81 1.2
Figure 2: Distributions of the lepton and leading b-tagged jet pT, lepton and leading b-tagged jet η, ETmissand mWT in
the muon+jets channel for events with at least two b-tagged jets after event selection. The hatched bands show the normalisation uncertainty in the signal and background contributions and the signal model systematic uncertainties. The first and last bins contain underflow and overflow events, respectively.
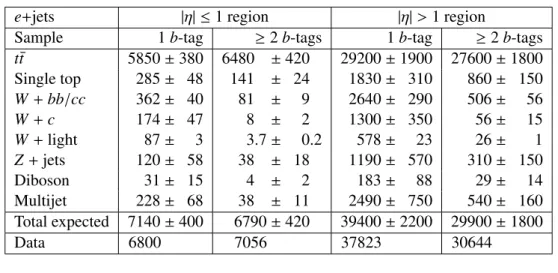
Table 1: Event yields after the event selection in the (a) electron+jets and (b) muon+jets channel for events with exactly one or at least two b-tags divided into events where all four jets associated with the t¯t decay have |η| ≤ 1 and events where at least one jet has |η| > 1. The uncertainties in the signal and background yields arising from normalisation uncertainties of each sample are shown. These correspond to the theory uncertainties as described in Section5for the background sources except for the W+jets and the multijet background, whose uncertainties originate from the data-driven methods.
(a) Electron+jets channel.
e+jets |η| ≤ 1 region |η| > 1 region
Sample 1 b-tag ≥ 2 b-tags 1 b-tag ≥ 2 b-tags
t¯t 5850 ± 380 6480 ± 420 29200 ± 1900 27600 ± 1800 Single top 285 ± 48 141 ± 24 1830 ± 310 860 ± 150 W+ bb/cc 362 ± 40 81 ± 9 2640 ± 290 506 ± 56 W+ c 174 ± 47 8 ± 2 1300 ± 350 56 ± 15 W+ light 87 ± 3 3.7 ± 0.2 578 ± 23 26 ± 1 Z+ jets 120 ± 58 38 ± 18 1190 ± 570 310 ± 150 Diboson 31 ± 15 4 ± 2 183 ± 88 29 ± 14 Multijet 228 ± 68 38 ± 11 2490 ± 750 540 ± 160 Total expected 7140 ± 400 6790 ± 420 39400 ± 2200 29900 ± 1800 Data 6800 7056 37823 30644 (b) Muon+jets channel.
µ+jets |η| ≤ 1 region |η| > 1 region
Sample 1 b-tag ≥ 2 b-tags 1 b-tag ≥ 2 b-tags
t¯t 7000 ± 450 7640 ± 490 35900 ± 2300 33500 ± 2200 Single top 369 ± 63 160 ± 27 2110 ± 360 980 ± 170 W+ bb/cc 473 ± 52 117 ± 13 3450 ± 380 756 ± 83 W+ c 223 ± 60 5 ± 1 1540 ± 420 63 ± 17 W+ light 96 ± 4 1.8 ± 0.1 797 ± 32 40 ± 2 Z+ jets 74 ± 36 16 ± 8 610 ± 290 159 ± 76 Diboson 37 ± 18 6 ± 3 198 ± 95 32 ± 15 Multijet 195 ± 59 34 ± 10 1870 ± 560 400 ± 120 Total expected 8470 ± 470 7980 ± 490 46400 ± 2500 36000 ± 2200 Data 8274 8193 46275 36471 Pi = LiQjpi, j P kLkQjpk, j .
The pi, jcontain the b-tagging efficiency or the mistag rate corresponding to the b-tagging working point,
depending on the jet j flavour assigned by KLFitter and whether it is b-tagged or not. This factor is calculated for all jets j and multiplied by the likelihood Li. KLFitter calculates the latter quantity for
each permutation in the event according to Eq. (1). The permutation with the largest event probability determines the jet-to-parton assignment that is used to build the observables m`band∆Rmin( jb, jl). In this
analysis the mass parameters are set to mW = 80.4 GeV and mt = 172.5 GeV and the decay width
assignment of jets to partons and does not exploit the fitted four-momenta for the reconstructed particles. A variation of theΓt parameter used in KLFitter was proven to have no impact on the reconstructed
distributions and thus the extracted measured value ofΓt.
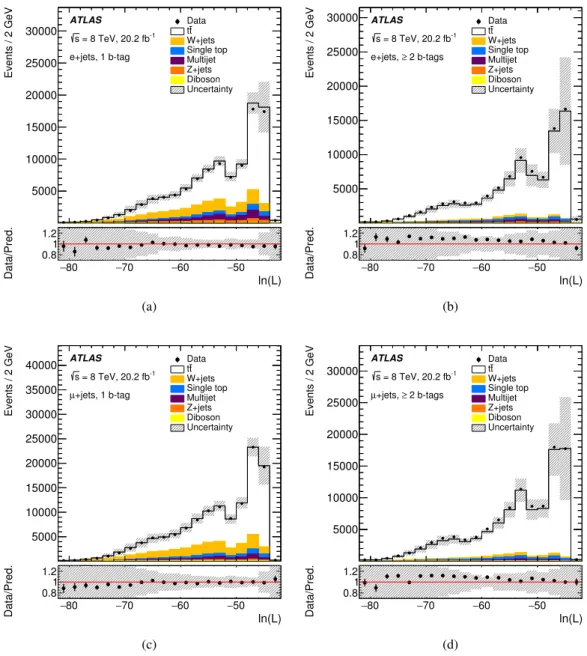
Figure 3 shows distributions of the logarithm of the likelihood for different analysis regions. Fully
matched t¯t events populate the high ln(L) region. Thus, a requirement of ln(L) > −50 removes a sig-nificant fraction of the combinatorial background. However, both background events and t¯t events with partially correctly and incorrectly matched jets contribute to the full range of likelihood values. The double peak structure of the output is thus not related to a correct match of jets but caused by the migra-tion of the events which are not matched correctly towards the higher values of the likelihood due to the fixed top quark mass requirement. The fraction of events where all four partons are matched correctly in-creases from 13% to 23% ( 17% to 31%) after applying this requirement to events with at least one (two) b-tagged jet(s). This selection also improves the purity of the sample by removing more background events than t¯t signal. The analysis does not rely on matching correctly all four jets. The observable m`b, which provides most of the sensitivity toΓt, depends solely on the correct assignment of the b-jet from
the semileptonically decaying top quark for which the reconstruction efficiency is 65% (75%) for events with at least one (two) b-tagged jet(s).
5 Template fit
The decay width of the top quark is measured using a simultaneous template fit to distributions of two observables associated with the hadronic and semileptonic decay branches of t¯t events in the eight mutu-ally exclusive analysis regions. The observables are m`b, which is the reconstructed invariant mass of the
b-jet of the semileptonically decaying top quark and the corresponding lepton, and∆Rmin( jb, jl), which
is the angular distance between the b-jet jband the closest light jet jl, both originating from the
hadron-ically decaying top quark. The choice of m`bis due to its good sensitivity toΓtwhile being less sensitive
to jet-related uncertainties compared to reconstructed masses of the hadronic decay branch. Despite the much lower sensitivity of∆Rmin( jb, jl) toΓt, it is beneficial to use it in the fit because it adds information
from the hadronic top-quark decay branch and reduces leading jet-related and signal model systematic uncertainties in the combination with m`b. Several other observables defined using the invariant mass of, or angles between, the t¯t decay products were tested but were found to be less suitable because of larger jet-related or signal model uncertainties.
Signal templates are generated by reweighting events at parton-level to Breit–Wigner distributions with alternative top-quark decay-width hypotheses. A total of 54 templates for different values of Γt are
cre-ated: 50 templates cover the range 0.1 < Γt < 5.0 GeV in steps of ∆Γ = 0.1 GeV. Four additional
templates are created forΓt = 0.01, 6, 7, 8 GeV to take into account very small and very large width
values. The top-quark decay width in the nominal MC signal sample isΓt = 1.33 GeV corresponding
to the NLO calculation. The reweighting method was validated using a signal MC sample generated withΓt = 3.0 GeV by comparing top-quark mass distributions of this sample with top-quark mass
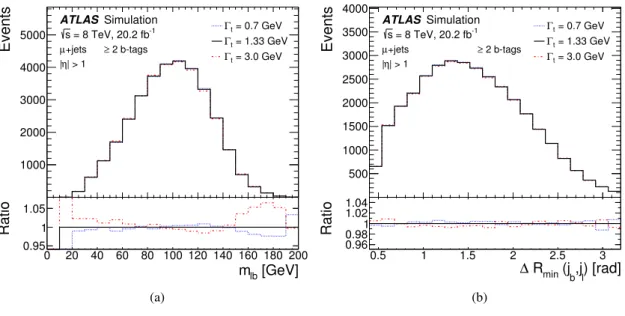
dis-tributions obtained from the reweighting procedure at parton level, and no significant differences were observed. The impact on the template distributions by varying the decay width in the range of 0.7 to 3.0 GeV is shown in Figure4.
The binned likelihood fit to data uses these signal templates for the t¯t contribution. Templates for all other processes, including single-top-quark production, are fixed. The effect on the result of using a fixed decay
80 − −70 −60 −50 Events / 2 GeV 5000 10000 15000 20000 25000 30000 Datatt W+jets Single top Multijet Z+jets Diboson Uncertainty ATLAS e+jets, 1 b-tag -1 = 8 TeV, 20.2 fb s ln(L) 80 − −70 −60 −50 Data/Pred. 0.8 1 1.2 (a) 80 − −70 −60 −50 Events / 2 GeV 5000 10000 15000 20000 25000 30000 Data t t W+jets Single top Multijet Z+jets Diboson Uncertainty ATLAS 2 b-tags ≥ e+jets, -1 = 8 TeV, 20.2 fb s ln(L) 80 − −70 −60 −50 Data/Pred. 0.8 1 1.2 (b) 80 − −70 −60 −50 Events / 2 GeV 5000 10000 15000 20000 25000 30000 35000 40000 Datatt W+jets Single top Multijet Z+jets Diboson Uncertainty ATLAS +jets, 1 b-tag µ -1 = 8 TeV, 20.2 fb s ln(L) 80 − −70 −60 −50 Data/Pred. 0.8 1 1.2 (c) 80 − −70 −60 −50 Events / 2 GeV 5000 10000 15000 20000 25000 30000 Data t t W+jets Single top Multijet Z+jets Diboson Uncertainty ATLAS 2 b-tags ≥ +jets, µ -1 = 8 TeV, 20.2 fb s ln(L) 80 − −70 −60 −50 Data/Pred. 0.8 1 1.2 (d)
Figure 3: Distributions of the logarithm of the likelihood obtained from the event reconstruction algorithm for the selected (a,b) electron+jets and (c,d) muon+jets events with (a,c) exactly one and (b,d) at least two b-tagged jets. The hatched bands show the normalisation uncertainty in the signal and background contributions and the signal model systematic uncertainties. The first and last bins contain underflow and overflow events, respectively.
Events 1000 2000 3000 4000 5000 +jets µ ATLAS Simulation 2 b-tags ≥ | > 1 η | = 0.7 GeV t Γ = 1.33 GeV t Γ = 3.0 GeV t Γ -1 = 8 TeV, 20.2 fb s [GeV] lb m 0 20 40 60 80 100 120 140 160 180 200 Ratio 0.95 1 1.05 (a) Events 500 1000 1500 2000 2500 3000 3500 4000 +jets µ ATLAS Simulation 2 b-tags ≥ | > 1 η | = 0.7 GeV t Γ = 1.33 GeV t Γ = 3.0 GeV t Γ -1 = 8 TeV, 20.2 fb s ) [rad] l ,j b (j min R ∆ 0.5 1 1.5 2 2.5 3 Ratio 0.96 0.981 1.02 1.04 (b)
Figure 4: Templates for (a) the reconstructed invariant mass of the b-jet of the semileptonically decaying top quark and the corresponding lepton, m`b, and (b)∆Rmin( jb, jl), the angular distance between the b-jet jbassociated with
the hadronic top quark and the closest light jet jlfrom the hadronically decaying W boson, in the range 0.7 ≤Γt≤
3.0 GeV in the muon+jets channel for events with at least two b-tags in the |η| > 1 region. The lower panel shows the ratio of the templates with variedΓtto the nominal template generated for a decay width ofΓt= 1.33 GeV.
width in the single-top-quark template was found to be negligible. The number of expected events per bin i is given by ni = nsignal,i+ B X j=1 nbkg, ji,
where the index j runs over all backgrounds. The likelihood for an observable O is defined as follows:
L (O|Γt)= Nbins Y i=1 Poisson(ndata,i|ni(Γt)) · B Y j=1 1 √ 2πσbkg, j exp −(nbkg, j− ˆnbkg, j)2 2σ2bkg, j , (2)
where Nbinsis the number of bins in a template and ndata,iis the number of data events in each bin i. The
number of events from a background source j, nbkg, j, is obtained from nbkg, jiby summing over all bins i.
This number of background events varies in the fit but it is constrained by Gaussian terms where ˆnbkg, jis
the expected number of background events for source j and σbkg, jis its uncertainty. The total number of
signal events is a free parameter of the fit. For each background source j only one fit parameter nbkg, j is
used for all b-tag bins, lepton channels and |η| regions except for the multijet background. For the latter, separate parameters are defined for each analysis region.
The uncertainties used as constraints in Eq. (2) on the W+jets background components normalisation originating from data-driven calibration (see Section3) amount to 7% for W + b¯b and W + c¯c, 25% for
W+ c, and 5% for W+light jets events. The uncertainty in the multijet background is taken from the matrix method and amounts to 30%. For the Z+jets and diboson events, a 4% theory uncertainty in the inclusive cross-section is applied together with a 24% uncertainty per additional jet added in quadrature, which covers the extrapolation to higher jet multiplicities based on MC studies, resulting in an uncertainty of 48% for events with four jets. The uncertainty in single-top-quark production amounts to 17% and considers the variation of initial- and final-state radiation in the t-channel MC samples and accounts for extra jets in single-top-quark events.
The fit is performed for 55 templates (54 obtained from the reweighting algorithm and the nominal one). The combined likelihood, defined as the product of two Poisson terms as given in Eq. (2), one for each observable, multiplied by the Gaussian constraints, is maximised for every value ofΓt. The measured
top-quark decay width is extracted from the minimum of a quadratic fit to the negative logarithm of the likeli-hood values. The fit method was validated using pseudo-experiments, and the correlation between the two observables was examined. In each pseudo-experiment the content of the bins of the m`band∆Rmin( jb, jl)
distributions are varied according to the Poisson and Gaussian distributions to take into account the expec-ted number of events per bin and the background constraints, respectively. These pseudo-experiments are used for a linearity test and to produce pull distributions. The pull is defined as the difference between the fitted valueΓtand the input value divided by the estimated uncertainty of the fit result. No deviations from
the expectation were found for various decay width values within 1.1 <Γt < 4.0 GeV. For smaller decay
width values the pull width decreases since theΓt distribution approaches a limit of 0 GeV. However,
this does not affect the result and the fit method is stable and unbiased. Additional pseudo-experiments revealed that the small correlation between m`b and∆Rmin( jb, jl) of about (0.1–2.8)% does not affect the
fit result. The observables are thus treated as independent.
6 Systematic uncertainties
Systematic uncertainties affect the normalisation of signal and background and the shape of the distribu-tions sensitive to the top-quark decay width. Individual sources of systematic uncertainty are considered uncorrelated and are summed in quadrature to determine the total uncertainty. Correlations of systematic uncertainties from the same source are fully maintained for all analysis regions. Pseudo-experiments are used to estimate the impact of the different sources of uncertainty according to the following proced-ure. For each source of systematic uncertainty, templates corresponding to the respective up and down variations are created. These variations consider shape and acceptance changes from the systematic uncer-tainty source under study. Pseudo-data sets are generated by imposing Poisson fluctuations and Gaussian fluctuations on the background contributions (to account for the Gaussian constraints) to each bin, as de-scribed in Section5. Then the nominal and varied templates are used to perform a fit to pseudo-data. For each systematic variation 2000 of these pseudo-experiments were performed, and the differences between the means of the fitted-value distribution using the nominal templates and the up and down variations are quoted as the systematic uncertainty from this source. The systematic uncertainties in the measurement of the top-quark decay width are summarised in Table2.
6.1 Uncertainties in detector modelling
The systematic uncertainties arising from charged leptons are classified into several categories, related to the reconstruction and trigger efficiency, the identification and the lepton momentum scale and resolution.
This leads to five (six) components of uncertainties associated with the electron (muon).
Jet-related uncertainties arise from the jet reconstruction efficiency, the jet vertex fraction requirement, the jet energy resolution (JER) and the jet energy scale. The JES and its uncertainties were derived by combining information from test-beam data, LHC collision data and simulation [65,66]. The JES calib-ration is described in Section4.1. The jet energy scale uncertainty is split into 26 pT- and η-dependent
sources, treated independently. It is the largest of the detector modelling uncertainties in this analysis. The JER was evaluated separately for data and simulation using two in situ techniques [65], improved by additional in situ measurements using dijet, photon+jet or Z+jet processes. For low-pTjets, a significant
contribution to the JER uncertainty comes from pile-up, measured as in Ref. [66]. The JER uncertainty consists of 11 components and represents an important uncertainty in this measurement. The systematic uncertainties originating from these components are summed in quadrature. The symmetrised difference is the quoted systematic uncertainty in the JER.
The per-jet efficiency to pass the JVF selection is evaluated in Z(→ `+`−)+1-jet events in data and
simu-lation [67]. Motivated by this study, the uncertainty is estimated by changing the JVF requirement value, increasing and decreasing it by 0.1, and repeating the analysis using this modified value.
Energy scale and resolution correction uncertainties of both the leptons and jets are propagated into the calculation of ETmiss. Contributions from energy deposits not associated with any jet and due to soft-jets (7 GeV < pT < 20 GeV) are also considered and treated as fully correlated with each other. A further
ETmissuncertainty accounts for mis-modeling of pileup energy deposits.
The jet-flavour-dependent efficiencies of the b-tagging algorithm are calibrated using data. The b-tagging efficiency is corrected to match the efficiency measured in the t¯t data events using the probability density function calibration method [70, 71] based on a combinatorial likelihood applied to a data sample of dileptonic t¯t events. The mistag rate for c-jets is measured using D∗ mesons, the one for light jets is measured using jets with impact parameters and secondary vertices consistent with a negative lifetime [69,
71]. Efficiencies for b- and c-jets are corrected in simulations by pT-dependent scale factors. For light jets,
these scale factors also depend on the pseudorapidity. Six independent sources of uncertainty affecting the b-tagging efficiency and four affecting the c-tagging efficiency are considered [70]. For the mistagging of light-quark jets, 12 uncertainties which depend on jet pTand η [71] are considered.
6.2 Uncertainties in background modelling
The uncertainties in the background normalisation are included as Gaussian constraints in the fit (see Eq. (2)) and thus contribute to the overall statistical uncertainty.
To estimate the uncertainty in the shape modelling of the W+jets background, each of its flavour com-ponents (W+b¯b/c¯c, W+c and W+light) is allowed to vary independently in the fit within its uncertainty, corresponding to the uncertainty in the calibration factors. The shape uncertainty of the W+jets contribu-tion is retrieved by varying one component while fixing the other two to their respective normalisacontribu-tions, as given in Section3.
Two simulated samples are compared to estimate the modelling uncertainty of single-top events. The baseline MC event generator for Wt production uses the diagram removal technique [76] to account for the overlap with t¯t events. This sample is compared to a sample generated with the inclusive diagram
subtraction technique [76]. The difference is then symmetrised, i.e. the difference of the two-point com-parison is taken as the uncertainty on both sides of the nominal result.
For the multijet background an uncertainty in the total yield of ±30% is assigned. Furthermore, two shape uncertainties are defined by varying the control samples used to obtain the efficiencies used in the matrix method to relate the two identification levels for objects considered as fake or non-prompt and prompt leptons, respectively.
The background yields estimated from MC simulation are affected by the luminosity uncertainty of 1.9% [20], which is propagated to the constraints on the background yields.
6.3 Uncertainties in signal modelling
Several uncertainties affect the shape of the t¯t signal contributions. The uncertainties due to initial- and final-state radiation are determined using two dedicated Powheg+Pythia samples (see Section3) gener-ated with varied parameter values giving more or less radiation. Pseudo-data is cregener-ated using each sample, and the largest variation of the top-quark decay width from the nominal is taken as an uncertainty and then symmetrised.
The Powheg MC event generator interfaced to Pythia is compared to Powheg interfaced with Herwig to estimate the uncertainty due to the parton shower and the hadronisation model. To estimate the uncer-tainty in the choice of the t¯t event generator, the full difference between Powheg and MC@NLO event generators, both interfaced with Herwig, is evaluated. This is the largest signal modelling uncertainty in this measurement. The uncertainty of the colour reconnection modelling is estimated by compar-ing the nominal t¯t sample to a Powheg sample interfaced with Pythia with the Perugia parameter tune “P2012IoCR“ [27] for colour reconnection. This tune has a slightly lower colour reconnection strength than the default tune, which affects the corresponding colour strings, and is combined with a slightly modified colour reconnection algorithm. The uncertainty in the underlying-event modelling is determ-ined by comparing the nominal t¯t sample with a Powheg sample interfaced with Pythia employing the Perugia parameter tune “P2012mpiHI” [27] for multiparton interactions. This tune increases the number of multi-parton interaction (MPI) scatterings, which leads to an increase in MPI minijets. This is realised by a larger αS value associated with the MPI. The uncertainties due to these four sources are taken as the
difference between the nominal and the varied sample and symmetrised, i.e. the full difference is taken as the positive and negative uncertainty.
Following the PDF4LHC [77] recommendations, three different PDF sets are compared using a reweight-ing technique for the signal t¯t MC sample to estimate the uncertainty due to the PDF set choice: CT10 NLO (nominal PDF set) [25], MSTW 2008 68% CL NLO [52] and NNPDF 2.3 NLO [78]. Each PDF set has a different prescription for using its error sets to evaluate the uncertainty: the CT10 set uses a symmetric Hessian matrix, the MSTW set uses an asymmetric Hessian matrix and the NNPDF set uses a standard deviation for the uncertainty calculation. For the three PDF sets, the variations for all different PDF parameters are evaluated within the corresponding set. Half of the width of the largest deviation from nominal among all three sets is taken as the PDF uncertainty.
6.4 NLO and off-shell effects in the top-quark decay
The t¯t MC simulation utilised to extract the decay width uses NLO matrix elements for top-quark pair production and LO matrix elements with approximate implementation of finite-width and interference effects for the decay of the top quarks. A theoretical study [79] performed in the eµ decay channel of the t¯t system indicates that taking into account off-shell effects, which include the contributions from t¯t and Wt single-top production as well as their interference, is important for the precision measurements of top-quark properties. However, there is no MC implementation yet of NLO decay and off-shell effects for the lepton+jets final state. The potential impact of ignoring these effects was tested in two different ways. First, the parton-level m`bdistribution of a sum of t¯t and Wt single-top contributions without these effects taken into account was reweighted to the m`b distribution provided by the authors of Ref. [79] which corresponds to the WWb¯b calculation at NLO. Second, the measurement was repeated requiring m`b < 150 GeV, limiting the analysis to the region where these effects are expected to be suppressed
according to Ref. [79]. Both cross-checks yield a difference in the measured top-quark decay width of
less than 0.5 GeV. For more precise future measurements, it would be beneficial to have an MC simulation providing an NLO description of the top-quark decay accounting for off-shell effects.
6.5 Template statistical uncertainty
To estimate the systematic uncertainty arising from the limited MC sample size used to produce the templates, the content of each bin of the signal and background templates is varied within its statistical uncertainty and a fit to the nominal distribution is repeated. The MC statistical uncertainty is derived with and without taking into account the correlations between the templates and both estimates yield consistent results. The standard deviation of the distribution of top-quark decay width values obtained from the fits with the fluctuated templates is quoted as the systematic effect from the template statistical uncertainty.
7 Result
The binned likelihood template fit is applied to the data using the concatenated distributions of m`b and ∆Rmin( jb, jl) in the eight analysis regions. Figure5shows post-fit distributions for m`band∆Rmin( jb, jl).
The post-fit yields of the t¯t signal and each background contribution are summarised in Table3.
The likelihood curve obtained from the fit can be seen in Figure 6together with a quadratic fit to the likelihood points. The statistical uncertainty, which includes contributions from the data statistics and the uncertainties in the backgrounds normalisation, is extracted from the likelihood curve’s width at −2∆ ln(L ) = 1 around the minimum. The likelihood values are shifted so that the minimum corres-ponds to −2∆ ln(L ) = 0.
The measured decay width for a top-quark mass of 172.5 GeV is
Γt = 1.76 ± 0.33 (stat.)+0.79−0.68(syst.) GeV= 1.76+0.86−0.76GeV ,
in good agreement with the SM prediction of 1.322 GeV [9]. A consistency check was performed by repeating the measurement in the individual b-tag regions and confirms that the results are consistent
Events / 7.5 GeV 500
1000 DataBackground tUncertaintyt signal
ATLAS -1 = 8 TeV, 20.2 fb s 1 ≤ | η Post-fit, | e+jets 1 b-tag e+jets 2 b-tags ≥ +jets µ 1 b-tag +jets µ 2 b-tags ≥ [GeV] lb m 30 105 180|30 105 180|30 105 180|30 105 Data/Fit 0.8 1 1.2 Events / 10 GeV 2000 4000 6000 Data tt signal Background Uncertainty ATLAS -1 = 8 TeV, 20.2 fb s | > 1 η Post-fit, | e+jets 1 b-tag e+jets 2 b-tags ≥ +jets µ 1 b-tag +jets µ 2 b-tags ≥ [GeV] lb m 0 100 200|0 100 200|0 100 200|0 100 Data/Fit 0.8 1 1.2 (a) Events / 0.12 200 400 600 800 Data tt signal Background Uncertainty ATLAS -1 = 8 TeV, 20.2 fb s 1 ≤ | η Post-fit, | e+jets 1 b-tag e+jets 2 b-tags ≥ +jets µ 1 b-tag +jets µ 2 b-tags ≥ ) [rad] l ,j b (j min R ∆ 0.4 1.6 2.8|0.4 1.6 2.8|0.4 1.6 2.8|0.4 1.0 Data/Fit 0.8 1 1.2 Events / 0.14 1000 2000 3000 4000 Data tt signal Background Uncertainty ATLAS -1 = 8 TeV, 20.2 fb s | > 1 η Post-fit, | e+jets 1 b-tag e+jets 2 b-tags ≥ +jets µ 1 b-tag +jets µ 2 b-tags ≥ ) [rad] l ,j b (j min R ∆ 0.4 1.8 3.2|0.4 1.8 3.2|0.4 1.8 3.2|0.4 1.1 Data/Fit 0.8 1 1.2 (b)
Figure 5: Post-fit distributions based on the best-fit templates for (a) m`b and (b)∆Rmin( jb, jl). The background
contributions are combined. The lower panel shows the ratio of data to post-fit sum of t¯t signal and background. The eight analysis regions corresponding to different b-tag multiplicity and jet pseudorapidity are shown. The vertical lines show the boundaries between the binned variables in different lepton and b-tag regions. The hatched band shows the total uncertainty. The systematic uncertainties are calculated bin-by-bin from the systematic variations by adding differences in quadrature. Then, statistical and systematic uncertainties are added in quadrature to obtain the quoted total uncertainty.
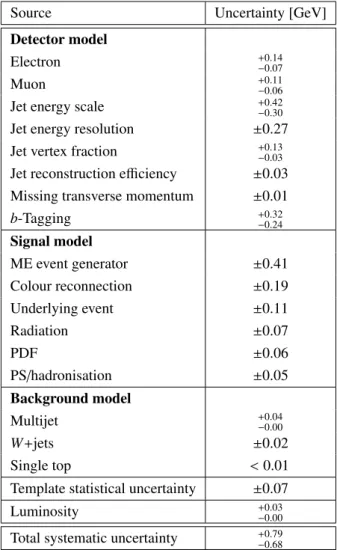
Table 2: Summary of systematic uncertainties in the top-quark decay width measurement.
Source Uncertainty [GeV]
Detector model
Electron +0.14−0.07
Muon +0.11−0.06
Jet energy scale +0.42−0.30
Jet energy resolution ±0.27
Jet vertex fraction +0.13−0.03
Jet reconstruction efficiency ±0.03
Missing transverse momentum ±0.01
b-Tagging +0.32−0.24 Signal model ME event generator ±0.41 Colour reconnection ±0.19 Underlying event ±0.11 Radiation ±0.07 PDF ±0.06 PS/hadronisation ±0.05 Background model Multijet +0.04−0.00 W+jets ±0.02 Single top < 0.01
Template statistical uncertainty ±0.07
Luminosity +0.03−0.00
Total systematic uncertainty +0.79−0.68
with the measured value. A fit based only on the observable m`b leads to a total uncertainty which is about 0.3 GeV larger.
In comparison to the previous direct top-quark decay width measurement in Ref. [18], the total uncertainty of this measurement is smaller by a factor of around two. However, this result is still less precise than indirect measurements and, thus, alternative (BSM) models discussed in Section1cannot be ruled out with the current sensitivity.
The impact of the assumed top-quark mass on the decay width measurement is estimated by varying the mass around the nominal value of mt = 172.5 GeV. Changing the top-quark mass by ±0.5 GeV leads to a
Table 3: Post-fit yields of the t¯t signal and background contributions. The yields represent the sum of the number of events in each of the eight analysis regions. Only the normalisation uncertainties are shown.
Sample Post-fit yields
t¯t 156360 ± 750 Single top 5700 ± 930 W + bb/cc 7060 ± 510 W + c 1650 ± 550 W + light 1603 ± 65 Z+ jets 2770 ± 710 Diboson 320 ± 240 Multijet 6070 ± 380 Total 181600 ± 1700 Data 181536 [GeV] t Γ 1.4 1.5 1.6 1.7 1.8 1.9 2 2.1 2.2 ln(L) ∆ -2 0 0.2 0.4 0.6 0.8 1 1.2 Data Quadratic Fit ATLAS -1 = 8 TeV, 20.2 fb s
Figure 6: Twice the negative logarithm of the likelihood obtained from the binned likelihood template fit to data. A quadratic fit is performed around the minimum.
8 Conclusion
A direct measurement of the decay width of the top quark exploiting t¯t events in the lepton+jets channel was performed using data taken in proton–proton collisions at √s = 8 TeV corresponding to an integ-rated luminosity of 20.2 fb−1 recorded by the ATLAS detector at the LHC. The decay width of the top quark is extracted using a binned likelihood template fit to data based on two observables related to the hadronic and the semileptonic decay branches of the t¯t pair. The top-quark decay width is measured to beΓt = 1.76 ± 0.33 (stat.)+0.79−0.68(syst.) GeV for mt = 172.5 GeV, which is in a good agreement with SM
Acknowledgements
We thank CERN for the very successful operation of the LHC, as well as the support staff from our institutions without whom ATLAS could not be operated efficiently.
We acknowledge the support of ANPCyT, Argentina; YerPhI, Armenia; ARC, Australia; BMWFW and FWF, Austria; ANAS, Azerbaijan; SSTC, Belarus; CNPq and FAPESP, Brazil; NSERC, NRC and CFI, Canada; CERN; CONICYT, Chile; CAS, MOST and NSFC, China; COLCIENCIAS, Colombia; MSMT CR, MPO CR and VSC CR, Czech Republic; DNRF and DNSRC, Denmark; IN2P3-CNRS, CEA-DRF/IRFU, France; SRNSFG, Georgia; BMBF, HGF, and MPG, Germany; GSRT, Greece; RGC, Hong Kong SAR, China; ISF, I-CORE and Benoziyo Center, Israel; INFN, Italy; MEXT and JSPS, Ja-pan; CNRST, Morocco; NWO, Netherlands; RCN, Norway; MNiSW and NCN, Poland; FCT, Portugal; MNE/IFA, Romania; MES of Russia and NRC KI, Russian Federation; JINR; MESTD, Serbia; MSSR, Slovakia; ARRS and MIZŠ, Slovenia; DST/NRF, South Africa; MINECO, Spain; SRC and Wallen-berg Foundation, Sweden; SERI, SNSF and Cantons of Bern and Geneva, Switzerland; MOST, Taiwan; TAEK, Turkey; STFC, United Kingdom; DOE and NSF, United States of America. In addition, indi-vidual groups and members have received support from BCKDF, the Canada Council, CANARIE, CRC, Compute Canada, FQRNT, and the Ontario Innovation Trust, Canada; EPLANET, ERC, ERDF, FP7, Horizon 2020 and Marie Skłodowska-Curie Actions, European Union; Investissements d’Avenir Labex and Idex, ANR, Région Auvergne and Fondation Partager le Savoir, France; DFG and AvH Foundation, Germany; Herakleitos, Thales and Aristeia programmes co-financed by EU-ESF and the Greek NSRF; BSF, GIF and Minerva, Israel; BRF, Norway; CERCA Programme Generalitat de Catalunya, Generalitat Valenciana, Spain; the Royal Society and Leverhulme Trust, United Kingdom.
The crucial computing support from all WLCG partners is acknowledged gratefully, in particular from CERN, the ATLAS Tier-1 facilities at TRIUMF (Canada), NDGF (Denmark, Norway, Sweden), CC-IN2P3 (France), KIT/GridKA (Germany), INFN-CNAF (Italy), NL-T1 (Netherlands), PIC (Spain), ASGC (Taiwan), RAL (UK) and BNL (USA), the Tier-2 facilities worldwide and large non-WLCG resource pro-viders. Major contributors of computing resources are listed in Ref. [80].
References
[1] CDF Collaboration, Observation of top quark production in ¯pp collisions,
Phys. Rev. Lett. 74 (1995) 2626, arXiv:hep-ex/9503002.
[2] D0 Collaboration, Observation of the top quark,Phys. Rev. Lett. 74 (1995) 2632, arXiv:hep-ex/9503003.
[3] ATLAS Collaboration,
Measurement of the top quark mass in the t¯t → dilepton channel from √s= 8 TeV ATLAS data,
Phys. Lett. B 761 (2016), arXiv:1606.02179 [hep-ex]. [4] CMS Collaboration,
Measurement of the top quark mass using proton-proton data at √s= 7 and 8 TeV,
Phys. Rev. D 93 (2016) 072004, arXiv:1509.04044 [hep-ex].
[5] Tevatron Electroweak Working Group, Combination of CDF and D0 results on the mass of the top quark using up to 9.7 fb−1at the Tevatron, (2014), arXiv:1407.2682 [hep-ex].
[6] K. G. Chetyrkin, R. Harlander, T. Seidensticker and M. Steinhauser,
Second order QCD corrections toΓ(t → Wb),Phys. Rev. D 60 (1999) 114015, arXiv:hep-ph/9906273.
[7] A. Czarnecki and K. Melnikov, Two loop QCD corrections to top quark width,
Nucl. Phys. B 544 (1999) 520, arXiv:hep-ph/9806244.
[8] C. Patrignani et al., Review of Particle Physics,Chin. Phys. C40 (2016) 100001.
[9] J. Gao, C. S. Li and H. X. Zhu, Top Quark Decay at Next-to-Next-to Leading Order in QCD,
Phys. Rev. Lett. 110 (2013) 042001, arXiv:1210.2808 [hep-ph].
[10] W. Bernreuther, Top quark physics at the LHC,J. Phys. G 35 (2008) 083001, arXiv:0805.1333 [hep-ph].
[11] D. P. Roy, Looking for the charged Higgs boson,Mod. Phys. Lett. A 19 (2004) 1813, arXiv:hep-ph/0406102.
[12] F. Larios, R. Martinez and M. A. Perez,
New physics effects in the flavor-changing neutral couplings of the top quark,
Int. J. Mod. Phys. A 21 (2006) 3473, arXiv:hep-ph/0605003. [13] T. Han, K. Whisnant, B.-L. Young and X. Zhang,
Top-quark decay via the anomalous coupling tcγ at hadron colliders,
Phys. Rev. D 55 (1997) 7241, arXiv:hep-ph/9603247.
[14] M. J. Herrero, Indirect heavy SUSY signals in Higgs and top decays, arXiv:hep-ph/0109291. [15] J. Alwall et al., Is Vtb≈ 1?,Eur. Phys. J. C 49 (2007) 791, arXiv:hep-ph/0607115.
[16] D0 Collaboration, Improved determination of the width of the top quark,
Phys. Rev. D 85 (2012) 091104, arXiv:1201.4156 [hep-ex]. [17] CMS Collaboration,
Measurement of the ratio B(t → Wb)/B(t → Wq) in pp collisions at √s= 8 TeV,
Phys. Lett. B 736 (2014) 33, arXiv:1404.2292 [hep-ex].
[18] CDF Collaboration, Direct Measurement of the Total Decay Width of the Top Quark,
[19] ATLAS Collaboration, The ATLAS Experiment at the CERN Large Hadron Collider,
JINST 3 (2008) S08003. [20] ATLAS Collaboration,
Luminosity determination in pp collisions at √s= 8 TeV using the ATLAS detector at the LHC,
Eur. Phys. J. C 76 (2016) 653, arXiv:1608.03953 [hep-ex].
[21] P. Nason, A new method for combining NLO QCD with shower Monte Carlo algorithms,
JHEP 11 (2004) 040, arXiv:hep-ph/0409146. [22] S. Frixione, P. Nason and C. Oleari,
Matching NLO QCD computations with parton shower simulations: the POWHEG method,
JHEP 11 (2007) 070, arXiv:0709.2092 [hep-ph].
[23] S. Alioli, P. Nason, C. Oleari and E. Re, A general framework for implementing NLO calculations in shower Monte Carlo programs: the POWHEG BOX,JHEP 06 (2010) 040,
arXiv:1002.2581 [hep-ph]. [24] S. Frixione, P. Nason and G. Ridolfi,
A Positive-weight next-to-leading-order Monte Carlo for heavy flavour hadroproduction,
JHEP 09 (2007) 126, arXiv:0707.3088 [hep-ph].
[25] H.-L. Lai et al., New parton distributions for collider physics,Phys. Rev. D 82 (2010) 074024, arXiv:1007.2241 [hep-ph].
[26] T. Sjöstrand, S. Mrenna and P. Z. Skands, PYTHIA 6.4 Physics and Manual,JHEP 05 (2006) 026, arXiv:hep-ph/0603175 [hep-ph].
[27] P. Z. Skands, Tuning Monte Carlo generators: The Perugia tunes,
Phys. Rev. D 82 (2010) 074018, arXiv:1005.3457 [hep-ph]. [28] J. Pumplin et al.,
New generation of parton distributions with uncertainties from global QCD analysis,
JHEP 07 (2002) 012, arXiv:hep-ph/0201195.
[29] G. Corcella et al., HERWIG 6: an event generator for hadron emission reactions with interfering gluons (including supersymmetric processes),JHEP 01 (2001) 010, arXiv:hep-ph/0011363. [30] J. M. Butterworth, J. R. Forshaw and M. H. Seymour,
Multiparton interactions in photoproduction at HERA,Z. Phys. C 72 (1996) 637, arXiv:hep-ph/9601371.
[31] S. Frixione and B. R. Webber, Matching NLO QCD computations and parton shower simulations,
JHEP 06 (2002) 029, arXiv:hep-ph/0204244. [32] S. Frixione, P. Nason and B. R. Webber,
Matching NLO QCD and parton showers in heavy flavor production,JHEP 08 (2003) 007, arXiv:hep-ph/0305252.
[33] ATLAS Collaboration, Measurements of fiducial cross-sections for t¯t production with one or two additional b-jets in pp collisions at √s=8 TeV using the ATLAS detector,
Eur. Phys. J. C 76 (2016) 11, arXiv:1508.06868 [hep-ex].
[34] ATLAS Collaboration, Measurement of jet activity in top quark events using the eµ final state with two b-tagged jets in pp collisions at √s= 8 TeV with the ATLAS detector,
[35] M. Cacciari, M. Czakon, M. L. Mangano, A. Mitov and P. Nason, Top-pair production at hadron colliders with next-to-next-to-leading logarithmic soft-gluon resummation,
Phys. Lett. B 710 (2012) 612, arXiv:1111.5869 [hep-ph].
[36] P. Bärnreuther, M. Czakon and A. Mitov, Percent Level Precision Physics at the Tevatron: First Genuine NNLO QCD Corrections to q¯q → t¯t+ X,Phys. Rev. Lett. 109 (2012) 132001,
arXiv:1204.5201 [hep-ph].
[37] M. Czakon and A. Mitov, NNLO corrections to top-pair production at hadron colliders: the all-fermionic scattering channels,JHEP 12 (2012) 054, arXiv:1207.0236 [hep-ph]. [38] M. Czakon and A. Mitov,
NNLO corrections to top-pair production at hadron colliders: the quark-gluon reaction,
JHEP 01 (2013) 080, arXiv:1210.6832 [hep-ph]. [39] M. Czakon, P. Fiedler and A. Mitov,
The total top quark pair production cross-section at hadron colliders through O(α4S),
Phys. Rev. Lett. 110 (2013) 252004, arXiv:1303.6254 [hep-ph]. [40] M. Czakon and A. Mitov,
Top++: A program for the calculation of the top-pair cross-section at hadron colliders,
Comput. Phys. Commun. 185 (2014) 2930, arXiv:1112.5675 [hep-ph]. [41] M. L. Mangano et al.,
ALPGEN, a generator for hard multiparton processes in hadronic collisions,
JHEP 07 (2003) 001, arXiv:hep-ph/0206293.
[42] M. L. Mangano et al., Multijet matrix elements and shower evolution in hadronic collisions: Wb¯b+ n jets as a case study,Nucl. Phys. B 632 (2002) 343, arXiv:hep-ph/0108069.
[43] ATLAS Collaboration, Measurement of the charge asymmetry in top-quark pair production in the lepton-plus-jets final state in pp collision data at √s= 8 TeV with the ATLAS detector,
Eur. Phys. J. C 76 (2016) 87, arXiv:1509.02358 [hep-ex]. [44] K. Melnikov and F. Petriello,
Electroweak gauge boson production at hadron colliders through O(α2s),
Phys. Rev. Lett. 74 (2006) 114017, arXiv:hep-ph/0609070.
[45] T. Gleisberg et al., Event generation with SHERPA 1.1,JHEP 02 (2009) 007, arXiv:0811.4622 [hep-ph].
[46] J. Campbell and R. Ellis, An update on vector boson pair production at hadron colliders,
Phys. Rev. Lett. 60 (1999) 113006, arXiv:hep-ph/9905386. [47] S. Alioli, P. Nason, C. Oleari and E. Re,
NLO single-top production matched with shower in POWHEG: s- and t-channel contributions,
JHEP 09 (2009) 111, [Erratum: JHEP02,011(2010)], arXiv:0907.4076 [hep-ph]. [48] E. Re,
Single-top Wt-channel production matched with parton showers using the POWHEG method,
Eur. Phys. J. C 71 (2011) 1547, arXiv:1009.2450 [hep-ph].
[49] S. Frixione, E. Laenen, P. Motylinski and B. R. Webber, Single-top production in MC@NLO,
JHEP 03 (2006) 092, arXiv:hep-ph/0512250.
[50] N. Kidonakis, Next-to-next-to-leading-order collinear and soft gluon corrections for t-channel single top quark production,Phys. Rev D 83 (2011) 091503, arXiv:1103.2792 [hep-ph].
[51] N. Kidonakis,
Next-to-next-to-leading logarithm resummation for s-channel single top quark production,
Phys. Rev. Lett. 81 (2010) 054028, arXiv:1001.5034 [hep-ph].
[52] A. D. Martin et al., Parton distributions for the LHC,Eur. Phys. J. C 63 (2009) 189, arXiv:0901.0002 [hep-ph].
[53] ATLAS Collaboration, Measurement of the top quark-pair production cross section with ATLAS in pp collisions at √s= 7TeV,Eur. Phys. J. C 71 (2011) 1577, arXiv:1012.1792 [hep-ex]. [54] ATLAS Collaboration, The ATLAS Simulation Infrastructure,Eur. Phys. J. C 70 (2010) 823,
arXiv:1005.4568 [physics.ins-det].
[55] S. Agostinelli et al., Geant4: a simulation toolkit,Nucl. Instrum. Meth. 506 (2003) 250. [56] ATLAS Collaboration,
The simulation principle and performance of the ATLAS fast calorimeter simulation FastCaloSim, ATL-PHYS-PUB-2010-013, 2010, url:https://cds.cern.ch/record/1300517.
[57] ATLAS Collaboration, Summary of ATLAS Pythia 8 tunes, ATL-PHYS-PUB-2012-003, 2012, url:https://cds.cern.ch/record/1474107.
[58] ATLAS Collaboration, Electron efficiency measurements with the ATLAS detector using 2012 LHC proton-proton collision data,Eur. Phys. J. C 77 (2017) 195, arXiv:1612.01456 [hep-ex]. [59] ATLAS Collaboration, Measurement of the muon reconstruction performance of the ATLAS
detector using 2011 and 2012 LHC proton–proton collision data,Eur. Phys. J. C 74 (2014) 3130, arXiv:1407.3935 [hep-ex].
[60] M. Cacciari, G. P. Salam and G. Soyez, The anti-ktjet clustering algorithm,JHEP 04 (2008) 063,
arXiv:0802.1189 [hep-ph].
[61] M. Cacciari, G. P. Salam and G. Soyez, FastJet user manual,Eur. Phys. J. C 72 (2012) 1896, arXiv:1111.6097 [hep-ph].
[62] ATLAS Collaboration,
Topological cell clustering in the ATLAS calorimeters and its performance in LHC Run 1,
Eur. Phys. J. C 77 (2017) 490, arXiv:1603.02934 [hep-ex].
[63] C. Cojocaru et al., Hadronic calibration of the ATLAS liquid argon end-cap calorimeter in the pseudorapidity region1.6 < |η| < 1.8 in beam tests,Nucl. Instrum. Meth. 531 (2004) 481, arXiv:physics/0407009 [physics.ins-det].
[64] T. Barillari et al., Local Hadronic Calibration, ATL-LARG-PUB-2009-001-2, 2008, url:https://cds.cern.ch/record/1112035.
[65] ATLAS Collaboration,
Jet energy measurement with the ATLAS detector in proton-proton collisions at √s= 7 TeV,
Eur. Phys. J. C 73 (2013) 2304, arXiv:1112.6426 [hep-ex].
[66] ATLAS Collaboration, Monte Carlo Calibration and Combination of In-situ Measurements of Jet Energy Scale, Jet Energy Resolution and Jet Mass in ATLAS, ATLAS-CONF-2015-037, 2015, url:https://cds.cern.ch/record/2044941.
[67] ATLAS Collaboration, Performance of pile-up mitigation techniques for jets in pp collisions at √
s= 8 TeV using the ATLAS detector,Eur. Phys. J. C 76 (2016) 581, arXiv:1510.03823 [hep-ex].
[68] ATLAS Collaboration, Pile-up subtraction and suppression for jets in ATLAS, ATLAS-CONF-2013-083, 2013, url:https://cds.cern.ch/record/1570994. [69] ATLAS Collaboration, Performance of b-jet identification in the ATLAS experiment,
JINST 11 (2016) P04008, arXiv:1512.01094 [hep-ex].
[70] ATLAS Collaboration, Calibration of b-tagging using dileptonic top pair events in a
combinatorial likelihood approach with the ATLAS experiment, ATLAS-CONF-2014-004, 2014, url:https://cds.cern.ch/record/1664335.
[71] ATLAS Collaboration,
Calibration of the performance of b-tagging for c and light-flavour jets in the 2012 ATLAS data, ATLAS-CONF-2014-046, 2014, url:https://cds.cern.ch/record/1741020.
[72] ATLAS Collaboration, Performance of algorithms that reconstruct missing transverse momentum in √s= 8 TeV proton–proton collisions in the ATLAS detector,Eur. Phys. J. C 77 (2017) 241, arXiv:1609.09324 [hep-ex].
[73] ATLAS Collaboration,
Selection of jets produced in proton–proton collisions with the ATLAS detector using 2011 data, ATLAS-CONF-2012-020, 2012, url:https://cds.cern.ch/record/1430034.
[74] J. Erdmann et al.,
A likelihood-based reconstruction algorithm for top-quark pairs and the KLFitter framework,
Nucl. Instrum. Meth. A 748 (2014) 18, arXiv:1312.5595 [hep-ex]. [75] A. Caldwell, D. Kollar and K. Kröninger, BAT: The Bayesian analysis toolkit,
Comput. Phys. Commun. 180 (2009) 2197, arXiv:0808.2552 [physics.data-an]. [76] S. Frixione, E. Laenen, P. Motylinski, B. R. Webber and C. D. White,
Single-top hadroproduction in association with a W boson,JHEP 07 (2008) 029, arXiv:0805.3067 [hep-ph].
[77] M. Botje et al., The PDF4LHC Working Group Interim Recommendations, 2011, arXiv:1101.0538 [hep-ph].
[78] R. D. Ball et al., Parton distributions with LHC data,Nucl. Phys. B 867 (2013) 244, arXiv:1207.1303 [hep-ph].
[79] T. Je˘zo, J. M. Lindert, P. Nason, C. Oleari and S. Pozzorini, An NLO+PS generator for t¯t and Wt production and decay including non-resonant and interference effects,
Eur. Phys. J. C 76 (2016) 691, arXiv:1607.04538 [hep-ph].
[80] ATLAS Collaboration, ATLAS Computing Acknowledgements 2016–2017, ATL-GEN-PUB-2016-002, url:https://cds.cern.ch/record/2202407.