EUROPEAN ORGANIZATION FOR NUCLEAR RESEARCH (CERN)
CERN-PH-EP-2014-175 LHCb-PAPER-2014-033 December 18, 2014
Measurement of the forward
W boson cross-section
in pp collisions at
√
s = 7 TeV
The LHCb collaboration†
Abstract
A measurement of the inclusive W → µν production cross-section using data from pp collisions at a centre-of-mass energy of √s = 7 TeV is presented. The analysis is based on an integrated luminosity of about 1.0 fb−1 recorded with the LHCb detector. Results are reported for muons with a transverse momentum greater than 20 GeV/c and pseudorapidity between 2.0 and 4.5. The W+ and W− production cross-sections are measured to be
σW+→µ+ν = 861.0 ± 2.0 ± 11.2 ± 14.7 pb, σW−→µ−ν = 675.8 ± 1.9 ± 8.8 ± 11.6 pb,
where the first uncertainty is statistical, the second is systematic and the third is due to the luminosity determination. Cross-section ratios and differential distributions as functions of the muon pseudorapidity are also presented. The ratio of W+ to W− cross-sections in the same fiducial kinematic region is determined to be
σW+→µ+ν σW−→µ−ν
= 1.274 ± 0.005 ± 0.009,
where the uncertainties are statistical and systematic, respectively. Results are in good agreement with theoretical predictions at next-to-next-to-leading order in perturbative quantum chromodynamics.
Published in JHEP 12 (2014) 079
c
CERN on behalf of the LHCb collaboration, license CC-BY-4.0.
†Authors are listed at the end of this paper.
1
Introduction
Measurements of the production cross-section of electroweak bosons constitute an important test of the Standard Model at LHC energies. Theoretical predictions, which are available at next-to-next-to-leading order (NNLO) in perturbative quantum chromodynamics (QCD) [1–5], rely on the parameterisations of the momentum fraction, Bjorken-x, of the partons inside the proton. The uncertainties on the parton density functions (PDFs) of the proton are larger at low Bjorken-x values. The forward acceptance of the LHCb experiment, with a pseudorapidity coverage in the range 2 < η < 5, can directly access this region of the phase space to Bjorken-x values as low as 10−6 and provide constraints on the PDFs that complement those of the ATLAS and CMS experiments [6]. In addition to the determination of the W boson cross-section, the ratio of W+ to W− cross-sections
and the W production charge asymmetry allow the Standard Model to be tested with high precision, as experimental and theoretical uncertainties partially cancel.
LHCb has previously reported measurements of inclusive W and Z boson production in pp collisions at a centre-of-mass energy of √s = 7 TeV to final states containing muons using a data sample corresponding to an integrated luminosity of about 40 pb−1 [7]. The impact of the W results on the PDF determination was studied and determined to be the largest compared to other LHC Drell-Yan data due to the forward acceptance of the LHCb detector [8, 9]. A more precise measurement of the W production can therefore further improve the knowledge of the partonic content of the proton. The analysis presented in this paper is based on a data set collected in 2011, which corresponds to an integrated luminosity of approximately 1.0 fb−1. The contribution of virtual photons to Z boson production is always implied. The inclusive W+ and W− cross-sections, σ
W±→µ±ν, are measured for
muons with a transverse momentum, pT, greater than 20 GeV/c and η between 2.0 and
4.5. The differential cross-sections, the W+ to W− cross-section ratio, R
W, and the muon
charge asymmetry, Aµ, are determined in the same fiducial kinematic region in eight bins
of muon pseudorapidity. The ATLAS [10] and CMS [11] collaborations already reported measurements of these quantities, although in different kinematic volumes. Measurements are corrected for final state radiation (FSR) of the muon. No corrections are applied for initial state radiation, electroweak effects, and their interplay with QED effects.
The paper is organised as follows: Sect. 2 describes the LHCb detector as well as the data and the simulation samples used; the selection of the W → µν candidates and the extraction of the signal yield are outlined in Sects. 3 and 4; Sect. 5 describes the cross-section measurement and discusses the associated systematic uncertainties; the results are presented in Sect. 6; and Sect. 7 concludes the paper.
2
Detector and data sets
The LHCb detector [12] is a single-arm forward spectrometer covering the pseudorapidity range 2 < η < 5, designed predominantly for the study of particles containing b or c quarks. The detector includes a high-precision tracking system consisting of a silicon-strip vertex detector surrounding the pp interaction region, a large-area silicon-strip detector located
upstream of a dipole magnet with a bending power of about 4 Tm, and three stations of silicon-strip detectors and straw drift tubes placed downstream of the magnet. The magnet polarity can be reversed, so that left-right detector asymmetry effects can be studied and corrected for in the analyses. The tracking system provides a measurement of momentum, p, with a relative uncertainty that varies from 0.4% at low p values to 0.6% at 100 GeV/c. The minimum distance of a track to a primary vertex, the impact parameter (IP), is measured with a resolution of (15 + 29/pT) µm, where the pT is in GeV/c. Different types
of charged hadrons are distinguished using information from two ring-imaging Cherenkov detectors. Photon, electron and hadron candidates are identified by a calorimeter system consisting of scintillating-pad and preshower detectors, an electromagnetic and a hadronic calorimeter. Muons are identified by a system composed of alternating layers of iron and multiwire proportional chambers. The trigger consists of a hardware stage, based on information from the calorimeter and muon systems, followed by a software stage, which applies full event reconstruction. A set of global event cuts that prevents events with high occupancy dominating the processing time of the software trigger is also applied.
This measurement is based on data corresponding to an integrated luminosity of 975 ± 17 pb−1 taken in pp collisions at a centre-of-mass energy of 7 TeV. The absolute luminosity scale was measured periodically throughout the data taking period using both Van der Meer scans [13], where the beam profile is determined by moving the beams transversely across each other, and a beam-gas imaging method [14], in which beam-gas interaction vertices near the beam crossing point are reconstructed to determine the beam profile. The two methods give consistent results and the integrated luminosity is determined from their average, with an estimated systematic uncertainty of 1.7% [15].
Simulated data are used to optimise the event selection, estimate the background contamination and check the efficiencies. In the simulation, pp collisions are generated using Pythia [16] with a specific LHCb configuration [17]. Decays of hadronic particles are described by EvtGen [18], in which final state radiation (FSR) is generated using Photos [19]. The interaction of the generated particles with the detector and its response are implemented using the Geant4 toolkit [20, 21] as described in Ref. [22]. Additional simulated samples of W → µν and Z → µµ events are generated with the program ResBos [23–25] using the CT10 NNLO [26] PDF set. ResBos includes an approximate NNLO O(α2) calculation, plus a next-to-next-to-leading logarithm approximation for the resummation of the soft radiation at low transverse momentum of the vector boson.
Results are compared to theoretical predictions calculated with the Fewz [27,28] gener-ator at NNLO for the ABM12 [8], CT10 [26], HERA1.5 [29], JR09 [30], MSTW08 [31] and NNPDF2.3 [9] NNLO PDF sets. The scale uncertainties are estimated by inde-pendently varying the renormalisation and factorisation scales by a factor of two around the nominal value, which is set to the boson mass. The total uncertainty for each set corresponds to the PDF (68% CL) and the scale uncertainties added in quadrature.
3
Event selection
The signature of a W → µν decay consists of an isolated high transverse momentum muon produced at the pp interaction point. The events must first pass a trigger decision that requires the presence of at least one muon with pT > 10 GeV/c. Events are subsequently
selected to contain at least one well reconstructed muon with a transverse momentum greater than 20 GeV/c and a pseudorapidity in the range 2.0 < η < 4.5. These conditions define the fiducial kinematic region of the measurement. Additional requirements are imposed to discriminate signal candidates from background events.
While leptons from electroweak boson decays are expected to be isolated, hadronic QCD processes tend to be associated with jets and produce particles with more activity around them. The muon isolation is described by using the scalar sum of the transverse momentum of all charged particles in the event excluding the candidate, pconeT , in a cone of radius R = 0.5, as well as an analogous variable based on calorimeter information not associated to any track, Econe
T . The cone radius is defined as R = p∆η2+ ∆φ2, where
∆η (∆φ) is the difference in pseudorapidity (azimuthal angle) between the muon and the extra particle. The pcone
T and the ETcone variables are required to be smaller than 2 GeV/c
and 2 GeV, respectively.
Drell-Yan events with two muons within the detector acceptance are removed by vetoing on the presence of a second muon with pT > 2 GeV/c.
Owing to the long lifetime of the tau lepton, as well as of beauty and charm hadrons, muons produced in Z → τ τ , W → τ ν or semileptonic decays of heavy flavour hadrons mostly originate far from the interaction point where the two protons have collided. Thus selected candidates are required to have an IP < 40 µm.
Muons typically deposit little energy in the calorimeters in contrast to high-momentum kaons or pions punching through the detector to the muon chambers. Mis-identification due to punchthrough is reduced by requiring Ecalo/pc < 4%, where Ecalo is the sum of
the energy deposition in the electromagnetic and hadronic calorimeters associated to the particle.
In order to optimise the W → µν selection and evaluate the corresponding efficiency from data, a control sample, pseudo-W , is selected by requiring a pair of well reconstructed tracks identified as muons with an invariant mass, mµµ, within 10 GeV/c2 of the nominal Z
boson mass. Each of the leptons is alternately masked to mimic the presence of a neutrino and so fake two W → µν decays. A total of 47 503 Z → µµ candidates are identified. Given the stringent requirement on the reconstructed dimuon mass, the sample purity is expected to be larger than 99.7%, as observed in Ref. [7] within a wider mass window, and so no background subtraction is performed. The pseudo-W sample is generally in good agreement with W → µν simulation. A small difference is observed in momentum-dependent quantities due to a larger average pT in Z → µµ than W → µν decays, which
4
Signal yield
A total of 806 094 W → µν candidate events fulfil the selection requirements. The signal yield is determined by simultaneously fitting the pT spectra of positively and negatively
charged muons in data to the expected shapes for signal and background contributions in eight bins of muon pseudorapidity. A template fit is performed for transverse momenta between 20 and 70 GeV/c using an extended maximum likelihood method based on Ref. [32]. The following contributions are considered, where all simulation-based templates are corrected to account for differences in the reconstruction and the selection efficiencies as observed between data and simulation.
The W → µν shape, which is defined by the pTof the muon, is modelled using simulation
by correcting reconstructed Pythia events with ResBos. The signal normalisation is allowed to vary independently in each bin of muon pseudorapidity and for each charge.
The templates of Z → µµ, W → τ ν and Z → τ τ decays with only one muon in the LHCb acceptance are described using simulation. In addition, Z → µµ events are weighted to reproduce the ResBos muon pT distribution. The normalisation of the electroweak
backgrounds is fixed by scaling the number of Z decays with both muons in the detector acceptance, as reconstructed in the pseudo-W data sample, by the probability of having only one muon in LHCb instead of two, as determined from simulation. The number is corrected for differences in reconstructing and selecting Z and W events and takes into account acceptance variations between W → τ ν, Z → τ τ and Z → µµ decays. The electroweak backgrounds account for (9.82 ± 0.16)% of the total number of candidates, where the uncertainty is statistical and dominated by the size of the pseudo-W sample.
The pT spectrum of semileptonic decays of heavy flavour hadrons is obtained from data
by requiring an impact parameter exceeding 100 µm, which selects tracks incompatible with production at a primary vertex. Several IP thresholds are tested with marginal changes to the pT distribution, as cross-checked on data and simulation. The normalisation
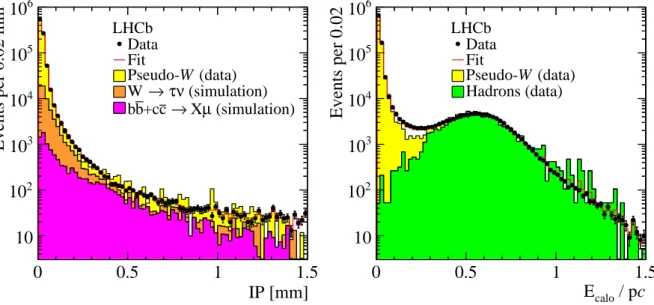
is determined via a template fit to the IP distribution in data with three classes of events: muons originating from the pp interaction point, described with pseudo-W data, muons coming from W → τ ν or Z → τ τ decays, parameterised with simulation, and muons from heavy flavour hadrons, modelled with a mixture of inclusive bb and cc simulated samples. The result of the fit is shown in Fig. 1 (left) from where the heavy flavour normalisation is determined to be (0.48 ± 0.03)%, and constrained in the pT fit.
The residual background due to K and π punchthrough is determined from data using a template fit. Figure 1 (right) shows the fit to the relative energy deposition in the calorimeters, where W → µν candidates are compared to muons and hadrons selected from pseudo-W and randomly triggered data, respectively. By requiring Ecalo/pc < 4%,
kaons or pions punching through the detector to the muon chambers are reduced to a negligible level and therefore not considered when measuring the W → µν yield.
Kaons and pions decaying in flight to muons are described using data. Tracks that are not involved in any trigger decision are selected and the corresponding pT is weighted by
their probability to decay to muons, as measured on data. The probability is determined as the fraction of reconstructed particles identified as muons, and is found to be consistent with
IP [mm] 0 0.5 1 1.5 Events per 0.02 mm 10 2 10 3 10 4 10 5 10 6 10 LHCb Data Fit (data) W (simulation) ν τ → W (simulation) µ X → c +c b b c / p calo E 0 0.5 1 1.5 Events per 0.02 10 2 10 3 10 4 10 5 10 6 10 LHCb Data Fit (data) W Pseudo-Hadrons (data)
Figure 1: Fit to (left) the impact parameter distribution and (right) the relative energy deposition in the calorimeters. The data are compared to fitted contributions described in the legends.
an estimate based on the mean lifetimes and decay distance of simulated K and π mesons. The normalisation of the decay-in-flight background is allowed to vary independently in each η bin and for each charge.
The signal purity, defined as the ratio of signal to candidate event yield, is determined with a fit that relies on the correct description of the pT distribution in data and thus a
good calibration of the momentum scale is needed. The momentum measurement, which is based on the curvature of charged particle trajectories, critically depends on the correct alignment of the LHCb detector and on an accurate knowledge of the magnetic field across the tracking volume. To calibrate the momentum scale for high-pT particles, di muon
pairs are identified with the same criteria used to select the pseudo-W sample, but with mµµ in the range from 60 to 120 GeV/c2. The calibration is performed in bins of η and φ
for positively and negatively charged muons separately, by exploiting the deviations of the average reconstructed invariant mass from the known Z boson mass. The procedure removes the dependence of mµµ on the direction of flight of the muon, as well as of the pT
on the charge of the particle.
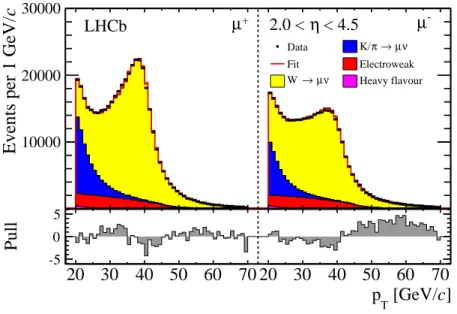
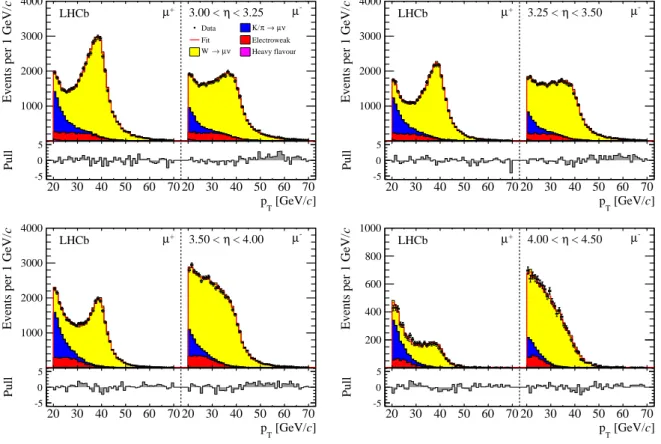
The result of the fit in the range 2.0 < η < 4.5 is presented in Fig. 2, while Figs. 8 and 9 in Appendix A show the fit in the eight pseudorapidity bins. The χ2/ndf of the fit is
1.65, with 768 degrees of freedom. The distribution of the normalised fit residuals show an imperfect description of the data by the adopted templates, particularly for negative muons at high pT values, however, the effect on the signal yield is small. The W+ → µ+ν
and W− → µ−ν sample purities are determined to be (77.13 ± 0.19)% and (77.39 ± 0.23)%,
] c [GeV/ T p c
Events per 1 GeV/ 10000
20000 30000 LHCb µ+ 2.0 < η < 4.5 µ -Data K/π→µν Fit Electroweak ν µ → W Heavy flavour ] c [GeV/ T p Pull -5 0 5 20 30 40 50 60 70 20 30 40 50 60 70
Figure 2: Transverse momentum distribution of the (left panel) positive and (right panel) negative muon candidates in the fiducial pseudorapidity range. The data are compared to fitted contributions described in the legend. The fit residuals normalised to the data uncertainty are shown at the bottom of each distribution.
5
Cross-section measurement
The inclusive W boson production cross-section is measured in eight bins of muon η between 2.0 and 4.5, and with the requirement that the muon has a pT above 20 GeV/c.
The cross-section in each pseudorapidity bin is defined as
σW±→µ±ν(ηi) = 1 L · NW · ρ±(ηi) A±(η i) · εrec(ηi) · εsel(ηi) · 1 1 − fFSR± (ηi) ,
where L is the integrated luminosity corresponding to the data set used in the analysis and NW is the total number of selected W → µν candidates. The signal purity, ρ±, the
acceptance, A±, the reconstruction and the selection efficiencies, εrec and εsel, and the
correction for FSR, fFSR± , are determined for each η bin. The cross-section in the range
2.0 < η < 4.5 is obtained by summing over all bins.
5.1
Acceptance
The acceptance factor, A±, is used to correct for the reduced pT range of the fit. The
correction is taken from the W → µν ResBos simulation and is defined as the fraction of generated events fulfilling the kinematic requirements of the measurement that have a muon transverse momentum smaller than 70 GeV/c. The average acceptance is 99.3% and
99.1% for W+ and W−, respectively. In addition, no significant migration between η bins is observed and no correction is applied.
5.2
Reconstruction efficiencies
The efficiency to reconstruct the muon produced in a W → µν decay, εrec, is determined
using data-driven techniques following Refs. [7] and [33]. The reconstruction efficiency is factorised as the product of the tracking, the particle identification, the trigger and the global event cut efficiencies. The Z → µµ decay mode provides a highly pure sample of events that is used to determine efficiencies for high-pT muons via a tag-and-probe
method. The tag is a reconstructed track identified as a muon that triggered the event, while a second reconstructible object is used as the probe. The tag and the probe are required to have pT greater than 20 GeV/c, a pseudorapidity in the range 2.0 < η < 4.5, to
be associated to the same primary vertex and have a combined invariant mass between 60 and 120 GeV/c2. The efficiency is determined as the fraction of tag-and-probe candidates that fulfil a specific requirement on the probe.
The tracking efficiency is determined using a probe track reconstructed by combining hits in the muon stations and the large-area silicon-strip detector, which are not used in the track finding. In order to reduce the background contribution, the accepted mµµ
range is restricted to 70 − 110 GeV/c2, and the tag and the probe are required to have an
azimuthal separation greater than 0.1 rad. The efficiency depends on the probe η value and varies between 87.2% and 97.3%. Simulation is used to correct for possible biases in the method, which range between 0.4% and 2.0%, and the corresponding systematic uncertainty is combined in quadrature with the statistical precision of the determination. The total uncertainty on the tracking efficiency varies between 0.4% and 1.0%.
The efficiency for identifying a muon is measured using a reconstructed track as the probe lepton. The tag and the probe are required to be isolated (pconeT < 2 GeV/c) and to have an azimuthal separation greater than 2.7 rad to ensure a sample of very high purity. The use of the isolation requirement is investigated in simulation and proved not to bias the efficiency determination. The muon identification efficiency is found to vary between 95.6% and 98.8% as a function of the probe pseudorapidity. The corresponding uncertainty is about 0.2% and accounts for the small amount of residual background.
The trigger efficiency is evaluated by using an identified muon as the probe object. To reduce the background to a negligible level, an isolation requirement (pcone
T < 2 GeV/c) is
applied to the tag and the probe. The measurement is not biased by the requirement on the pconeT , as verified using simulation. The efficiency depends on the η value of the probe and ranges between 77.6% and 81.5%. The trigger efficiency uncertainty corresponds to the statistical uncertainty only and varies between 0.4% and 0.6%. To account for losses due to a high event occupancy in the hardware trigger, the global event cut efficiency is determined from data using a dimuon trigger with a relaxed threshold. The efficiency depends on the event multiplicity. After correcting for occupancy differences between Z and W events, this is determined to be (95.9 ± 1.1)%.
Table 1: Summary of the systematic uncertainties on the inclusive cross-sections and their ratio. Source ∆σW+→µ+ν [%] ∆σW−→µ−ν [%] ∆RW [%] Template shape 0.28 0.39 0.59 Template normalisation 0.10 0.10 0.06 Reconstruction efficiency 1.21 1.20 0.12 Selection efficiency 0.33 0.32 0.18 Acceptance and FSR 0.18 0.12 0.21 Luminosity 1.71 1.71 —
muon charge as well as other quantities. No biases are observed.
5.3
Selection efficiency
The efficiency to select W → µν events, εsel, defined as the fraction of events that fulfil
the requirements used to identify the candidates, is measured using the pseudo-W sample. Good agreement is observed between pseudo-W data and W → µν simulation; however, the larger average pTof pseudo-W events must be accounted for. Simulation is used to asses
the difference due to measuring the selection efficiency with muons produced in Z instead of W boson decays, which on average amounts to about 2%. The statistical uncertainty of the data-driven determination and of the simulation-based correction are summed in quadrature. The efficiency is found to vary as a function of the muon pseudorapidity. No dependence on the lepton charge is observed except for the most forward η bin. The measured εsel ranges between 61.9% and 70.0% in the central bins with an uncertainty of
about 0.5%, but decreases to 49.0% in the first pseudorapidity bin. The efficiency to select W+ and W− in the range 4.0 < η < 4.5 is (34.1 ± 0.8)% and (29.3 ± 0.7)%, respectively.
5.4
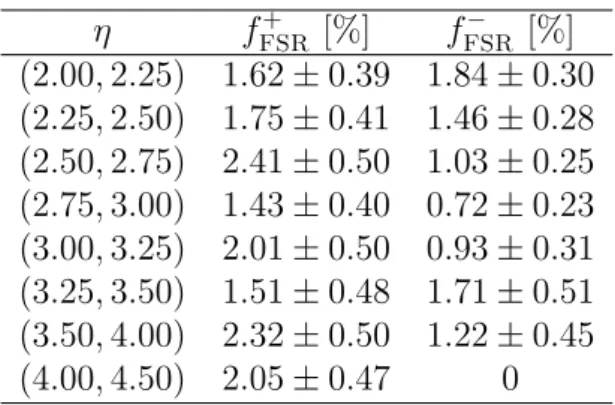
Final state radiation
The FSR correction, fFSR± , is evaluated using Photos interfaced to Pythia as the
ratio of the number of generated events that after photon radiation fail the kinematic requirements to the number of generated decays that before FSR satisfy the same criteria. The correction in bins of muon pseudorapidity is reported in Appendix B (Table 2).
5.5
Systematic uncertainties
The contributions to the systematic uncertainty considered in the analysis are the shape and the normalisation of the templates used in the fit, the reconstruction and the selection efficiencies, the acceptance and the FSR corrections, and the luminosity determination. A summary of the systematic uncertainties on the W+ and W− cross-sections and their
An estimate of the uncertainty arising from the choice of the template shapes is evaluated by refitting the data with different pT distributions for the signal and the main
background components, and combining the observed variations in the results in quadrature. The weights that correct the W → µν and Z → µµ templates to reproduce the ResBos muon pT distributions are smeared by their statistical uncertainty. The observed change
on the W+(W−) cross-section is 0.01% (0.05)%. The shape of the decay-in-flight template
is modified by constraining the relative normalisation between positively or negatively charged particles in each η bin according to fractions observed in randomly triggered events. The W+ and W−cross-sections vary by 0.23% and 0.35% respectively. In addition,
the correction applied to simulation-based templates that accounts for efficiency differences with respect to data is modified by its statistical uncertainty, inducing a variation of 0.16% (0.15)% in σW+→µ+ν (σW−→µ−ν). The larger template shape uncertainty assigned to the
W− cross-section accounts for the better description by the fit model of the pT spectrum
of positive muons, as shown in Fig. 2.
Similarly, the normalisations of the constrained templates are varied independently and the largest deviations corresponding to each source are summed in quadrature. The electroweak template normalisation is shifted by ±1 σ, which corresponds to a change of the W+ and W− production cross-sections of 0.10%. The residual amount of heavy flavour
events is varied by its statistical uncertainty. No change is observed on σW+→µ+ν and
σW−→µ−ν. Because the heavy flavour template shape is very similar to the decay-in-flight
component, variations to the former are compensated by a change in the normalisation of the latter, with small effects on the results.
The reconstruction and the selection efficiencies are measured from data and the uncertainty of each determination is taken as an estimate of the corresponding systematic uncertainty. The resulting uncertainty on the W cross-sections is 1.2% for εrec, and 0.3%
for εsel.
The acceptance and FSR corrections are evaluated using simulation. The statistical uncertainty of A± and the total uncertainty of fFSR± , which includes extra sources of theo-retical uncertainties, are summed in quadrature and result in a 0.18% (0.12)% systematic uncertainty on the W+ (W−) boson cross-section.
The luminosity determination has a precision of 1.71% [15] and is quoted separately from the other sources of systematic uncertainty.
To check for possible detector-induced asymmetries, data samples collected with opposite magnet polarity are analysed separately. No significant discrepancy is observed on the W+ to W− cross-section ratio, which does not depend on the luminosity determination
6
Results
The W+ → µ+ν and W− → µ−ν production cross-sections for muons with a p
T exceeding
20 GeV/c and 2.0 < η < 4.5 are measured to be
σW+→µ+ν = 861.0 ± 2.0 ± 11.2 ± 14.7 pb,
σW−→µ−ν = 675.8 ± 1.9 ± 8.8 ± 11.6 pb,
where the first uncertainty is statistical, the second is systematic and the third is due to the luminosity determination. Aside from the luminosity contribution, measurements are dominated by the limited knowledge of the reconstruction efficiency. The correlation coefficient between the W+ and W− cross-sections for the statistical and systematic uncertainties combined corresponds to 0.83, which increases to 0.94 when including the luminosity uncertainty. The full correlation matrix in bins of muon pseudorapidity is reported in Appendix B (Table 6).
The ratio of the W+ and the W− cross-sections is determined to be
RW =
σW+→µ+ν
σW−→µ−ν
= 1.274 ± 0.005 ± 0.009,
where the uncertainties are statistical and systematic. The luminosity uncertainty cancels, while the systematic uncertainties associated with the efficiencies are reduced due to correlations.
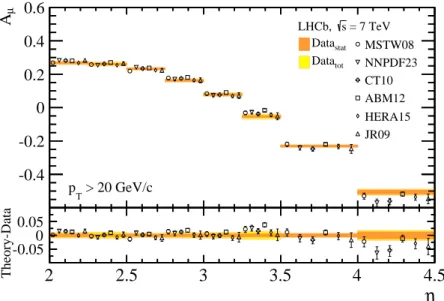
The muon charge asymmetry is measured in each pseudorapidity bin according to
Aµ(ηi) =
σW+→µ+ν(ηi) − σW−→µ−ν(ηi)
σW+→µ+ν(ηi) + σW−→µ−ν(ηi)
.
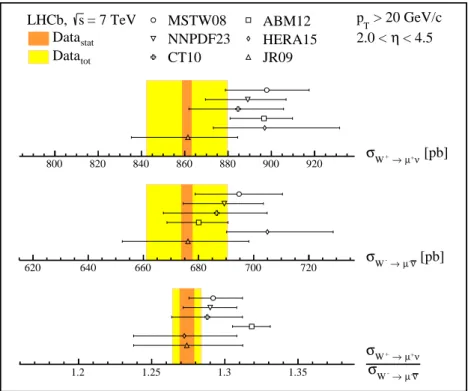
A summary of the measurements for muons with pT > 20 GeV/c and 2.0 < η < 4.5
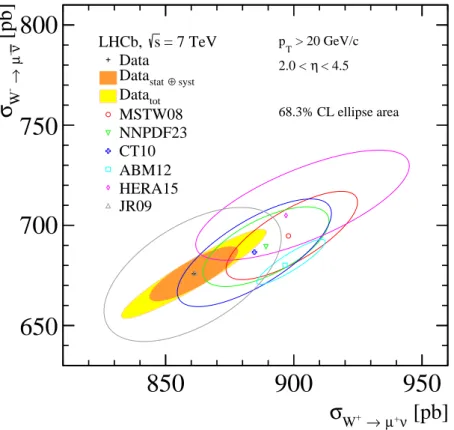
is presented in Fig. 3. The cross-sections for inclusive W+ and W− production in a two-dimensional plot are shown in Fig. 4, where the ellipses correspond to 68.3% CL coverage. The differential W+ and W− cross-sections and the W+ to W− cross-section
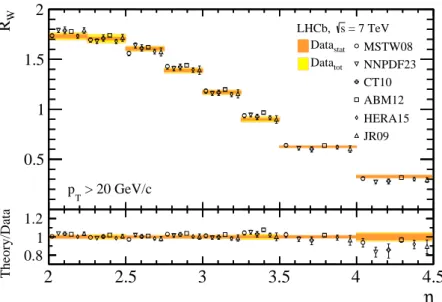
ratio as a function of the muon pseudorapidity are shown in Figs. 5 and 6, while the lepton charge asymmetry is presented in Fig. 7. Measurements are compared to predictions at NNLO in QCD with different parameterisations of the PDFs. Results are generally in good agreement with theoretical calculations. Cross-section and ratio determinations in bins of muon η are tabulated in Appendix B (Tables 3, 4 and 5).
7
Conclusions
Measurements of inclusive W → µν production in pp collisions at a centre-of-mass energy of √s = 7 TeV using a data set corresponding to an integrated luminosity of 975 ± 17 pb−1 recorded by the LHCb experiment are presented. The cross-section for W+ and W− boson production, as well as their ratio, RW, and charge asymmetry, Aµ, are measured
= 7 TeV s LHCb, stat Data tot Data MSTW08 NNPDF23 CT10 ABM12 HERA15 JR09 > 20 GeV/c T p < 4.5 η 2.0 < 800 820 840 860 880 900 920 σW+→µ+ν [pb] 620 640 660 680 700 720 →µ-ν [pb] -W σ 1.2 1.25 1.3 1.35 σW-→µ-ν ν + µ → + W σ
Figure 3: Summary of the W cross-section determinations. Measurements, represented as bands corresponding to the statistical (orange) and total (yellow) uncertainty, are compared to NNLO predictions for various parameterisations of the PDFs (black markers).
Model predictions calculated at NNLO in perturbative QCD, which agree well with the data. The cross-section measurements presented in this paper provide constraints on the determinations of the proton PDFs, with a total uncertainty that is comparable with, or in some cases better, than the uncertainty on the theory calculations. The precision on the W+ to W− cross-section ratio, which is improved by a factor of about two with respect to the previous result [7], allows the Standard Model to be tested with a sub-percent accuracy.
Acknowledgements
We express our gratitude to our colleagues in the CERN accelerator departments for the excellent performance of the LHC. We thank the technical and administrative staff at the LHCb institutes. We acknowledge support from CERN and from the national agencies: CAPES, CNPq, FAPERJ and FINEP (Brazil); NSFC (China); CNRS/IN2P3 (France); BMBF, DFG, HGF and MPG (Germany); SFI (Ireland); INFN (Italy); FOM and NWO (The Netherlands); MNiSW and NCN (Poland); MEN/IFA (Romania); MinES and FANO (Russia); MinECo (Spain); SNSF and SER (Switzerland); NASU (Ukraine); STFC (United Kingdom); NSF (USA). The Tier1 computing centres are supported by IN2P3 (France),
[pb]
ν + µ → + Wσ
850
900
950
[pb]
ν -µ → -Wσ
650
700
750
800
= 7 TeV s LHCb, Data syst ⊕ stat Data tot Data MSTW08 NNPDF23 CT10 ABM12 HERA15 JR09 > 20 GeV/c T p < 4.5 η 2.0 < 68.3% CL ellipse areaFigure 4: Two-dimensional plot of the measured (total (yellow) and excluding the luminosity (orange) uncertainty) W+ and W− cross-sections compared to NNLO predictions for various parameterisations of the PDFs (coloured markers). The uncertainty of the theoretical predictions corresponds to the PDF uncertainty only; the correlation is determined using the different error eigenvector sets. The ellipses correspond to a 68.3% CL coverage.
KIT and BMBF (Germany), INFN (Italy), NWO and SURF (The Netherlands), PIC (Spain), GridPP (United Kingdom). We are indebted to the communities behind the multiple open source software packages on which we depend. We are also thankful for the computing resources and the access to software R&D tools provided by Yandex LLC (Russia). Individual groups or members have received support from EPLANET, Marie Sk lodowska-Curie Actions and ERC (European Union), Conseil g´en´eral de Haute-Savoie, Labex ENIGMASS and OCEVU, R´egion Auvergne (France), RFBR (Russia), XuntaGal and GENCAT (Spain), Royal Society and Royal Commission for the Exhibition of 1851 (United Kingdom).
η [pb] η /d νµ → W σ d 200 400 600 800 LHCb Preliminary, s = 7 TeV ) + (W stat Data MSTW08 ) + (W tot Data NNPDF23 ) (W stat Data CT10 ) (W tot Data ABM12 HERA15 JR09 > 20 GeV/c T p η 2 2.5 3 3.5 4 4.5 Theory/Data η 0.91 1.1 η 0.91 1.1
Figure 5: Differential W+ and W− cross-section in bins of muon pseudorapidity. Measurements, represented as bands corresponding to the statistical (orange (blue) for W+ (W−)) and total (yellow (light blue) for W+ (W−)) uncertainty, are compared to NNLO predictions with different parameterisations of the PDFs (black (blue) markers for W+ (W−), displaced horizontally for presentation). η W R 0.5 1 1.5 2 = 7 TeV s LHCb, stat Data MSTW08 tot Data NNPDF23 CT10 ABM12 HERA15 JR09 > 20 GeV/c T p η 2 2.5 3 3.5 4 4.5 Theory/Data 0.8 1 1.2
Figure 6: Ratio of W+ to W− cross-sections in bins of muon pseudorapidity. Measurements, represented as bands corresponding to the statistical (orange) and total (yellow) uncertainty, are compared to NNLO predictions for various parameterisations of the PDFs (black markers, displaced horizontally for presentation).
η µ A -0.4 -0.2 0 0.2 0.4 0.6 = 7 TeV s LHCb, stat Data MSTW08 tot Data NNPDF23 CT10 ABM12 HERA15 JR09 > 20 GeV/c T p η 2 2.5 3 3.5 4 4.5 Theory-Data -0.050 0.05
Figure 7: Lepton charge asymmetry in bins of muon pseudorapidity. Measurements, represented as bands corresponding to the statistical (orange) and total (yellow) uncertainty, are compared to NNLO predictions for various parameterisations of the PDFs (black markers, displaced horizontally for presentation).
Appendices
A
Fit
] c [GeV/ T p cEvents per 1 GeV/
1000 2000 3000 4000 5000 LHCb µ+ 2.00 < η < 2.25 µ -Data K/π→µν Fit Electroweak ν µ → W Heavy flavour ] c [GeV/ T p Pull -5 0 5 20 30 40 50 60 70 20 30 40 50 60 70 ] c [GeV/ T p c
Events per 1 GeV/
1000 2000 3000 4000 5000 LHCb µ+ 2.25 < η < 2.50 µ -] c [GeV/ T p Pull -5 0 5 20 30 40 50 60 70 20 30 40 50 60 70 ] c [GeV/ T p c
Events per 1 GeV/
1000 2000 3000 4000 5000 LHCb µ+ 2.50 < η < 2.75 µ -] c [GeV/ T p Pull -5 0 5 20 30 40 50 60 70 20 30 40 50 60 70 ] c [GeV/ T p c
Events per 1 GeV/
1000 2000 3000 4000 5000 LHCb µ+ 2.75 < η < 3.00 µ -] c [GeV/ T p Pull -5 0 5 20 30 40 50 60 70 20 30 40 50 60 70
Figure 8: Transverse momentum distribution of the (left panel) positive and (right panel) negative muon candidates in eight bins of pseudorapidity. The data are compared to fitted contributions described in the legend. The fit residuals normalised to the data uncertainty are shown at the bottom of each distribution.
] c [GeV/ T p c
Events per 1 GeV/
1000 2000 3000 4000 LHCb µ+ 3.00 < η < 3.25 µ -Data K/π→µν Fit Electroweak ν µ → W Heavy flavour ] c [GeV/ T p Pull -5 0 5 20 30 40 50 60 70 20 30 40 50 60 70 ] c [GeV/ T p c
Events per 1 GeV/
1000 2000 3000 4000 LHCb µ+ 3.25 < η < 3.50 µ -] c [GeV/ T p Pull -5 0 5 20 30 40 50 60 70 20 30 40 50 60 70 ] c [GeV/ T p c
Events per 1 GeV/
1000 2000 3000 4000 LHCb µ+ 3.50 < η < 4.00 µ -] c [GeV/ T p Pull -5 0 5 20 30 40 50 60 70 20 30 40 50 60 70 ] c [GeV/ T p c
Events per 1 GeV/
200 400 600 800 1000 LHCb µ+ 4.00 < η < 4.50 µ -] c [GeV/ T p Pull -5 0 5 20 30 40 50 60 70 20 30 40 50 60 70
Figure 9: Transverse momentum distribution of the (left panel) positive and (right panel) negative muon candidates in eight bins of pseudorapidity. The data are compared to fitted contributions described in the legend. The fit residuals normalised to the data uncertainty are shown at the bottom of each distribution.
B
Tables
Table 2: Correction for final state radiation for W+ → µ+ν and W− → µ−ν in bins of muon pseudorapidity. No loss due FSR is observed for W− in the last pseudorapidity bin because of lack of statistics. η fFSR+ [%] fFSR− [%] (2.00, 2.25) 1.62 ± 0.39 1.84 ± 0.30 (2.25, 2.50) 1.75 ± 0.41 1.46 ± 0.28 (2.50, 2.75) 2.41 ± 0.50 1.03 ± 0.25 (2.75, 3.00) 1.43 ± 0.40 0.72 ± 0.23 (3.00, 3.25) 2.01 ± 0.50 0.93 ± 0.31 (3.25, 3.50) 1.51 ± 0.48 1.71 ± 0.51 (3.50, 4.00) 2.32 ± 0.50 1.22 ± 0.45 (4.00, 4.50) 2.05 ± 0.47 0
Table 3: Inclusive cross-section for W+and W−boson production in bins of muon pseudorapidity. The uncertainties are statistical, systematic and luminosity.
η σW+→µ+ν [ pb ] σW−→µ−ν [ pb ] (2.00, 2.25) 188.4 ± 1.2 ± 4.0 ± 3.2 108.9 ± 0.9 ± 2.4 ± 1.9 (2.25, 2.50) 175.3 ± 0.9 ± 3.6 ± 3.0 102.8 ± 0.7 ± 2.2 ± 1.8 (2.50, 2.75) 151.3 ± 0.8 ± 2.6 ± 2.6 94.2 ± 0.7 ± 1.6 ± 1.6 (2.75, 3.00) 120.3 ± 0.7 ± 2.0 ± 2.1 86.7 ± 0.6 ± 1.8 ± 1.5 (3.00, 3.25) 92.4 ± 0.6 ± 1.6 ± 1.6 79.0 ± 0.6 ± 1.6 ± 1.4 (3.25, 3.50) 60.4 ± 0.5 ± 1.1 ± 1.0 67.2 ± 0.5 ± 1.6 ± 1.1 (3.50, 4.00) 58.8 ± 0.5 ± 1.0 ± 1.0 94.0 ± 0.7 ± 1.6 ± 1.6 (4.00, 4.50) 14.1 ± 0.4 ± 0.4 ± 0.2 42.9 ± 0.7 ± 1.3 ± 0.7
Table 4: Ratio of W+ to W− cross-section in bins of muon pseudorapidity. The uncertainties are statistical and systematic.
η RW (2.00, 2.25) 1.730 ± 0.018 ± 0.030 (2.25, 2.50) 1.706 ± 0.015 ± 0.040 (2.50, 2.75) 1.606 ± 0.014 ± 0.021 (2.75, 3.00) 1.388 ± 0.013 ± 0.024 (3.00, 3.25) 1.169 ± 0.012 ± 0.021 (3.25, 3.50) 0.898 ± 0.010 ± 0.025 (3.50, 4.00) 0.626 ± 0.007 ± 0.006 (4.00, 4.50) 0.328 ± 0.011 ± 0.011
Table 5: Lepton charge asymmetry in bins of muon pseudorapidity. The uncertainties are statistical and systematic.
η Aµ [%] (2.00, 2.25) 26.74 ± 0.48 ± 0.82 (2.25, 2.50) 26.08 ± 0.41 ± 1.09 (2.50, 2.75) 23.25 ± 0.42 ± 0.60 (2.75, 3.00) 16.26 ± 0.46 ± 0.84 (3.00, 3.25) 7.81 ± 0.50 ± 0.90 (3.25, 3.50) −5.37 ± 0.57 ± 1.35 (3.50, 4.00) −23.04 ± 0.52 ± 0.49 (4.00, 4.50) −50.65 ± 1.22 ± 1.30
Table 6: Correlation coefficients (statistical and systematic uncertainties) between W+ and W− cross-sections in bins of muon pseudorapidity. The luminosity uncertainty is not included.
(2.00, 2.25) (2.25, 2.50) (2.50, 2.75) (2.75, 3.00) (3.00, 3.25) (3.25, 3.50) (3.50, 4.00) (4.00, 4.50) + 1 (2 .00 , 2 .25) − 0.60 1 + 0.13 0.48 1 (2 .25 , 2 .50) − 0.45 0.03 0.34 1 + 0.26 0.42 0.48 0.20 1 (2 .50 , 2 .75) − 0.44 0.15 0.16 0.52 0.64 1 + 0.42 0.22 0.24 0.46 0.36 0.49 1 (2 .75 , 3 .00) − 0.10 0.50 0.59 −0.04 0.48 0.12 0.51 1 + 0.23 0.41 0.47 0.17 0.46 0.28 0.33 0.49 1 (3 .00 , 3 .25) − 0.45 0.03 0.02 0.58 0.21 0.53 0.47 −0.03 0.49 1 + 0.17 0.45 0.53 0.06 0.46 0.20 0.28 0.56 0.46 0.07 1 (3 .25 , 3 .50) − 0.46 −0.06 −0.09 0.61 0.12 0.53 0.46 −0.15 0.09 0.62 0.19 1 + 0.29 0.37 0.42 0.25 0.45 0.34 0.38 0.41 0.42 0.26 0.41 0.19 1 (3 .50 , 4 .00) − 0.43 0.20 0.21 0.49 0.35 0.50 0.48 0.18 0.31 0.50 0.24 0.49 0.66 1 + 0.11 0.22 0.27 0.06 0.26 0.11 0.15 0.26 0.23 0.07 0.23 0.01 0.22 0.17 1 (4 .00 , 4 .50) − 0.20 0.14 0.15 0.22 0.21 0.24 0.24 0.13 0.19 0.23 0.15 0.21 0.21 0.25 0.21 1 + − + − + − + − + − + − + − + −
References
[1] P. Rijken and W. van Neerven, Order α2
s contributions to the Drell-Yan cross-section
at fixed target energies, Phys. Rev. D51 (1995) 44, arXiv:hep-ph/9408366.
[2] R. Hamberg, W. van Neerven, and T. Matsuura, A complete calculation of the order α2
s correction to the Drell-Yan K-factor, Nucl. Phys. B359 (1991) 343.
[3] W. van Neerven and E. Zijlstra, The O(α2s) corrected Drell-Yan K-factor in the DIS and MS scheme, Nucl. Phys. B382 (1992) 11.
[4] R. V. Harlander and W. B. Kilgore, Next-to-next-to-leading order Higgs production at hadron colliders, Phys. Rev. Lett. 88 (2002) 201801, arXiv:hep-ph/0201206. [5] C. Anastasiou, L. J. Dixon, K. Melnikov, and F. Petriello, High-precision QCD at
hadron colliders: Electroweak gauge boson rapidity distributions at next-to-next-to leading order, Phys. Rev. D69 (2004) 094008, arXiv:hep-ph/0312266.
[6] R. Thorne, A. Martin, W. Stirling, and G. Watt, Parton distributions and QCD at LHCb, arXiv:0808.1847.
[7] LHCb collaboration, R. Aaij et al., Inclusive W and Z production in the forward region at √s = 7 TeV, JHEP 06 (2012) 058, arXiv:1204.1620.
[8] S. Alekhin, J. Bluemlein, and S. Moch, The ABM parton distributions tuned to LHC data, Phys. Rev. D89 (2014) 054028, arXiv:1310.3059.
[9] R. D. Ball et al., Parton distributions with LHC data, Nucl. Phys. B867 (2013) 244, arXiv:1207.1303.
[10] ATLAS collaboration, G. Aad et al., Measurement of the inclusive W± and Z/γ∗ cross sections in the electron and muon decay channels in pp collisions at √s = 7 TeV with the ATLAS detector, Phys. Rev. D85 (2012) 072004, arXiv:1109.5141. [11] CMS collaboration, S. Chatrchyan et al., Measurement of the muon charge asymmetry
in inclusive pp → W + X production at √s=7 TeV and an improved determination of light parton distribution functions, arXiv:1312.6283.
[12] LHCb collaboration, A. A. Alves Jr. et al., The LHCb detector at the LHC, JINST 3 (2008) S08005.
[13] S. van der Meer, Calibration of the effective beam height in the ISR, CERN-ISR-PO 68-31 (1968).
[14] M. Ferro-Luzzi, Proposal for an absolute luminosity determination in colliding beam experiments using vertex detection of beam-gas interactions, Nucl. Instrum. Meth. A553 (2005) 388.
[15] LHCb collaboration, R. Aaij et al., Precision luminosity measurements at LHCb, JINST 9 (2014) P12005, arXiv:1410.0149.
[16] T. Sj¨ostrand, S. Mrenna, and P. Skands, PYTHIA 6.4 physics and manual, JHEP 05 (2006) 026, arXiv:hep-ph/0603175.
[17] I. Belyaev et al., Handling of the generation of primary events in GAUSS, the LHCb simulation framework, Nuclear Science Symposium Conference Record (NSS/MIC) IEEE (2010) 1155.
[18] D. J. Lange, The EvtGen particle decay simulation package, Nucl. Instrum. Meth. A462 (2001) 152.
[19] P. Golonka and Z. Was, PHOTOS Monte Carlo: a precision tool for QED corrections in Z and W decays, Eur. Phys. J. C45 (2006) 97, arXiv:hep-ph/0506026.
[20] Geant4 collaboration, J. Allison et al., Geant4 developments and applications, IEEE Trans. Nucl. Sci. 53 (2006) 270.
[21] Geant4 collaboration, S. Agostinelli et al., Geant4: a simulation toolkit, Nucl. Instrum. Meth. A506 (2003) 250.
[22] M. Clemencic et al., The LHCb simulation application, GAUSS: design, evolution and experience, J. Phys. Conf. Ser. 331 (2011) 032023.
[23] G. A. Ladinsky and C.-P. Yuan, The nonperturbative regime in QCD resumma-tion for gauge boson producresumma-tion at hadron colliders, Phys. Rev. D50 (1994) 4239, arXiv:hep-ph/9311341.
[24] C. Balazs and C.-P. Yuan, Soft gluon effects on lepton pairs at hadron colliders, Phys. Rev. D56 (1997) 5558, arXiv:hep-ph/9704258.
[25] F. Landry, R. Brock, P. M. Nadolsky, and C.-P. Yuan, Fermilab Tevatron run-1 Z boson data and Collins-Soper-Sterman resummation formalism, Phys. Rev. D67 (2003) 073016, arXiv:hep-ph/0212159.
[26] J. Gao et al., CT10 next-to-next-to-leadingorder global analysis of QCD, Phys. Rev. D89 (2014) 033009, arXiv:1302.6246.
[27] R. Gavin, Y. Li, F. Petriello, and S. Quackenbush, FEWZ 2.0: a code for hadronic Z production at next-to-next-to-leading order, Comput. Phys. Commun. 182 (2011) 2388, arXiv:1011.3540.
[28] Y. Li and F. Petriello, Combining QCD and electroweak corrections to dilepton production in the framework of the FEWZ simulation code, Phys. Rev. D86 (2012) 094034, arXiv:1208.5967.
[29] ZEUS collaboration, H1 collaboration, A. Cooper-Sarkar, PDF fits at HERA, PoS EPS-HEP2011 (2011) 320, arXiv:1112.2107.
[30] P. Jimenez-Delgado and E. Reya, Dynamical next-to-next-to-leading order parton distributions, Phys. Rev. D79 (2009) 074023, arXiv:0810.4274.
[31] A. D. Martin, W. J. Stirling, R. S. Thorne, and G. Watt, Parton distributions for the LHC, Eur. Phys. J. C63 (2009) 189, arXiv:0901.0002.
[32] R. J. Barlow and C. Beeston, Fitting using finite Monte Carlo samples, Comput. Phys. Commun. 77 (1993) 219.
[33] LHCb collaboration, R. Aaij et al., Measurement of the cross-section for Z → e+e− production in pp collisions at √s = 7 TeV, JHEP 02 (2013) 106, arXiv:1212.4620.
LHCb collaboration
R. Aaij41, B. Adeva37, M. Adinolfi46, A. Affolder52, Z. Ajaltouni5, S. Akar6, J. Albrecht9, F. Alessio38, M. Alexander51, S. Ali41, G. Alkhazov30, P. Alvarez Cartelle37, A.A. Alves Jr25,38, S. Amato2, S. Amerio22, Y. Amhis7, L. An3, L. Anderlini17,g, J. Anderson40, R. Andreassen57, M. Andreotti16,f, J.E. Andrews58, R.B. Appleby54, O. Aquines Gutierrez10, F. Archilli38, A. Artamonov35, M. Artuso59, E. Aslanides6, G. Auriemma25,n, M. Baalouch5, S. Bachmann11, J.J. Back48, A. Badalov36, W. Baldini16, R.J. Barlow54, C. Barschel38, S. Barsuk7, W. Barter47, V. Batozskaya28, V. Battista39, A. Bay39, L. Beaucourt4, J. Beddow51, F. Bedeschi23,
I. Bediaga1, S. Belogurov31, K. Belous35, I. Belyaev31, E. Ben-Haim8, G. Bencivenni18, S. Benson38, J. Benton46, A. Berezhnoy32, R. Bernet40, M.-O. Bettler47, M. van Beuzekom41, A. Bien11, S. Bifani45, T. Bird54, A. Bizzeti17,i, P.M. Bjørnstad54, T. Blake48, F. Blanc39, J. Blouw10, S. Blusk59, V. Bocci25, A. Bondar34, N. Bondar30,38, W. Bonivento15,38, S. Borghi54, A. Borgia59, M. Borsato7, T.J.V. Bowcock52, E. Bowen40, C. Bozzi16, T. Brambach9,
J. van den Brand42, J. Bressieux39, D. Brett54, M. Britsch10, T. Britton59, J. Brodzicka54, N.H. Brook46, H. Brown52, A. Bursche40, G. Busetto22,r, J. Buytaert38, S. Cadeddu15, R. Calabrese16,f, M. Calvi20,k, M. Calvo Gomez36,p, P. Campana18,38, D. Campora Perez38, A. Carbone14,d, G. Carboni24,l, R. Cardinale19,38,j, A. Cardini15, L. Carson50,
K. Carvalho Akiba2, G. Casse52, L. Cassina20, L. Castillo Garcia38, M. Cattaneo38, Ch. Cauet9, R. Cenci58, M. Charles8, Ph. Charpentier38, M. Chefdeville4, S. Chen54, S.-F. Cheung55, N. Chiapolini40, M. Chrzaszcz40,26, K. Ciba38, X. Cid Vidal38, G. Ciezarek53, P.E.L. Clarke50, M. Clemencic38, H.V. Cliff47, J. Closier38, V. Coco38, J. Cogan6, E. Cogneras5, P. Collins38, A. Comerma-Montells11, A. Contu15, A. Cook46, M. Coombes46, S. Coquereau8, G. Corti38, M. Corvo16,f, I. Counts56, B. Couturier38, G.A. Cowan50, D.C. Craik48, M. Cruz Torres60, S. Cunliffe53, R. Currie50, C. D’Ambrosio38, J. Dalseno46, P. David8, P.N.Y. David41, A. Davis57, K. De Bruyn41, S. De Capua54, M. De Cian11, J.M. De Miranda1, L. De Paula2, W. De Silva57, P. De Simone18, D. Decamp4, M. Deckenhoff9, L. Del Buono8, N. D´el´eage4, D. Derkach55, O. Deschamps5, F. Dettori38, A. Di Canto38, H. Dijkstra38, S. Donleavy52, F. Dordei11, M. Dorigo39, A. Dosil Su´arez37, D. Dossett48, A. Dovbnya43, K. Dreimanis52, G. Dujany54, F. Dupertuis39, P. Durante38, R. Dzhelyadin35, A. Dziurda26, A. Dzyuba30, S. Easo49,38, U. Egede53, V. Egorychev31, S. Eidelman34, S. Eisenhardt50, U. Eitschberger9, R. Ekelhof9, L. Eklund51, I. El Rifai5, Ch. Elsasser40, S. Ely59, S. Esen11, H.-M. Evans47, T. Evans55, A. Falabella14, C. F¨arber11, C. Farinelli41, N. Farley45, S. Farry52, RF Fay52, D. Ferguson50, V. Fernandez Albor37, F. Ferreira Rodrigues1, M. Ferro-Luzzi38, S. Filippov33, M. Fiore16,f, M. Fiorini16,f, M. Firlej27, C. Fitzpatrick39, T. Fiutowski27, M. Fontana10, F. Fontanelli19,j, R. Forty38, O. Francisco2, M. Frank38, C. Frei38, M. Frosini17,38,g, J. Fu21,38, E. Furfaro24,l, A. Gallas Torreira37, D. Galli14,d, S. Gallorini22, S. Gambetta19,j, M. Gandelman2, P. Gandini59, Y. Gao3, J. Garc´ıa Pardi˜nas37, J. Garofoli59, J. Garra Tico47, L. Garrido36, C. Gaspar38, R. Gauld55, L. Gavardi9, G. Gavrilov30, E. Gersabeck11, M. Gersabeck54, T. Gershon48, Ph. Ghez4, A. Gianelle22, S. Giani’39, V. Gibson47, L. Giubega29, V.V. Gligorov38, C. G¨obel60, D. Golubkov31, A. Golutvin53,31,38, A. Gomes1,a, C. Gotti20, M. Grabalosa G´andara5,
R. Graciani Diaz36, L.A. Granado Cardoso38, E. Graug´es36, G. Graziani17, A. Grecu29,
E. Greening55, S. Gregson47, P. Griffith45, L. Grillo11, O. Gr¨unberg62, B. Gui59, E. Gushchin33, Yu. Guz35,38, T. Gys38, C. Hadjivasiliou59, G. Haefeli39, C. Haen38, S.C. Haines47, S. Hall53, B. Hamilton58, T. Hampson46, X. Han11, S. Hansmann-Menzemer11, N. Harnew55,
L. Henry8, J.A. Hernando Morata37, E. van Herwijnen38, M. Heß62, A. Hicheur1, D. Hill55, M. Hoballah5, C. Hombach54, W. Hulsbergen41, P. Hunt55, N. Hussain55, D. Hutchcroft52, D. Hynds51, M. Idzik27, P. Ilten56, R. Jacobsson38, A. Jaeger11, J. Jalocha55, E. Jans41, P. Jaton39, A. Jawahery58, F. Jing3, M. John55, D. Johnson55, C.R. Jones47, C. Joram38, B. Jost38, N. Jurik59, M. Kaballo9, S. Kandybei43, W. Kanso6, M. Karacson38, T.M. Karbach38, S. Karodia51, M. Kelsey59, I.R. Kenyon45, T. Ketel42, B. Khanji20, C. Khurewathanakul39, S. Klaver54, K. Klimaszewski28, O. Kochebina7, M. Kolpin11, I. Komarov39, R.F. Koopman42, P. Koppenburg41,38, M. Korolev32, A. Kozlinskiy41, L. Kravchuk33, K. Kreplin11, M. Kreps48, G. Krocker11, P. Krokovny34, F. Kruse9, W. Kucewicz26,o, M. Kucharczyk20,26,38,k,
V. Kudryavtsev34, K. Kurek28, T. Kvaratskheliya31, V.N. La Thi39, D. Lacarrere38,
G. Lafferty54, A. Lai15, D. Lambert50, R.W. Lambert42, G. Lanfranchi18, C. Langenbruch48, B. Langhans38, T. Latham48, C. Lazzeroni45, R. Le Gac6, J. van Leerdam41, J.-P. Lees4, R. Lef`evre5, A. Leflat32, J. Lefran¸cois7, S. Leo23, O. Leroy6, T. Lesiak26, B. Leverington11, Y. Li3, T. Likhomanenko63, M. Liles52, R. Lindner38, C. Linn38, F. Lionetto40, B. Liu15, S. Lohn38, I. Longstaff51, J.H. Lopes2, N. Lopez-March39, P. Lowdon40, H. Lu3, D. Lucchesi22,r, H. Luo50, A. Lupato22, E. Luppi16,f, O. Lupton55, F. Machefert7, I.V. Machikhiliyan31,
F. Maciuc29, O. Maev30, S. Malde55, A. Malinin63, G. Manca15,e, G. Mancinelli6, J. Maratas5, J.F. Marchand4, U. Marconi14, C. Marin Benito36, P. Marino23,t, R. M¨arki39, J. Marks11, G. Martellotti25, A. Martens8, A. Mart´ın S´anchez7, M. Martinelli41, D. Martinez Santos42, F. Martinez Vidal64, D. Martins Tostes2, A. Massafferri1, R. Matev38, Z. Mathe38,
C. Matteuzzi20, A. Mazurov16,f, M. McCann53, J. McCarthy45, A. McNab54, R. McNulty12, B. McSkelly52, B. Meadows57, F. Meier9, M. Meissner11, M. Merk41, D.A. Milanes8,
M.-N. Minard4, N. Moggi14, J. Molina Rodriguez60, S. Monteil5, M. Morandin22, P. Morawski27, A. Mord`a6, M.J. Morello23,t, J. Moron27, A.-B. Morris50, R. Mountain59, F. Muheim50,
K. M¨uller40, M. Mussini14, B. Muster39, P. Naik46, T. Nakada39, R. Nandakumar49, I. Nasteva2, M. Needham50, N. Neri21, S. Neubert38, N. Neufeld38, M. Neuner11, A.D. Nguyen39,
T.D. Nguyen39, C. Nguyen-Mau39,q, M. Nicol7, V. Niess5, R. Niet9, N. Nikitin32, T. Nikodem11, A. Novoselov35, D.P. O’Hanlon48, A. Oblakowska-Mucha27, V. Obraztsov35, S. Oggero41, S. Ogilvy51, O. Okhrimenko44, R. Oldeman15,e, G. Onderwater65, M. Orlandea29,
J.M. Otalora Goicochea2, P. Owen53, A. Oyanguren64, B.K. Pal59, A. Palano13,c, F. Palombo21,u, M. Palutan18, J. Panman38, A. Papanestis49,38, M. Pappagallo51, L.L. Pappalardo16,f,
C. Parkes54, C.J. Parkinson9,45, G. Passaleva17, G.D. Patel52, M. Patel53, C. Patrignani19,j, A. Pazos Alvarez37, A. Pearce54, A. Pellegrino41, M. Pepe Altarelli38, S. Perazzini14,d, E. Perez Trigo37, P. Perret5, M. Perrin-Terrin6, L. Pescatore45, E. Pesen66, K. Petridis53, A. Petrolini19,j, E. Picatoste Olloqui36, B. Pietrzyk4, T. Pilaˇr48, D. Pinci25, A. Pistone19, S. Playfer50, M. Plo Casasus37, F. Polci8, A. Poluektov48,34, E. Polycarpo2, A. Popov35, D. Popov10, B. Popovici29, C. Potterat2, E. Price46, J. Prisciandaro39, A. Pritchard52, C. Prouve46, V. Pugatch44, A. Puig Navarro39, G. Punzi23,s, W. Qian4, B. Rachwal26, J.H. Rademacker46, B. Rakotomiaramanana39, M. Rama18, M.S. Rangel2, I. Raniuk43, N. Rauschmayr38, G. Raven42, S. Reichert54, M.M. Reid48, A.C. dos Reis1, S. Ricciardi49, S. Richards46, M. Rihl38, K. Rinnert52, V. Rives Molina36, D.A. Roa Romero5, P. Robbe7, A.B. Rodrigues1, E. Rodrigues54, P. Rodriguez Perez54, S. Roiser38, V. Romanovsky35, A. Romero Vidal37, M. Rotondo22, J. Rouvinet39, T. Ruf38, F. Ruffini23, H. Ruiz36, P. Ruiz Valls64, J.J. Saborido Silva37, N. Sagidova30, P. Sail51, B. Saitta15,e,
V. Salustino Guimaraes2, C. Sanchez Mayordomo64, B. Sanmartin Sedes37, R. Santacesaria25, C. Santamarina Rios37, E. Santovetti24,l, A. Sarti18,m, C. Satriano25,n, A. Satta24,
D.M. Saunders46, M. Savrie16,f, D. Savrina31,32, M. Schiller42, H. Schindler38, M. Schlupp9, M. Schmelling10, B. Schmidt38, O. Schneider39, A. Schopper38, M.-H. Schune7, R. Schwemmer38, B. Sciascia18, A. Sciubba25, M. Seco37, A. Semennikov31, I. Sepp53, N. Serra40, J. Serrano6, L. Sestini22, P. Seyfert11, M. Shapkin35, I. Shapoval16,43,f, Y. Shcheglov30, T. Shears52, L. Shekhtman34, V. Shevchenko63, A. Shires9, R. Silva Coutinho48, G. Simi22, M. Sirendi47, N. Skidmore46, T. Skwarnicki59, N.A. Smith52, E. Smith55,49, E. Smith53, J. Smith47, M. Smith54, H. Snoek41, M.D. Sokoloff57, F.J.P. Soler51, F. Soomro39, D. Souza46, B. Souza De Paula2, B. Spaan9, A. Sparkes50, P. Spradlin51, S. Sridharan38, F. Stagni38, M. Stahl11, S. Stahl11, O. Steinkamp40, O. Stenyakin35, S. Stevenson55, S. Stoica29, S. Stone59, B. Storaci40, S. Stracka23,38, M. Straticiuc29, U. Straumann40, R. Stroili22, V.K. Subbiah38, L. Sun57, W. Sutcliffe53, K. Swientek27, S. Swientek9, V. Syropoulos42, M. Szczekowski28, P. Szczypka39,38, D. Szilard2, T. Szumlak27, S. T’Jampens4, M. Teklishyn7, G. Tellarini16,f, F. Teubert38, C. Thomas55, E. Thomas38, J. van Tilburg41, V. Tisserand4, M. Tobin39, S. Tolk42, L. Tomassetti16,f, D. Tonelli38, S. Topp-Joergensen55, N. Torr55, E. Tournefier4, S. Tourneur39, M.T. Tran39, M. Tresch40, A. Tsaregorodtsev6, P. Tsopelas41, N. Tuning41, M. Ubeda Garcia38, A. Ukleja28, A. Ustyuzhanin63, U. Uwer11, V. Vagnoni14, G. Valenti14, A. Vallier7, R. Vazquez Gomez18, P. Vazquez Regueiro37, C. V´azquez Sierra37, S. Vecchi16, J.J. Velthuis46, M. Veltri17,h, G. Veneziano39, M. Vesterinen11, B. Viaud7, D. Vieira2, M. Vieites Diaz37, X. Vilasis-Cardona36,p, A. Vollhardt40, D. Volyanskyy10, D. Voong46, A. Vorobyev30, V. Vorobyev34, C. Voß62, H. Voss10, J.A. de Vries41, R. Waldi62, C. Wallace48, R. Wallace12, J. Walsh23, S. Wandernoth11, J. Wang59, D.R. Ward47, N.K. Watson45,
D. Websdale53, M. Whitehead48, J. Wicht38, D. Wiedner11, G. Wilkinson55, M.P. Williams45, M. Williams56, F.F. Wilson49, J. Wimberley58, J. Wishahi9, W. Wislicki28, M. Witek26, G. Wormser7, S.A. Wotton47, S. Wright47, S. Wu3, K. Wyllie38, Y. Xie61, Z. Xing59, Z. Xu39, Z. Yang3, X. Yuan3, O. Yushchenko35, M. Zangoli14, M. Zavertyaev10,b, L. Zhang59,
W.C. Zhang12, Y. Zhang3, A. Zhelezov11, A. Zhokhov31, L. Zhong3, A. Zvyagin38. 1Centro Brasileiro de Pesquisas F´ısicas (CBPF), Rio de Janeiro, Brazil
2Universidade Federal do Rio de Janeiro (UFRJ), Rio de Janeiro, Brazil 3Center for High Energy Physics, Tsinghua University, Beijing, China 4LAPP, Universit´e de Savoie, CNRS/IN2P3, Annecy-Le-Vieux, France
5Clermont Universit´e, Universit´e Blaise Pascal, CNRS/IN2P3, LPC, Clermont-Ferrand, France 6CPPM, Aix-Marseille Universit´e, CNRS/IN2P3, Marseille, France
7LAL, Universit´e Paris-Sud, CNRS/IN2P3, Orsay, France
8LPNHE, Universit´e Pierre et Marie Curie, Universit´e Paris Diderot, CNRS/IN2P3, Paris, France 9Fakult¨at Physik, Technische Universit¨at Dortmund, Dortmund, Germany
10Max-Planck-Institut f¨ur Kernphysik (MPIK), Heidelberg, Germany
11Physikalisches Institut, Ruprecht-Karls-Universit¨at Heidelberg, Heidelberg, Germany 12School of Physics, University College Dublin, Dublin, Ireland
13Sezione INFN di Bari, Bari, Italy 14Sezione INFN di Bologna, Bologna, Italy 15Sezione INFN di Cagliari, Cagliari, Italy 16Sezione INFN di Ferrara, Ferrara, Italy 17Sezione INFN di Firenze, Firenze, Italy
18Laboratori Nazionali dell’INFN di Frascati, Frascati, Italy 19Sezione INFN di Genova, Genova, Italy
20Sezione INFN di Milano Bicocca, Milano, Italy 21Sezione INFN di Milano, Milano, Italy
23Sezione INFN di Pisa, Pisa, Italy
24Sezione INFN di Roma Tor Vergata, Roma, Italy 25Sezione INFN di Roma La Sapienza, Roma, Italy
26Henryk Niewodniczanski Institute of Nuclear Physics Polish Academy of Sciences, Krak´ow, Poland 27AGH - University of Science and Technology, Faculty of Physics and Applied Computer Science,
Krak´ow, Poland
28National Center for Nuclear Research (NCBJ), Warsaw, Poland
29Horia Hulubei National Institute of Physics and Nuclear Engineering, Bucharest-Magurele, Romania 30Petersburg Nuclear Physics Institute (PNPI), Gatchina, Russia
31Institute of Theoretical and Experimental Physics (ITEP), Moscow, Russia
32Institute of Nuclear Physics, Moscow State University (SINP MSU), Moscow, Russia
33Institute for Nuclear Research of the Russian Academy of Sciences (INR RAN), Moscow, Russia 34Budker Institute of Nuclear Physics (SB RAS) and Novosibirsk State University, Novosibirsk, Russia 35Institute for High Energy Physics (IHEP), Protvino, Russia
36Universitat de Barcelona, Barcelona, Spain
37Universidad de Santiago de Compostela, Santiago de Compostela, Spain 38European Organization for Nuclear Research (CERN), Geneva, Switzerland 39Ecole Polytechnique F´ed´erale de Lausanne (EPFL), Lausanne, Switzerland 40Physik-Institut, Universit¨at Z¨urich, Z¨urich, Switzerland
41Nikhef National Institute for Subatomic Physics, Amsterdam, The Netherlands
42Nikhef National Institute for Subatomic Physics and VU University Amsterdam, Amsterdam, The
Netherlands
43NSC Kharkiv Institute of Physics and Technology (NSC KIPT), Kharkiv, Ukraine
44Institute for Nuclear Research of the National Academy of Sciences (KINR), Kyiv, Ukraine 45University of Birmingham, Birmingham, United Kingdom
46H.H. Wills Physics Laboratory, University of Bristol, Bristol, United Kingdom 47Cavendish Laboratory, University of Cambridge, Cambridge, United Kingdom 48Department of Physics, University of Warwick, Coventry, United Kingdom 49STFC Rutherford Appleton Laboratory, Didcot, United Kingdom
50School of Physics and Astronomy, University of Edinburgh, Edinburgh, United Kingdom 51School of Physics and Astronomy, University of Glasgow, Glasgow, United Kingdom 52Oliver Lodge Laboratory, University of Liverpool, Liverpool, United Kingdom 53Imperial College London, London, United Kingdom
54School of Physics and Astronomy, University of Manchester, Manchester, United Kingdom 55Department of Physics, University of Oxford, Oxford, United Kingdom
56Massachusetts Institute of Technology, Cambridge, MA, United States 57University of Cincinnati, Cincinnati, OH, United States
58University of Maryland, College Park, MD, United States 59Syracuse University, Syracuse, NY, United States
60Pontif´ıcia Universidade Cat´olica do Rio de Janeiro (PUC-Rio), Rio de Janeiro, Brazil, associated to 2 61Institute of Particle Physics, Central China Normal University, Wuhan, Hubei, China, associated to3 62Institut f¨ur Physik, Universit¨at Rostock, Rostock, Germany, associated to11
63National Research Centre Kurchatov Institute, Moscow, Russia, associated to31
64Instituto de Fisica Corpuscular (IFIC), Universitat de Valencia-CSIC, Valencia, Spain, associated to36 65KVI - University of Groningen, Groningen, The Netherlands, associated to41
66Celal Bayar University, Manisa, Turkey, associated to38
aUniversidade Federal do Triˆangulo Mineiro (UFTM), Uberaba-MG, Brazil
bP.N. Lebedev Physical Institute, Russian Academy of Science (LPI RAS), Moscow, Russia cUniversit`a di Bari, Bari, Italy
dUniversit`a di Bologna, Bologna, Italy eUniversit`a di Cagliari, Cagliari, Italy
fUniversit`a di Ferrara, Ferrara, Italy gUniversit`a di Firenze, Firenze, Italy hUniversit`a di Urbino, Urbino, Italy
iUniversit`a di Modena e Reggio Emilia, Modena, Italy jUniversit`a di Genova, Genova, Italy
kUniversit`a di Milano Bicocca, Milano, Italy lUniversit`a di Roma Tor Vergata, Roma, Italy mUniversit`a di Roma La Sapienza, Roma, Italy nUniversit`a della Basilicata, Potenza, Italy
oAGH - University of Science and Technology, Faculty of Computer Science, Electronics and
Telecommunications, Krak´ow, Poland
pLIFAELS, La Salle, Universitat Ramon Llull, Barcelona, Spain qHanoi University of Science, Hanoi, Viet Nam
rUniversit`a di Padova, Padova, Italy sUniversit`a di Pisa, Pisa, Italy
tScuola Normale Superiore, Pisa, Italy