Publisher’s version / Version de l'éditeur:
Journal of Analytical Atomic Spectrometry, 2016-01-06
READ THESE TERMS AND CONDITIONS CAREFULLY BEFORE USING THIS WEBSITE.
https://nrc-publications.canada.ca/eng/copyright
Vous avez des questions? Nous pouvons vous aider. Pour communiquer directement avec un auteur, consultez la
première page de la revue dans laquelle son article a été publié afin de trouver ses coordonnées. Si vous n’arrivez pas à les repérer, communiquez avec nous à PublicationsArchive-ArchivesPublications@nrc-cnrc.gc.ca.
Questions? Contact the NRC Publications Archive team at
PublicationsArchive-ArchivesPublications@nrc-cnrc.gc.ca. If you wish to email the authors directly, please see the first page of the publication for their contact information.
This publication could be one of several versions: author’s original, accepted manuscript or the publisher’s version. / La version de cette publication peut être l’une des suivantes : la version prépublication de l’auteur, la version acceptée du manuscrit ou la version de l’éditeur.
For the publisher’s version, please access the DOI link below./ Pour consulter la version de l’éditeur, utilisez le lien DOI ci-dessous.
https://doi.org/10.1039/C5JA00444F
Access and use of this website and the material on it are subject to the Terms and Conditions set forth at Determination of inorganic mercury in petroleum production water by inductively coupled plasma optical emission spectrometry following photochemical vapor generation
Francisco, Barbara Bruna Alves; Rocha, Anderson Araujo; Grinberg, Patricia; Sturgeon, Ralph E.; Cassella, Ricardo Jorgensen
https://publications-cnrc.canada.ca/fra/droits
L’accès à ce site Web et l’utilisation de son contenu sont assujettis aux conditions présentées dans le site LISEZ CES CONDITIONS ATTENTIVEMENT AVANT D’UTILISER CE SITE WEB.
NRC Publications Record / Notice d'Archives des publications de CNRC:
https://nrc-publications.canada.ca/eng/view/object/?id=b6e4ccbb-756a-497e-ae1d-3eeae528a13b https://publications-cnrc.canada.ca/fra/voir/objet/?id=b6e4ccbb-756a-497e-ae1d-3eeae528a13b
This is an Accepted Manuscript, which has been through the Royal Society of Chemistry peer review process and has been accepted for publication.
Accepted Manuscripts are published online shortly after
acceptance, before technical editing, formatting and proof reading. Using this free service, authors can make their results available to the community, in citable form, before we publish the edited article. We will replace this Accepted Manuscript with the edited and formatted Advance Article as soon as it is available.
You can find more information about Accepted Manuscripts in the Information for Authors.
Please note that technical editing may introduce minor changes to the text and/or graphics, which may alter content. The journal’s standard Terms & Conditions and the Ethical guidelines still apply. In no event shall the Royal Society of Chemistry be held responsible for any errors or omissions in this Accepted Manuscript or any consequences arising from the use of any information it contains.
Accepted Manuscript
JAAS
www.rsc.org/jaas
This article can be cited before page numbers have been issued, to do this please use: B. B. A. Francisco, A. A. Rocha, P. Grinberg, R. E. Sturgeon and R. J. Cassella, J. Anal. At. Spectrom., 2016, DOI:
1 1
DETERMINATION OF INORGANIC MERCURY IN PETROLEUM PRODUCTION WATER BY 2
INDUCTIVELY COUPLED PLASMA OPTICAL EMISSION SPECTROMETRY FOLLOWING 3
PHOTOCHEMICAL VAPOR GENERATION 4
5
Barbara Bruna A. Franciscoab, Anderson A. Rochab, Patricia Grinberga, Ralph E. 6
Sturgeona and Ricardo J. Cassellab* 7
8 a
Measurement Science and Standards, National Research Council of Canada, Ottawa, 9
Ontario, Canada K1A 0R9. 10
11 b
Departamento de Química Analítica, Universidade Federal Fluminense, Outeiro de 12
São João Batista, s/n, Centro, Niterói, RJ, Brazil 24020-150. 13 14 15 16 17 18 19 20 21 22 23 24 25 26 27 * Corresponding author 28
Email address: cassella@vm.uff.br 29 Tel.: + 55 21 26292344 30 Fax: + 55 21 26292143 31 32 3 4 5 6 7 8 9 10 11 12 13 14 15 16 17 18 19 20 21 22 23 24 25 26 27 28 29 30 31 32 33 34 35 36 37 38 39 40 41 42 43 44 45 46 47 48 49 50 51 52 53 54 55 56 57 58 59 60
Journal
of
Analytical
Atomic
Spectrometry
Accepted
Manuscript
Published on 06 January 2016. Downloaded by National Research Council Canada on 11/01/2016 14:08:39.
View Article Online DOI: 10.1039/C5JA00444F
2 Abstract
33 34
A photochemical vapor generation system coupled to an inductively coupled plasma 35
optical emission spectrometer (ICP-OES) was used for the determination of inorganic 36
mercury in high salinity water arising from offshore petroleum exploration platforms, 37
i.e., production water (PW). The system comprised a 17 W UV grid lamp for 38
photogeneration along with two gas/liquid separators functioning in tandem to 39
minimize aerosol transport into the plasma. Analytical conditions, including type and 40
concentration of low molecular weight organic acid, UV exposure time and solution pH 41
were optimized. Continuous-flow processing of a sample containing 1.63 mol L-1 formic 42
acid at pH 1.5 for a UV irradiation time of 30 s permitted Hg(II) to be determined based 43
on the method of additions. Procedural limits of detection and quantification of 1.2 44
and 4.0 µg L-1, respectively, were achieved. In the absence of a suitable Certified 45
Reference Material with which to validate methodology, recoveries of 10 - 40 µg L-1 46
Hg(II) spikes added to real samples were examined and ranged from 79 to 121%. 47
48
Keywords: Petroleum production waters; Mercury; Photochemical vapor generation; 49
Inductively coupled plasma optical emission spectrometry 50 51 52 53 54 55 56 2 3 4 5 6 7 8 9 10 11 12 13 14 15 16 17 18 19 20 21 22 23 24 25 26 27 28 29 30 31 32 33 34 35 36 37 38 39 40 41 42 43 44 45 46 47 48 49 50 51 52 53 54 55 56 57 58 59 60
Journal
of
Analytical
Atomic
Spectrometry
Accepted
Manuscript
Published on 06 January 2016. Downloaded by National Research Council Canada on 11/01/2016 14:08:39.
View Article Online DOI: 10.1039/C5JA00444F
3
1. Introduction
57
58
According to the Brazilian National Council of the Environment (CONAMA, 59
Brazil), production water (PW) is the water produced together with petroleum [1]. It 60
comprises a mixture of endogenous (formation) water (naturally present in geological 61
reservoirs) and injected water (water introduced into the reservoir to enhance 62
petroleum yield).1 It is hazardous due its complex composition and, sometimes, its 63
volume exceeds that of oil/gas production by five-fold.2-3 Production water is 64
considered a wastewater with a natural chemical composition reflecting the geological 65
characteristics of the reservoir of origin.2-3 This may include toxic substances, such as 66
aromatic fractions of oil (BTEX and polycyclic aromatic hydrocarbons), organic acids, 67
phenols and alkylated phenols. Additionally, toxic elements (arsenic, lead, mercury, 68
among others) and radionuclides can be present4 in a matrix of high salinity and 69
temperature differing significantly from that of seawater.5 Added chemicals, such as 70
corrosion inhibitors, scale inhibitors, biocides, oxygen scavengers, emulsion-breakers 71
or deoilers, antifoam agents, viscosifiers, hydrate inhibitors and cleaners may also be 72
present.6 All such compounds influence the composition of PW and its physico-73
chemical properties. Clearly, due to the environmental risk associated with it, and 74
considering the fact that a fraction of treated PW usually enters the ocean, there is 75
interest in developing analytical methods to characterize such waste to enable 76
monitoring its characteristics before it is discharged. 77
Toxic inorganic species (trace metals and semi-metals) in PW are an 78
environmental and health concern because of the risk of their bioaccumulation. To 79
date, only a few metallic contaminants (i.e., Pb, V, Cr and Mn) have been determined 80 3 4 5 6 7 8 9 10 11 12 13 14 15 16 17 18 19 20 21 22 23 24 25 26 27 28 29 30 31 32 33 34 35 36 37 38 39 40 41 42 43 44 45 46 47 48 49 50 51 52 53 54 55 56 57 58 59 60
Journal
of
Analytical
Atomic
Spectrometry
Accepted
Manuscript
Published on 06 January 2016. Downloaded by National Research Council Canada on 11/01/2016 14:08:39.
View Article Online DOI: 10.1039/C5JA00444F
4
in PW in attempts to regulate the control of this effluent.6-10 Although mercury has a 81
high toxicity and tendency to bioaccumulate in marine animals and ultimately enter 82
the human food chain, no reports of its determination in PW are available. Moreover, 83
most mercury released into the marine environment is in the inorganic form and may 84
undergo biogeochemical transformations, such as bacterial methylation, converting it 85
into the more toxic form of methylmercury (CH3Hg+).11-13 86
Several analytical techniques have been employed for the determination of 87
mercury at trace concentrations. The most popular is, undoubtedly, cold vapor 88
generation (CVG) using chemical reducing agents such as NaBH4,14-15 stannous 89
chloride,16 sodium cyanotrihydroborate (III)17 and sodium/potassium tetrahydroborate 90
(THB)18 or by electrolytic reduction.19 CVG is usually coupled with various detection 91
platforms, such as atomic absorption (CVG-AAS),14-15,19 atomic fluorescence (CVG-92
AFS)18 or inductively coupled plasmas (CVG-ICP-MS and CVG-ICP-OES).16,18 These 93
techniques are sometimes operated with flow injection (FIA) systems15,20 to increase 94
the degree of automation and enhance productivity. Despite their high detection 95
power, alternative approaches to reduction based on photochemical reactions are 96
currently being pursued. Exposure of samples to UV radiation in the presence of low 97
molecular weight (LMW) organic compounds, such as formic, acetic and propionic 98
acids,21 generates electron donors such as •H and •CO radicals which are capable of 99
reducing metal ions to various vapor species.21-22 100
Photochemical vapor generation (PVG) possess several advantages over 101
traditional CVG techniques, including greener chemistry, simplicity, low-cost and 102
enhanced freedom from possible interferences.23 These characteristics make PVG 103
attractive for the determination of inorganic mercury in PW samples. The present work 104 2 3 4 5 6 7 8 9 10 11 12 13 14 15 16 17 18 19 20 21 22 23 24 25 26 27 28 29 30 31 32 33 34 35 36 37 38 39 40 41 42 43 44 45 46 47 48 49 50 51 52 53 54 55 56 57 58 59 60
Journal
of
Analytical
Atomic
Spectrometry
Accepted
Manuscript
Published on 06 January 2016. Downloaded by National Research Council Canada on 11/01/2016 14:08:39.
View Article Online DOI: 10.1039/C5JA00444F
5
focuses on the development and optimization of a UV-photochemical generation 105
approach to the determination of inorganic mercury in samples of high salinity artificial 106
PW samples (APW) and authentic PW obtained from Brazilian offshore petroleum 107 exploration platforms. 108 109
2. Experimental
110 111 2.1. Instrumentation 112 113A Perkin-Elmer 3000 Optima ICP-OES (Thornhill, Ontario, CA) was interfaced to 114
a home-made PVG system. The experimental setup consisted of a UV photoreactor 115
and two gas-liquid separators. The former comprised a 17 W low pressure UV mercury 116
grid lamp (Analamp, Claremont, CA) over which was placed a quartz tube (25 cm x 2.5 117
mm i.d. x 3.5 mm o.d.; 5 mL internal volume), shaped to conform to the discharge 118
lamp geometry, to permit irradiation of the sample. The lamp was enclosed in a metal 119
chamber flushed with nitrogen to prevent ozone formation and cooled with the help of 120
a fan to avoid overheating. 121
One gas-liquid separator (GLS I) was placed immediately at the output of the 122
photoreactor. A carrier flow of argon was introduced at the bottom of the GLS and 123
passed through a sintered glass frit which supported the irradiated liquid sample. A 124
second gas-liquid separator (GLS II), filled with glass beads of varying sizes, was placed 125
in tandem to the first and simply served to reduce residual aerosol carryover to the 126
plasma. This arrangement was particularly beneficial when organic constituents were 127
added to the system to study the impact of interferences on the analysis of real 128 3 4 5 6 7 8 9 10 11 12 13 14 15 16 17 18 19 20 21 22 23 24 25 26 27 28 29 30 31 32 33 34 35 36 37 38 39 40 41 42 43 44 45 46 47 48 49 50 51 52 53 54 55 56 57 58 59 60
Journal
of
Analytical
Atomic
Spectrometry
Accepted
Manuscript
Published on 06 January 2016. Downloaded by National Research Council Canada on 11/01/2016 14:08:39.
View Article Online DOI: 10.1039/C5JA00444F
6
samples. A 70 cm length of PTFE (4.0 mm i.d) tubing connected the outlet of GLS I (or 129
GLS II, depending on the experiment) to the base of the quartz torch. A T connector 130
was placed after GLS II to introduce an Ar carrier gas (via the instrument nebulizer gas 131
stream) into the system and transport the elemental mercury vapor to the ICP-OES 132
torch. A schematic diagram of the setup is presented in Fig. 1. 133
A Gilson Miniplus 2 peristaltic pump (Gilson, Middleton, WI, USA), fitted with 134
1.42 mm i.d. Tygon® tubing, was used to deliver samples (and standard solutions) to 135
the photoreactor. A second such pump, fitted with 2.79 mm id Tygon
®
tubing, was 136employed to extract waste from GLS I. All connections and tees were constructed from 137
low pressure flangeless fittings (Upchurch Scientific Inc., Oak Harbor, WA, USA). 138
Polyethylene vessels and sampling tubes (Fisher Scientific Canada, Ottawa, ON, 139
CA) of different volumes, used in all steps of the procedure, were pre-cleaned in order 140
to reduce contamination. These were kept overnight in a solution of 5% v/v nitric acid, 141
rinsed several times with high-purity deionized water and dried in a class-10 clean 142
hood before use. 143
Salinity measurements were performed with a model S/Mill-E hand-held 144
refractometer furnished by Atago (Saitama, Japan). 145
146
2.2. Reagents, solutions and materials 147
148
Analytical-grade reagents were used in all experiments. All solutions were 149
prepared using high-purity deionized water (DIW) of 18.2 MΩ-cm resistivity produced 150
in the laboratory using a commercial deionization system (Barnstead/Thermolyne, 151
Dubuque, IA, USA). A 1,000 µg mL-1 solution of inorganic mercury, purchased from SCP 152 2 3 4 5 6 7 8 9 10 11 12 13 14 15 16 17 18 19 20 21 22 23 24 25 26 27 28 29 30 31 32 33 34 35 36 37 38 39 40 41 42 43 44 45 46 47 48 49 50 51 52 53 54 55 56 57 58 59 60
Journal
of
Analytical
Atomic
Spectrometry
Accepted
Manuscript
Published on 06 January 2016. Downloaded by National Research Council Canada on 11/01/2016 14:08:39.
View Article Online DOI: 10.1039/C5JA00444F
7
Science (Quebec, CA), served as the primary calibration standard. Formic, glacial acetic 153
and propionic acids were sourced from Fisher Chemicals (Fair Lawn, NJ, USA). Nitric 154
acid was purified in-house prior to use by sub-boiling distillation of analytical grade 155
feedstock using a quartz still. All solutions were prepared in a class-10 environment 156
within a clean laboratory. 157
158
2.3. Preparation of artificial PW samples and collection of real field samples 159
160
Artificial PW samples (APW) served for method development (due to a limited 161
supply of authentic PW samples) and to check instrument robustness. Optimization of 162
the methodology was undertaken using spiked solutions of DIW containing varying 163
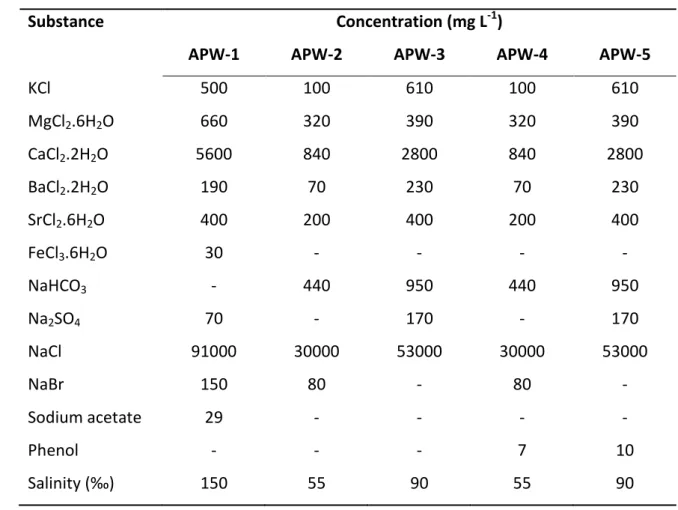
contents of potential individual interferents and LMW. APW samples were prepared by 164
dissolving inorganic salts and organic reagents (KCl, MgCl2.6H2O; CaCl2.2H2O; 165
BaCl2.2H2O; SrCl2.6H2O; FeCl3.6H2O; NaHCO3; Na2SO4; NaCl; NaBr; CH3COONa; phenol) 166
in deionized water in accordance with the information given in Table 1. The salinity of 167
each APW sample is presented in Table 1 as well. 168
Authentic PW samples, supplied by Petrobras, were collected from Brazilian 169
offshore petroleum platforms and stored in pre-cleaned polyethylene containers. They 170
were acidified to pH 1.8 with high purity nitric acid to ensure stability of mercury. 171
172
2.4. General analytical procedure 173
174
ICP-OES operating parameters, reagent concentrations and physical parameters 175
of the system were all optimized. Spectrometer parameters are summarized in Table 2. 176 3 4 5 6 7 8 9 10 11 12 13 14 15 16 17 18 19 20 21 22 23 24 25 26 27 28 29 30 31 32 33 34 35 36 37 38 39 40 41 42 43 44 45 46 47 48 49 50 51 52 53 54 55 56 57 58 59 60
Journal
of
Analytical
Atomic
Spectrometry
Accepted
Manuscript
Published on 06 January 2016. Downloaded by National Research Council Canada on 11/01/2016 14:08:39.
View Article Online DOI: 10.1039/C5JA00444F
8
The optimized method was applied to the determination of mercury in 177
authentic PW and spiked APW samples. For all optimization studies, a working solution 178
containing 10 µg L-1 inorganic mercury together with an appropriate concentration of 179
LMW was employed. Samples and test solutions were pumped through the 180
photoreactor and subsequently to GLS I and GLS II from which the mercury vapor was 181
directed to the ICP-OES. 182
Preparation and manipulation of all samples was conducted in a class-10 183
environment within a clean laboratory. PW samples were first passed through a 184
disposable syringe filter (pore diameter 0.45 µm) to remove oil and suspended 185
particulate material. Both artificial and real samples were diluted ten-fold prior to 186
analysis to minimize the impact of the sample matrix. 187
188
2.5. Sample analysis 189
190
Before each measurement, samples were diluted 10-fold with DIW and sufficient 191
formic acid then added to yield a concentration of 1.62 mol L-1. In practice, 25 mL of 192
sample were mixed with 18.75 mL formic acid and approximately 200 mL DIW then 193
added. This solution was transferred to a precleaned 250-mL volumetric flask and a 194
sufficient volume of 6 mol L-1 H2SO4 solution added to yield a pH of 1.5. The final 195
volume was made to the mark by addition of DIW and the sample was pumped into 196
the photoreactor at a flow rate of 1.57 mL min-1 for the measurement of Hg signals. 197 198 199 200 2 3 4 5 6 7 8 9 10 11 12 13 14 15 16 17 18 19 20 21 22 23 24 25 26 27 28 29 30 31 32 33 34 35 36 37 38 39 40 41 42 43 44 45 46 47 48 49 50 51 52 53 54 55 56 57 58 59 60
Journal
of
Analytical
Atomic
Spectrometry
Accepted
Manuscript
Published on 06 January 2016. Downloaded by National Research Council Canada on 11/01/2016 14:08:39.
View Article Online DOI: 10.1039/C5JA00444F
9 2.5. Safety considerations
201 202
The full range of volatile species generated during PVG is unknown and should 203
be considered toxic. Inhalation and contact with skin and eyes should be avoided and, 204
consequently, all work should be performed under well-ventilated conditions. 205
206
3. Results and discussion
207
208
Optimization studies were based on earlier work by Vieira et al.,24 Grinberg and 209
Sturgeon25 and Zheng et al.,26 which detailed the initial selection of low molecular 210
weight (LMW) organic acids and their concentrations, irradiation time and the 211
evaluation of the efficiency of PVG. As noted earlier, all test solutions used for 212
optimization comprised high purity DIW to which the individual components of 213
interest were added and subsequently examined for response in order to 214
systematically isolate the impact of each variable. After optimization, the methodology 215
was first applied to spiked APW samples to determine spike recoveries and robustness 216
before subsequent analysis of real PW samples. 217
218
3.1. Selection of low molecular weight organic acid and its concentration 219
220
Formic, acetic and propionic acids were tested for their relative efficiency for 221
photochemical vapor generation. Sufficient speed of reduction (likely due to radical 222
generation through photolysis of the LMW) is obtained only when an adequate 223
concentration of the organic acid is present in the reaction medium.27 The effect of 224 3 4 5 6 7 8 9 10 11 12 13 14 15 16 17 18 19 20 21 22 23 24 25 26 27 28 29 30 31 32 33 34 35 36 37 38 39 40 41 42 43 44 45 46 47 48 49 50 51 52 53 54 55 56 57 58 59 60
Journal
of
Analytical
Atomic
Spectrometry
Accepted
Manuscript
Published on 06 January 2016. Downloaded by National Research Council Canada on 11/01/2016 14:08:39.
View Article Online DOI: 10.1039/C5JA00444F
10
their concentration was investigated in the range 0 – 2.71, 0 – 1.66 and 0 – 1.35 mol L-1 225
for formic, acetic and propionic acid, respectively. The time of exposure to UV light 226
was maintained constant at 100 s and all tests were performed at an added spike 227
concentration of 10 µg L-1 inorganic mercury. 228
From Figure 2, it is evident that response increased with concentration of LMW 229
acid up to 1.62 mol L-1 for formic acid while maximum signals were observed at 1.66 230
and 1.01 mol L-1 for acetic and propionic acids, respectively. At higher concentrations, 231
the signals remained practically constant, indicating that no additional photochemical 232
reduction of inorganic Hg could be achieved. These results are in accord with those of 233
others,28-29 who demonstrated that the generation efficiency in such media is higher 234
than in the presence of other organic molecules, such as aldehydes and ketones. 235
Additionally, these short chain acids provide a more favorable photoreduction 236
environment than methylation and ethylation processes.30 237
Propionic acid resulted in the formation of a large amount of foam in the GLS, 238
inducing some instability in the plasma. Foam production could be associated with the 239
release of CO2 and formation of CH3Hg+, as showed by Yin et al..28 Thus, no further 240
studies were performed using this acid. For subsequent work, a formic acid 241
concentration of 1.63 mol L-1 and an acetic acid concentration of 1.66 mol L-1 were 242
used. 243
244
3.2. Influence of irradiation time 245
246
PVG is enhanced in the presence of most organic acids because of their strong 247
absorption in the deep UV.30 Although the mechanism of PVG of mercury is not 248 2 3 4 5 6 7 8 9 10 11 12 13 14 15 16 17 18 19 20 21 22 23 24 25 26 27 28 29 30 31 32 33 34 35 36 37 38 39 40 41 42 43 44 45 46 47 48 49 50 51 52 53 54 55 56 57 58 59 60
Journal
of
Analytical
Atomic
Spectrometry
Accepted
Manuscript
Published on 06 January 2016. Downloaded by National Research Council Canada on 11/01/2016 14:08:39.
View Article Online DOI: 10.1039/C5JA00444F
11
entirely clear, the general concept is that absorption of UV radiation by LMW acid 249
medium induces radical formation, promoting reduction of mercury.26,30 Irradiation 250
time plays an important role in this process because the formation of radicals is 251
enhanced with an increase in the amount of energy (through photon absorption) 252
delivered to the system. 253
When test solutions containing 1.62 mol L-1 formic acid or 1.66 mol L-1 acetic 254
acid were delivered to the photoreactor with the UV lamp off, response was 255
indistinguishable from instrumental noise, highlighting the need for UV irradiation to 256
achieve vapor generation. Test solutions were then pumped to the reactor with the 257
lamp on and the irradiation time was varied from 30 to 180 s. For formic acid, 258
maximum response was achieved using an irradiation time of 30 s. Longer irradiation 259
times decreased signal intensity until no signal above background noise occurred when 260
the irradiation time reached 130 s. This may have been a consequence of the longer 261
residence times of reduced mercury in the acidic medium giving rise to re-oxidation; it 262
appears to be a common phenomenon in such PVG systems.24-26 263
When acetic acid was used for photogeneration, the kinetics of the process was 264
noticeably different, requiring a 60s irradiation before any product was detected. 265
Maximum response was achieved with a 90 s irradiation time, after which it 266
continuously decreased with loner times in the same manner as with formic acid. 267
268
3.3. Influence of sample pH 269
270
The effect of sample pH was examined over the range 0.5 to 8.0 in the presence 271
of both LMW organic acids. It is noteworthy that the original pH of a 10 µg L-1 solution 272 3 4 5 6 7 8 9 10 11 12 13 14 15 16 17 18 19 20 21 22 23 24 25 26 27 28 29 30 31 32 33 34 35 36 37 38 39 40 41 42 43 44 45 46 47 48 49 50 51 52 53 54 55 56 57 58 59 60
Journal
of
Analytical
Atomic
Spectrometry
Accepted
Manuscript
Published on 06 January 2016. Downloaded by National Research Council Canada on 11/01/2016 14:08:39.
View Article Online DOI: 10.1039/C5JA00444F
12
of inorganic mercury in both 1.63 mol L-1 formic and 1.66 mol L-1 acetic acid was 2.5. 273
The pH of such solutions was adjusted to the desired value using dilute solutions of 274
either NH4OH or H2SO4. Results are presented in Fig. 3. 275
Maximum response was achieved at pH 1.5 and 2 for formic and acetic acid, 276
respectively. At high pH, signals decreased, possibly due to ·OH radicals preventing 277
reduction of Hg(II) or competing via oxidation reactions.31 Yin et al.28 reported that 278
methylation and ethylation processes were most favorable when the pH was 4.0 in 279
acetic acid solutions. This may explain the decrease in signal response over this pH 280
region. At low pH, re-oxidation of the Hg0 may rapidly occur in the solution due to the 281
presence of OH and H2O2 species likely generated by the UV irradiation.28,32 282
283
3.4 Interferences 284
285
The effect of the sample matrix may be significant due to its complex nature as 286
it contains a large variety of organic and inorganic substances that may interfere with 287
the PVG process. The interference study comprised investigations along three avenues: 288
(i) evaluation of the influence of chloride ion (the main constituent); (ii) evaluation of 289
possible organic interferences using phenol, toluene, ethanol and methanol as model 290
compounds, and (iii) evaluation of the influence of additional inorganic species 291
(selected cations and anions known to be present in such samples).2,4-5,33-39 292 293 294 295 296 2 3 4 5 6 7 8 9 10 11 12 13 14 15 16 17 18 19 20 21 22 23 24 25 26 27 28 29 30 31 32 33 34 35 36 37 38 39 40 41 42 43 44 45 46 47 48 49 50 51 52 53 54 55 56 57 58 59 60
Journal
of
Analytical
Atomic
Spectrometry
Accepted
Manuscript
Published on 06 January 2016. Downloaded by National Research Council Canada on 11/01/2016 14:08:39.
View Article Online DOI: 10.1039/C5JA00444F
13 3.4.1. Influence of chloride ion
297 298
Sodium chloride is the principal inorganic component of PW samples and is 299
present at concentrations higher than that in seawater; sample salinity ranges up to 300
267‰. As chloride ion forms stable complexes with Hg(II), its effect on response was 301
studied in the range 0 to 80 g L-1. Results obtained in both formic and acetic acid media 302
are depicted in Fig. 4. In formic acid, signal intensity increased with increasing Cl -303
concentration up to 60 g L-1, beyond which response slightly decreased. The impact of 304
chloride is thus minimal in terms of complexation reactions removing Hg(II) from the 305
vapor generation process; enhanced signals may be a consequence of increased 306
efficiency of the gas/liquid phase separation process due to the rising ionic strength of 307
the medium (i.e., salting out effect). On the other hand, in acetic acid, signals were 308
close to instrumental noise even when the salt was present at concentrations as low as 309
5 g L-1. Although an interesting observation, the reason for such signal suppression in 310
acetic acid was not further investigated and is beyond the scope of this study. Based 311
on these results, use of acetic acid for PVG of inorganic mercury in real samples of PW 312
was not further investigated. 313
314
3.4.2. Evaluation of potential interferences from organic constituents 315
316
The presence of organic substances in PW samples is very common, since the 317
formation water, which is mixed with the injected water to yield production water, is 318
in contact with the oil in the reservoir. In order to evaluate the influence of organic 319
compounds on PVG of inorganic mercury, phenol, toluene, ethanol and methanol were 320 3 4 5 6 7 8 9 10 11 12 13 14 15 16 17 18 19 20 21 22 23 24 25 26 27 28 29 30 31 32 33 34 35 36 37 38 39 40 41 42 43 44 45 46 47 48 49 50 51 52 53 54 55 56 57 58 59 60
Journal
of
Analytical
Atomic
Spectrometry
Accepted
Manuscript
Published on 06 January 2016. Downloaded by National Research Council Canada on 11/01/2016 14:08:39.
View Article Online DOI: 10.1039/C5JA00444F
14
used as model compounds. Results are presented in Table 3. In this study tolerable 321
concentration was defined as the maximum concentration of interferent at which a 322
15% deviation of the response occurs. 323
Phenol has been reported to be in the range of 0.004–1.20 mg L-1 in PW 324
samples of varying origin.2,34,39-40 The effect of toluene was examined in the range 0 – 325
0.63% in accordance with the findings in ref 40. Ethanol and methanol were also tested 326
due to their possible presence in produced water samples although no reports of their 327
concentrations are known. 328
The concentration of phenol was varied from 0 – 15 mg L-1 as it is known to be 329
an efficient quencher of photochemical reactions. Thus, although this concentration 330
range is notably higher than that reported in real PW samples, it serves as a worst case 331
test of the impact of high amounts of generic organic species on the proposed 332
methodology. In the formic acid medium, Hg signals decreased continuously with 333
increasing phenol concentration. At a concentration of 15 mg L-1 phenol, response was 334
suppressed 30%. Akbal and Onar41 and Roig et al.42 have demonstrated that phenol 335
photolyses on exposure to UV light, even under low pH conditions, yielding 336
intermediate species which may impair the PVG efficiency of mercury. This was also 337
evident from this study; when phenol was added to the sample after the UV 338
photochemical generation, by continuous on-line addition through a T connection, no 339
effect was observed, even at a concentration of 15 mg L-1. No significant variation (± 340
15%) was observed in the presence of either toluene, in the range 0 – 0.63% (0 – 5.80 341
mol L-1), ethanol 0 – 3% (0 - 13.8 mol L-1) or methanol 0-10% (0 – 32 mol L-1). 342 343 344 2 3 4 5 6 7 8 9 10 11 12 13 14 15 16 17 18 19 20 21 22 23 24 25 26 27 28 29 30 31 32 33 34 35 36 37 38 39 40 41 42 43 44 45 46 47 48 49 50 51 52 53 54 55 56 57 58 59 60
Journal
of
Analytical
Atomic
Spectrometry
Accepted
Manuscript
Published on 06 January 2016. Downloaded by National Research Council Canada on 11/01/2016 14:08:39.
View Article Online DOI: 10.1039/C5JA00444F
15
3.4.3. Evaluation of possible interferences from inorganic species 345
346
Three separate groups of inorganic species were evaluated for their effect on 347
PVG response: (i) metal and semi-metal ions such as Zn(II), Ni(II), Fe(III), Pb(II), As(III), 348
Cr(III), Se(IV), Sb(II) and Cu(II); (ii) alkali metals and alkaline earth ions such as Ba(II), 349
K(I), Mg(II), Sr(II) and Ca(II) and (iii) NO3-, which is usually added to samples as nitric 350
acid to ensure preservation. The concentration ranges tested were based on earlier 351
studies that examined the presence of these species in PW samples2,4-5,33-39 and are 352
summarized in Table 3. This evaluation was only performed in formic acid media 353
because, as noted earlier, use of acetic acid to induce PVG of inorganic mercury in 354
highly saline media was not viable. 355
No significant interference was observed in the presence of K(I), Ba(II), Sr(II), 356
Mg(II), Cu(II), Pb(II) and Zn (II) over the concentration ranges studied, whereas the 357
presence of Ca(II), Ni(II), Sb(III), As(III), Se(IV), Fe(III) and Cr(III) was significant. 358
Maximum tolerable concentrations for each tested interferent are summarized in 359
Table 3. 360
No inferences could be made regarding the mechanism of these interferences, 361
suffice to state that more work needs to be done to address this but that, at the 362
concentration levels likely to be encountered in (10-fold diluted) PW samples, their 363
presence can be tolerated. An additional important aspect to be considered is the very 364
high concentration of NaCl present in such samples, which makes the effect of this 365
component predominant over all other interferents present at lower-concentrations. 366 367 368 3 4 5 6 7 8 9 10 11 12 13 14 15 16 17 18 19 20 21 22 23 24 25 26 27 28 29 30 31 32 33 34 35 36 37 38 39 40 41 42 43 44 45 46 47 48 49 50 51 52 53 54 55 56 57 58 59 60
Journal
of
Analytical
Atomic
Spectrometry
Accepted
Manuscript
Published on 06 January 2016. Downloaded by National Research Council Canada on 11/01/2016 14:08:39.
View Article Online DOI: 10.1039/C5JA00444F
16 3.4. Effect of nitrate
369 370
Interference from NO3- on PVG processes has been well documented.30,43 Guo et al.44, 371
reported that the presence of nitrate ions altered the yield of volatile species of 372
selenium and modified the nature of the generated product. Sturgeon and Grinberg30 373
noted that 0.7 mol L-1 NO3- (as nitric acid) caused total inhibition of PVG of Hg in a 0.83 374
mol L-1acetic acid medium, probably because of its ability to participate in a number of 375
radical scavenging reactions. In this study, the influence of nitrate ion was evaluated 376
over the range 0 - 0.14 mol L-1 in solutions of 1.62 mol L-1 formic acid spiked with 10 µg 377
L-1 Hg(II). Response decreased approximately 15% at the highest concentration of 378
nitrate added. This effect was less pronounced than reported in earlier studies using 379
an acetic acid medium30, and was independent of the form in which it was added to 380
the solution (as sodium nitrate or nitric acid). 381
382
4. Analytical figures of merit and method application
383
384
Analytical figures of merit, derived under optimum conditions in the presence 385
of formic acid, are summarized in Table 4. The limit of detection (LOD) was based on a 386
3s criterion, where s is the standard deviation of the results for 10 repetitive 387
measurements of the processed blank. The limit of quantification (LOQ) was based on 388
10s. The precision of the proposed procedure was calculated from the relative 389
standard deviation of the mean of the linear slopes of ten analytical curves 390
constructed over ten different days. 391 2 3 4 5 6 7 8 9 10 11 12 13 14 15 16 17 18 19 20 21 22 23 24 25 26 27 28 29 30 31 32 33 34 35 36 37 38 39 40 41 42 43 44 45 46 47 48 49 50 51 52 53 54 55 56 57 58 59 60
Journal
of
Analytical
Atomic
Spectrometry
Accepted
Manuscript
Published on 06 January 2016. Downloaded by National Research Council Canada on 11/01/2016 14:08:39.
View Article Online DOI: 10.1039/C5JA00444F
17
Figures of merit obtained herein were compared with those reported for 392
conventional CVG based on use of SnCl2 as the reductant.45 A 20-fold improvement in 393
the LOD is obtained when using the PVG methodology compared to conventional CVG 394
with ICP-OES detection. 395
APW samples, having salinities ranging from 55-150‰ (Table 1), were used to 396
evaluate the recovery of a 10 µg L-1 spike of Hg(II) using the proposed methodology. 397
Standard additions was used following a 10-fold dilution of the APW medium with DIW 398
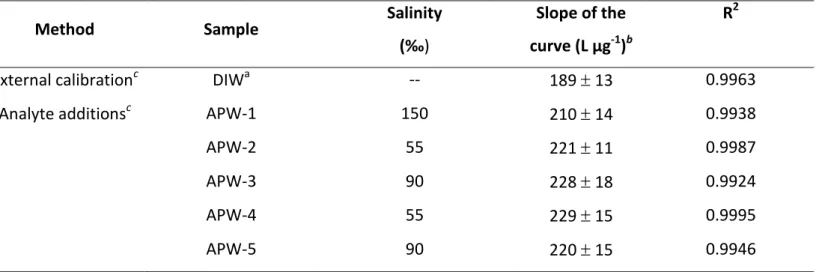
such that the impact of salinity would be minimized. Table 5 compares the slopes of 399
such standard additions curves with those generated using external calibration curves 400
prepared in a matrix-free DIW sample. It should be noted that the concentration of 401
inorganic ions present in samples APW-1, APW-2 and APW-3 were significantly higher 402
than samples APW-4 and APW-5. On the other hand, phenol was present in samples 403
APW-4 and APW-5. Slopes of the standard additions curves are similar for the various 404
APW samples tested, independent of their salinity. However, they are slight higher 405
than that for the external calibration curve, indicating that matrix interferences are 406
present and that reliable quantitation cannot be based on the latter approach. This is 407
consistent with the enhanced response noted earlier and due to elevated levels of 408
sodium chloride. 409
Results for spike recoveries, shown in Table 6, range from 78 to 113%, 410
confirming that the methodology can be satisfactorily used to determine inorganic Hg 411
in highly saline media. 412
Results for real samples of PW (similarly diluted 10-fold with DIW before 413
analysis) were quantitated against matrix matched calibration standards. For this 414
purpose, spikes were added to artificial PW (APW) solutions containing 1.62 mol L-1 415 3 4 5 6 7 8 9 10 11 12 13 14 15 16 17 18 19 20 21 22 23 24 25 26 27 28 29 30 31 32 33 34 35 36 37 38 39 40 41 42 43 44 45 46 47 48 49 50 51 52 53 54 55 56 57 58 59 60
Journal
of
Analytical
Atomic
Spectrometry
Accepted
Manuscript
Published on 06 January 2016. Downloaded by National Research Council Canada on 11/01/2016 14:08:39.
View Article Online DOI: 10.1039/C5JA00444F
18
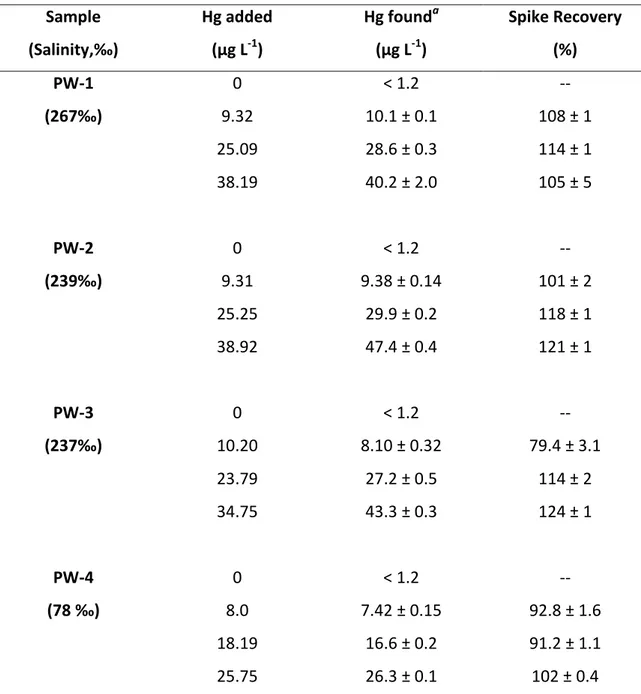
formic acid. Results are summarized in Table 7. Replicate determinations (n=3) on four 416
spiked PW samples show precision on the order of 1-4% RSD in the concentration 417
range of 8-10 µg L-1. Recovery tests were also performed to evaluate the accuracy of 418
the method whereby Hg(II) was added to 10-fold diluted PW at three levels 419
(approximately 10, 25 and 40 µg L-1). Recoveries ranging from 79 to 121% were 420
achieved. The salinity of the real samples was higher than that of the APW samples, 421
rea hi g values up to 2 ‰. 422
It is clear that artificial PW (APW) sa ples a e used to prepare e ter al 423
matrix-matched calibration curves for the analysis of real PW to permit monitoring of 424
Hg(II) in these highly saline effluents prior to their discharge into natural water bodies. 425
426
5. Conclusions
427
428
The method proposed for the determination of inorganic mercury in PW 429
samples by PVG-ICP-OES is conveniently accomplished in a medium of 1.62 mol L-1 430
formic acid at pH 1.5 using a 30 s exposure to UV radiation under continuous-flow 431
conditions. A 10-fold dilution of samples alleviates potential interferences but still 432
requires the method of additions for quantitation due to the enhancement effect of 433
NaCl on Hg response. Calibration can also be performed using a matrix matching 434
strategy employing artificial PW (APW) for preparation of standards, particularly when 435
small volumes of test samples are available. Spike recoveries in the range 79-124% 436
were obtained using this approach. 437 2 3 4 5 6 7 8 9 10 11 12 13 14 15 16 17 18 19 20 21 22 23 24 25 26 27 28 29 30 31 32 33 34 35 36 37 38 39 40 41 42 43 44 45 46 47 48 49 50 51 52 53 54 55 56 57 58 59 60
Journal
of
Analytical
Atomic
Spectrometry
Accepted
Manuscript
Published on 06 January 2016. Downloaded by National Research Council Canada on 11/01/2016 14:08:39.
View Article Online DOI: 10.1039/C5JA00444F
19
This method provides a lower procedural LOD (1.2 µg L-1) than conventional 438
CVG methodology employing AAS detection (4.1 µg L-1) wherein Hg(II) is reduced with 439
SnCl2. 440
Although there is no specific law in Brazil that requires the determination of Hg 441
in PW samples, resolution 393/2007 from CONAMA (Conselho Nacional do Meio 442
Ambiente, Brazil) requires oil companies in Brazil to undertake monitoring surveys for 443
metal concentrations in PW prior to its disposal into the ocean. The PVG-ICP-OES 444
methodology developed here can be readily employed to evaluate the concentration 445
of inorganic Hg in high salinity PW samples. 446
447
Acknowledgements 448
449
The authors gratefully acknowledge the National Research Council Canada (NRCC), 450
Coordenação de Aperfeiçoamento de Pessoal de Nivel Superior (CAPES, Brazil), 451
Fundação Carlos Chagas Filho de Apoio à Pesquisa do Estado do Rio de Janeiro (Faperj, 452
Brazil) and Conselho Nacional de Desenvolvimento Científico e Tecnológico (CNPq, 453
Brazil) for financial support and fellowships. Petrobras is thanked for supplying the 454 authentic PW samples. 455 456 References 457 458
1. National Council of Environment, Brazil (Conselho Nacional do Meio Ambiente, 459
Ministério do Meio Ambiente), Resolution 393/2007, August 8th, 2007. 460 461 3 4 5 6 7 8 9 10 11 12 13 14 15 16 17 18 19 20 21 22 23 24 25 26 27 28 29 30 31 32 33 34 35 36 37 38 39 40 41 42 43 44 45 46 47 48 49 50 51 52 53 54 55 56 57 58 59 60
Journal
of
Analytical
Atomic
Spectrometry
Accepted
Manuscript
Published on 06 January 2016. Downloaded by National Research Council Canada on 11/01/2016 14:08:39.
View Article Online DOI: 10.1039/C5JA00444F
20
2. G.T. Tellez, N. Nirmalakhandan, J.L. Gardea-Torresdey, Wat. Res. 1995, 29, 1711– 462
1718. 463
464
3. R. Shpiner, S. Vathi, D.C. Stuckey, Wat. Res. 2009, 43, 4258–4268. 465
466
4. H.S. Dórea, J.R.L. Bispo, K.A.S. Aragão, B.B. Cunha, S. Navickiene, J.P.H. Alves, L.P.C. 467
Romão, C.A.B. Garcia, Microchem. J. 2007, 85, 234–238. 468
469
5. C.W. Yeung, B.A. Law, T.G. Milligan, K. Lee, L.G. Whyte, C.W. Greer, Mar. Pollut. Bull. 470
2011, 62, 2095–2105. 471
472
6. E.P. Oliveira, L. Yang, R.E. Sturgeon, R.E. Santelli, M.A. Bezerra, S.N. Willie, R. Capilla, 473
J. Anal. At. Spectrom. 2011, 26, 578–585.
474 475
7. E.P. Oliveira, R.E. Santelli, R.J. Cassella, Anal. Chim. Acta 2005, 545, 85–91. 476
477
8. R.J. Cassella, E.P. Oliveira, O.I.B. Magalhães, Talanta 2006, 69, 48–54. 478
479
9. E.P. Oliveira, R.E. Santelli, R.J. Cassella, Microchem. J. 2008, 89, 116–122. 480
481
10. R.J. Cassella, L.G.T. Reis, E.P. Oliveira, R.E. Santelli, Talanta 2011, 85, 415–419. 482
483
11. K. Leopolda, M. Foulkes, P. Worsfold,Anal. Chim. Acta 2010, 663, 127–138.
484 485 2 3 4 5 6 7 8 9 10 11 12 13 14 15 16 17 18 19 20 21 22 23 24 25 26 27 28 29 30 31 32 33 34 35 36 37 38 39 40 41 42 43 44 45 46 47 48 49 50 51 52 53 54 55 56 57 58 59 60
Journal
of
Analytical
Atomic
Spectrometry
Accepted
Manuscript
Published on 06 January 2016. Downloaded by National Research Council Canada on 11/01/2016 14:08:39.
View Article Online DOI: 10.1039/C5JA00444F
21
12. H. Wu, Y. Jin, W. Han, Q. Miao, S. Bi, Spectrochim. Acta Part B 2006, 61, 831–840. 486
487
13. A.C.L. Dias, J.R.D. Guimarães, O. Malm, P.A.S. Costa, Cadernos Saúde Pública 2008, 488
24, 2063–2070. 489
490
14. I.L.S. Almeida, N.M.M. Coelho, Energy Fuels 2012, 26, 6003–6007. 491
492
15. A. Londonio, F. Fujiwara, R.J. Rebagliati, D. Gómez, P. Smichowski, Determination 493
of mercury in size fractionated road dust samples by flow injection-cold vapor-atomic 494
absorption spectrometry. Microchem. J. 2012, 105, 77–82. 495
496
16. H. Pyhtilä, P. Perämäki, J. Piispanen, M. Niemelä, T. Suoranta, M. Starr, T. 497
Nieminen, M. Kantola, L. Ukonmaanaho, Microchem. J. 2012, 103, 165–169. 498
499
17. A. D’Ulivo, V. Loreti, M. Onor, E. Pitzalis, R. Zamboni, Chemical vapor generation 500
atomic spectrometry using amineboranes and cyanotrihydroborate(III) reagents. Anal. 501
Chem. 2003, 75, 2591–2600.
502 503
18. T. Nakahara, Prog. Anal. At. Spectrosc. 1983, 6, 163–223. 504
505
19. M.H. Arbab-Zavar, G.H. Rounaghi, M. Chamsaz, M. Masrournia, Anal. Sci. 2003, 19, 506
743–746. 507
508
20. V.N.S. Tirtom, A. Goulding, E. Henden, Talanta 2008, 76, 1212–1217. 509 3 4 5 6 7 8 9 10 11 12 13 14 15 16 17 18 19 20 21 22 23 24 25 26 27 28 29 30 31 32 33 34 35 36 37 38 39 40 41 42 43 44 45 46 47 48 49 50 51 52 53 54 55 56 57 58 59 60
Journal
of
Analytical
Atomic
Spectrometry
Accepted
Manuscript
Published on 06 January 2016. Downloaded by National Research Council Canada on 11/01/2016 14:08:39.
View Article Online DOI: 10.1039/C5JA00444F
22 510
21. C.S. Silva, E.Q. Oreste, A.M. Nunes, M.A. Vieira, A.S. Ribeiro, J. Anal. At. Spectrom. 511
2012, 27, 689–694. 512
513
22. C. Han, C. Zheng, J. Wang, G. Cheng, Y. Lv, X. Hou, Anal. Bioanal. Chem. 2007, 38, 514
825–830. 515
516
23. J.T. Madden, N. Fitzgerald, Spectrochim. Acta Part B 2009, 64, 925–927. 517
518
24. M.A. Vieira, A.S. Ribeiro, A.J. Curtius, R.E. Sturgeon, Anal. Bioanal. Chem. 2007, 519
388, 837–847. 520
521
25. P. Grinberg, R.E. Sturgeon, J. Anal. At. Spectrom. 2009, 24, 508–514. 522
523
26. C. Zheng, Q. Ma, L. Wu, X. Hou, R.E. Sturgeon, Microchem. J. 2010, 95, 32–37. 524
525
27. Y. Yin, J. Liu, G. Jiang, Trends Anal. Chem. 2011, 30, 1672–1684. 526
527
28. Y. Yin, B. Chen, Y. Mao, T. Wang, J. Liu, Y. Cai, G. Jiang, Chemosphere 2012, 88, 8-16 528
529
29. L. Si, P.A. Aryia, Environ. Sci. Technol. 2008, 42, 5150–5155. 530
531
30. R.E. Sturgeon, P. Grinberg, J. Anal. At. Spectrom. 2012, 27, 222–231. 532 2 3 4 5 6 7 8 9 10 11 12 13 14 15 16 17 18 19 20 21 22 23 24 25 26 27 28 29 30 31 32 33 34 35 36 37 38 39 40 41 42 43 44 45 46 47 48 49 50 51 52 53 54 55 56 57 58 59 60
Journal
of
Analytical
Atomic
Spectrometry
Accepted
Manuscript
Published on 06 January 2016. Downloaded by National Research Council Canada on 11/01/2016 14:08:39.
View Article Online DOI: 10.1039/C5JA00444F
23 533
31. B. Roig, C. Gonzalez, O. Thomas, Spectrochim. Acta Part A 2003, 59, 303–307. 534
535
32. H. Zhang, Photochemical redox reactions of mercury. In: D.A. Atwood (Ed.), Recent 536
developments in mercury science. Springer Verlag, Heidelberg, Germany, 2006. 537
538
33. A.A. Rocha, N. Miekeley, C.L.P. Silveira, M.C.M. Bezerra, Quím. Nova 1998, 21, 584– 539
589. 540
541
34. T.I.R. Utvik, Chemosphere 1999, 39, 2593–2606. 542
543
35. S.F.J. Veguería, J.M. Godoy, N. Miekeley, J. Environ. Radioac.2002, 62, 29–38. 544
545
36. D.W. Woodall, N.N. Rabalais, R.P. Gambrell, R.D. Delaune, Mar. Pollut. Bull. 2003, 546
46, 731–740. 547
548
37. M. Çakmakci, N. Kayaalp, I. Koyuncu, Desalination 2008, 222, 176–186. 549
550
38. U. Pancharoen, W. Poonkum, A.L.W. Lothongkum, J. Alloy. Comp. 2009, 482, 328– 551
334. 552
553
39. S. Meier, H.C. Morton, G. Nyhammer, B.E. Grosvik, V. Makhotin, A. Geffen, S. 554
Boistsov, K.A. Kvestad, A. Bohne-Kjersem, A. Goksovr, A. Folkvrod, J. Klungsovr, A. 555
Svardal, Mar. Environ. Res. 2010, 70, 383–394. 556 3 4 5 6 7 8 9 10 11 12 13 14 15 16 17 18 19 20 21 22 23 24 25 26 27 28 29 30 31 32 33 34 35 36 37 38 39 40 41 42 43 44 45 46 47 48 49 50 51 52 53 54 55 56 57 58 59 60
Journal
of
Analytical
Atomic
Spectrometry
Accepted
Manuscript
Published on 06 January 2016. Downloaded by National Research Council Canada on 11/01/2016 14:08:39.
View Article Online DOI: 10.1039/C5JA00444F
24 557
40. I.T. Gabardo, E.B. Platte, E.F.A. Lima, F.B. Andrade, M.F.B. Carvalho, Technical 558
Report, PETROBRAS-CENPES, 24, 2005. 559
560
41. F. Akbal, N. Onar, Environ. Monitor. Assess.2003, 83, 295–302. 561
562
42. B. Roig, C. Gonzalez, O. Thomas, Spectrochim. Acta Part A 2003, 59, 303–307. 563
564
43. F. Akbal, N. Onar, Environ. Monitor. Assess. 2003, 83, 295–302. 565
566
44. X.-M. Guo, R.E. Sturgeon, Z. Mester, G.J. Gardner, Anal. Chem. 2003, 75, 2092– 567
2099. 568
569
45. F.M.B. de Mirabo, A.Ch. Thomas, E. Rubí, R. Forteza, V. Cerdà, Anal. Chim. Acta 570 1997, 355, 203–210. 571 572 2 3 4 5 6 7 8 9 10 11 12 13 14 15 16 17 18 19 20 21 22 23 24 25 26 27 28 29 30 31 32 33 34 35 36 37 38 39 40 41 42 43 44 45 46 47 48 49 50 51 52 53 54 55 56 57 58 59 60
Journal
of
Analytical
Atomic
Spectrometry
Accepted
Manuscript
Published on 06 January 2016. Downloaded by National Research Council Canada on 11/01/2016 14:08:39.
View Article Online DOI: 10.1039/C5JA00444F
25 573
Table 1. Composition of artificial production waters (APW) employed in recovery 574
experiments. 575
Substance Concentration (mg L-1)
APW-1 APW-2 APW-3 APW-4 APW-5
KCl 500 100 610 100 610 MgCl2.6H2O 660 320 390 320 390 CaCl2.2H2O 5600 840 2800 840 2800 BaCl2.2H2O 190 70 230 70 230 SrCl2.6H2O 400 200 400 200 400 FeCl3.6H2O 30 - - - - NaHCO3 - 440 950 440 950 Na2SO4 70 - 170 - 170 NaCl 91000 30000 53000 30000 53000 NaBr 150 80 - 80 - Sodium acetate 29 - - - - Phenol - - - 7 10 “ali it ‰ 150 55 90 55 90 576 3 4 5 6 7 8 9 10 11 12 13 14 15 16 17 18 19 20 21 22 23 24 25 26 27 28 29 30 31 32 33 34 35 36 37 38 39 40 41 42 43 44 45 46 47 48 49 50 51 52 53 54 55 56 57 58 59 60
Journal
of
Analytical
Atomic
Spectrometry
Accepted
Manuscript
Published on 06 January 2016. Downloaded by National Research Council Canada on 11/01/2016 14:08:39.
View Article Online DOI: 10.1039/C5JA00444F
26 577
Table 2. Experimental parameters for PVG-ICP-OES. 578
System parameters Optimized Conditions
Transfer gas flow rate (L min-1) 0.35 (acetic acid) 0.45 (formic acid) Plasma Ar gas flow rate (L min-1) 15
GLS argon flow rate (mL min-1) 100 Sample flow rate (mL min-1) 3
RF power (W) Wavelength (nm)
1300 253.652
Signal processing Peak area
ICP OES view Radial
Viewing height (mm) 15.0 Integration time (s) 100 Read time (s) 100 579 580 2 3 4 5 6 7 8 9 10 11 12 13 14 15 16 17 18 19 20 21 22 23 24 25 26 27 28 29 30 31 32 33 34 35 36 37 38 39 40 41 42 43 44 45 46 47 48 49 50 51 52 53 54 55 56 57 58 59 60
Journal
of
Analytical
Atomic
Spectrometry
Accepted
Manuscript
Published on 06 January 2016. Downloaded by National Research Council Canada on 11/01/2016 14:08:39.
View Article Online DOI: 10.1039/C5JA00444F
27
Table 3. Range of concentration of possible interferents. 581
Interferent Range of concentration tested Tolerable concentrationa Phenol 0–15 mg L-1 10 mg L-1 toluene 0–0.63 >0.063% ethanol 0–3% >3% methanol 0–32 mol/L >10%
K(I), Ba(II), Sr(II) and Mg(II) 0–75 mg L-1 >75 mg L-1
Ca(II)b 0–1250 mg L-1 500 mg L-1
Ni(II) and Sb(III)b 0–100 µg L-1 5 µg L-1 Cu(II), Pb(II), and Zn(II)
Fe(III) 0–100 µg L-1 0–100 µg L-1 >100 µg L-1 5 µg L-1 As(III)b 0–100 µg L-1 15 µg L-1 Se(IV)c 0–100 µg L-1 15 µg L-1 Cr(III) 0–100 µg L-1 25 µg L-1
NO3- 0–0.14 mol L-1 0.14 mol L-1
a Tolerable concentration before which 15% deviation of response occurs. Experiments were performed
582
with individual aqueous solutions containing interferent and Hg(II).
583
b
Enhancement of inorganic Hg signal.
584
c
Suppression of inorganic Hg signal.
585 586 587 588 589 3 4 5 6 7 8 9 10 11 12 13 14 15 16 17 18 19 20 21 22 23 24 25 26 27 28 29 30 31 32 33 34 35 36 37 38 39 40 41 42 43 44 45 46 47 48 49 50 51 52 53 54 55 56 57 58 59 60
Journal
of
Analytical
Atomic
Spectrometry
Accepted
Manuscript
Published on 06 January 2016. Downloaded by National Research Council Canada on 11/01/2016 14:08:39.
View Article Online DOI: 10.1039/C5JA00444F
28
Table 4. Figures of merit for optimized methodology. 590
Parameter Value
Typical calibration equation (µg L-1)a I = 212.3 [Hg] – 351.8
R2 0.9927
Linear range (µg L-1) up to 50 Procedural limit of detection (µg L-1) 1.2b Procedural limit of quantification (µg L-1) 4.0b
Precision (%) 9.5
a
Calibration performed in the range of 5 - 50 µg L-1.
591
b
LOD and LOQ were corrected for the 10-fold dilution of the sample and thus refer to the neat sample.
592 593 2 3 4 5 6 7 8 9 10 11 12 13 14 15 16 17 18 19 20 21 22 23 24 25 26 27 28 29 30 31 32 33 34 35 36 37 38 39 40 41 42 43 44 45 46 47 48 49 50 51 52 53 54 55 56 57 58 59 60
Journal
of
Analytical
Atomic
Spectrometry
Accepted
Manuscript
Published on 06 January 2016. Downloaded by National Research Council Canada on 11/01/2016 14:08:39.
View Article Online DOI: 10.1039/C5JA00444F
29
Table 5. Comparison of slopes of calibration curves and analyte addition curves prepared from spiked APW samples.
Method Sample Salinity
‰)
Slope of the curve (L µg-1)b
R2
External calibrationc DIWa -- 189 13 0.9963
Analyte additionsc APW-1 150 210 14 0.9938
APW-2 55 221 11 0.9987
APW-3 90 228 18 0.9924
APW-4 55 229 15 0.9995
APW-5 90 220 15 0.9946
a
In the presence of 1.62 mol L-1 formic acid
bExpressed as slope standard error. Based on 3 point-standard addition c
Constructed by addition of Hg(II) in the range of 10-50 µg L-1.in the presence of 1.62 mol L-1 formic acid. Based on 5 point calibration curve.
3 4 5 6 7 8 9 10 11 12 13 14 15 16 17 18 19 20 21 22 23 24 25 26 27 28 29 30 31 32 33 34 35 36 37 38 39 40 41 42 43 44 45 46 47 48 Journal of Analytical Atomic Spectrometry Accepted Manuscript
30
Table 6. Recovery of a 10 µg L-1 spike of Hg(II) from APW samples based on quantitation by the method of additions.
Samplea Hg added (µg L-1) Hg foundb (µg L-1) Recovery (%) APW-1 (16‰) 10.0 7.8 0.1 78 ± 1 APW-2 (15‰) 10.0 9.6 0.1 96 ± 1 APW-3 (5.5‰) 10.0 8.6 0.1 86 ± 1 APW-4 (9‰) 10.0 9.2 0.2 92 ± 2 APW-5 (15‰) 10.0 11.3 0.1 113 ± 1 a
Values in parentheses are the salinities of each APW sample.
b Expressed as mean standard deviation (n = 3).
2 3 4 5 6 7 8 9 10 11 12 13 14 15 16 17 18 19 20 21 22 23 24 25 26 27 28 29 30 31 32 33 34 35 36 37 38 39 40 41 42 43 44 45 46 47 48 49 50 51 52 53 54 55 56 57 58 59 60
Journal
of
Analytical
Atomic
Spectrometry
Accepted
Manuscript
Published on 06 January 2016. Downloaded by National Research Council Canada on 11/01/2016 14:08:39.
View Article Online DOI: 10.1039/C5JA00444F
31
Table 7. Results for the determination of inorganic mercury in samples of produced waters and spike recoveries.
Sample Salinity,‰ Hg added (µg L-1) Hg founda (µg L-1) Spike Recovery (%) PW-1 0 < 1.2 -- ‰ 9.32 10.1 ± 0.1 108 ± 1 25.09 28.6 ± 0.3 114 ± 1 38.19 40.2 ± 2.0 105 ± 5 PW-2 0 < 1.2 -- ‰ 9.31 9.38 ± 0.14 101 ± 2 25.25 29.9 ± 0.2 118 ± 1 38.92 47.4 ± 0.4 121 ± 1 PW-3 0 < 1.2 -- ‰ 10.20 8.10 ± 0.32 79.4 ± 3.1 23.79 27.2 ± 0.5 114 ± 2 34.75 43.3 ± 0.3 124 ± 1 PW-4 0 < 1.2 -- ‰ 8.0 7.42 ± 0.15 92.8 ± 1.6 18.19 16.6 ± 0.2 91.2 ± 1.1 25.75 26.3 ± 0.1 102 ± 0.4 a
Results obtained using method of additions for calibration. Mean standard deviation (n = 3) reported. 3 4 5 6 7 8 9 10 11 12 13 14 15 16 17 18 19 20 21 22 23 24 25 26 27 28 29 30 31 32 33 34 35 36 37 38 39 40 41 42 43 44 45 46 47 48 49 50 51 52 53 54 55 56 57 58 59 60
Journal
of
Analytical
Atomic
Spectrometry
Accepted
Manuscript
Published on 06 January 2016. Downloaded by National Research Council Canada on 11/01/2016 14:08:39.
View Article Online DOI: 10.1039/C5JA00444F
32
Figures and Captions
Figure. 1. Schematic of the experimental system for the determination of inorganic mercury in production waters by photochemical vapor generation coupled to ICP-OES.
Figure 2. Effect of LMW acid concentration on response from 10 µg L-1 Hg(II). Sample flow rate was 3 mL min-1. Error bars represent standard deviation of three measurements.
Figure 3. Effect of sample pH on response in continuous-flow mode of a solution containing 10 µg L-1 Hg(II). (♦) 1.63 mol L-1 formic acid; (■) 1.66 mol L-1 acetic acid. Error bars represent standard deviation of three measurements.
Figure 4. Effect of chloride concentration on PVG response from a solution containing 10 µg L-1 Hg(II) using continuous-flow mode with 3 mL min-1 sample flow rate (75 s UV irradiation) in 1.63 mol L-1 formic acid and 1.66 mol L-1 acetic acid. Error bars represent standard deviation of three measurements.
2 3 4 5 6 7 8 9 10 11 12 13 14 15 16 17 18 19 20 21 22 23 24 25 26 27 28 29 30 31 32 33 34 35 36 37 38 39 40 41 42 43 44 45 46 47 48 49 50 51 52 53 54 55 56 57 58 59 60
Journal
of
Analytical
Atomic
Spectrometry
Accepted
Manuscript
Published on 06 January 2016. Downloaded by National Research Council Canada on 11/01/2016 14:08:39.
View Article Online DOI: 10.1039/C5JA00444F
33 FIGURE 1 3 4 5 6 7 8 9 10 11 12 13 14 15 16 17 18 19 20 21 22 23 24 25 26 27 28 29 30 31 32 33 34 35 36 37 38 39 40 41 42 43 44 45 46 47 48 Journal of Analytical Atomic Spectrometry Accepted Manuscript
34 FIGURE 2 0.0 0.5 1.0 1.5 2.0 2.5 3.0 0.0 0.2 0.4 0.6 0.8 1.0 1.2 Normal ized response LMW concentration (mol L-1) Acetic acid Formic acid Propionic acid 2 3 4 5 6 7 8 9 10 11 12 13 14 15 16 17 18 19 20 21 22 23 24 25 26 27 28 29 30 31 32 33 34 35 36 37 38 39 40 41 42 43 44 45 46 47 48 49 50 51 52 53 54 55 56 57 58 59 60
Journal
of
Analytical
Atomic
Spectrometry
Accepted
Manuscript
Published on 06 January 2016. Downloaded by National Research Council Canada on 11/01/2016 14:08:39.
View Article Online DOI: 10.1039/C5JA00444F
35 FIGURE 3 0.0 1.0 2.0 3.0 4.0 5.0 6.0 7.0 8.0 9.0 0.0 0.2 0.4 0.6 0.8 1.0 1.2 Formic Acid Acetic Acid Normal ized response pH 3 4 5 6 7 8 9 10 11 12 13 14 15 16 17 18 19 20 21 22 23 24 25 26 27 28 29 30 31 32 33 34 35 36 37 38 39 40 41 42 43 44 45 46 47 48 49 50 51 52 53 54 55 56 57 58 59 60
Journal
of
Analytical
Atomic
Spectrometry
Accepted
Manuscript
Published on 06 January 2016. Downloaded by National Research Council Canada on 11/01/2016 14:08:39.
View Article Online DOI: 10.1039/C5JA00444F
36 FIGURE 4 0 20 40 60 80 100 -0.2 0.0 0.2 0.4 0.6 0.8 1.0 1.2 Normal ized response Chloride concentration (g L-1) Formic acid Acetic acid 2 3 4 5 6 7 8 9 10 11 12 13 14 15 16 17 18 19 20 21 22 23 24 25 26 27 28 29 30 31 32 33 34 35 36 37 38 39 40 41 42 43 44 45 46 47 48 49 50 51 52 53 54 55 56 57 58 59 60
Journal
of
Analytical
Atomic
Spectrometry
Accepted
Manuscript
Published on 06 January 2016. Downloaded by National Research Council Canada on 11/01/2016 14:08:39.
View Article Online DOI: 10.1039/C5JA00444F