Publisher’s version / Version de l'éditeur:
HVAC and R Research, 19, 5, pp. 557-572, 2013-07-23
READ THESE TERMS AND CONDITIONS CAREFULLY BEFORE USING THIS WEBSITE. https://nrc-publications.canada.ca/eng/copyright
Vous avez des questions? Nous pouvons vous aider. Pour communiquer directement avec un auteur, consultez la première page de la revue dans laquelle son article a été publié afin de trouver ses coordonnées. Si vous n’arrivez pas à les repérer, communiquez avec nous à [email protected].
Questions? Contact the NRC Publications Archive team at
[email protected]. If you wish to email the authors directly, please see the first page of the publication for their contact information.
NRC Publications Archive
Archives des publications du CNRC
This publication could be one of several versions: author’s original, accepted manuscript or the publisher’s version. / La version de cette publication peut être l’une des suivantes : la version prépublication de l’auteur, la version acceptée du manuscrit ou la version de l’éditeur.
For the publisher’s version, please access the DOI link below./ Pour consulter la version de l’éditeur, utilisez le lien DOI ci-dessous.
https://doi.org/10.1080/10789669.2012.741501
Access and use of this website and the material on it are subject to the Terms and Conditions set forth at
Tubular daylighting devices. Part II: validation of the optical model
(1415-RP)
Laouadi, Abdelaziz; Arsenault, Chantal; Saber, Hamed H.; Galasiu, Anca D.
https://publications-cnrc.canada.ca/fra/droits
L’accès à ce site Web et l’utilisation de son contenu sont assujettis aux conditions présentées dans le site LISEZ CES CONDITIONS ATTENTIVEMENT AVANT D’UTILISER CE SITE WEB.
NRC Publications Record / Notice d'Archives des publications de CNRC:
https://nrc-publications.canada.ca/eng/view/object/?id=13c5a45a-b5b0-42e5-aae5-93c65ceac1dc https://publications-cnrc.canada.ca/fra/voir/objet/?id=13c5a45a-b5b0-42e5-aae5-93c65ceac1dc1
Tubular daylighting devices- part II:
validation of the optical model (1415-RP)
Abdelaziz Laouadi
*, Chantal Arsenault, Hamed H. Saber, Anca D. Galasiu
*Construction Portfolio
National Research Council of Canada
1200 Montreal Road, Ottawa Ontario, K1A 0R6, Canada Tel: (613) 990 6868. Fax: (613) 954 3733
* Corresponding author. Email: [email protected]
Abstract
This paper presents the development of a methodology to measure the visible transmittance of complex configurations of tubular daylighting devices (TDD’s) under direct sunlight, and conducts a comparison study between the measurements and computer simulations using the new optical model developed in the first part of the study. A large integrating box was built and calibrated, and the procedure was benchmarked by comparing the measurement of a transparent glazing sample with the manufacturer data. Two commercially available TDD’s with prismatic and frosted elements built-in the glazing and a custom-made TDD with a complex pipe having roof and ceiling elbows were selected for the comparison study. The model predictions were overall in good agreement with the measurement for the tested TDD configurations, and the sources of discrepancies were clearly identified.
Introduction
Tubular Daylighting Devices (TDD’s) are systems that collect and channel daylight from building roofs into deep interior spaces. A typical TDD system consists of three parts: a collector located on the roof to gather sunbeam light and diffuse skylight, a hollow pipe that channels the collected light downwards, and a ceiling diffuser that spreads light indoors. The collector is usually made of single or multiple transparent plastic domes, and may include geometries or some optical devices to enhance the light output of the device, especially at low sun altitude angles. The pipe can be straight rigid, elbowed rigid, or flexible, and is typically constructed from an aluminum sheet with a highly reflective interior lining. Materials with reflectivity of 99% are commercially available. The pipe may be fully or partially insulated at the ceiling or roof level to suit a particular building type. The diffuser is hemispheric or planar with single or double translucent (opal) or clear prismatic glazing. TDD’s have been on the market for commercial and residential buildings for more than two decades. TDD manufacturers have been continuously developing new technologies to enhance, in particular, the lighting performance of TDD products. However, this fast technological development is faced with a lack of performance design tools to aid in the product energy performance ratings, proper design of TDD’s in real buildings, and compliance with building codes and energy efficiency standards.
This paper was a part of the ASHRAE research project 1415-RP: Thermal and lighting and performance metrics of tubular daylighting devices. The aim of the project was to develop detailed and validated algorithms to compute the thermal and lighting performance metrics of TDD’s. In the first part of the study (Laouadi et al., 2012a), a new optical model was developed to compute the optical characteristics (transmittance, reflectance, absorptance of each glazing pane) of various types of complex TDD’s. The aim of this second part of the study is to conduct a validation study of the optical model.
Objectives
The specific objectives of this paper are:
To develop a methodology to measure the visible transmittance of TDD’s;
To validate the new optical model, by comparing its predictions with the measurements of the selected TDD samples.
Measurement procedure of the visible transmittance
Visible (or light) transmittance (VT) of TDD’s is an important performance metric not only for the product rating purpose, but also for daylighting design of buildings. Current building energy codes and energy efficiency standards such as CEC Title 24 (CEC, 2010), and ANSI/ASHRAE/IESNA 90.1 (ASHRAE, 2004) require VT ratings of fenestration systems for code or standard compliance. Building rating tools such as LEED (USGBC, 2011) assign point credits for day-lit buildings. Current fenestration rating standards such as NFRC 200 (NFRC, 2010) and ISO 15099 (ISO, 2003) provide, however, no measurement procedure to compute VT of non-planar fenestration systems such as TDD’s.
There exist two main procedures to measure the visible transmittance of large-size TDD samples: integrating spheres and goniophotometers. The integrating sphere procedure uses a large-diameter (greater than 2 m, 76.5”) sphere and a port diameter greater than 0.23 m (9”) (ASTM, 2009). The interior surface of the sphere is coated with a highly diffuse reflective material to produce uniform radiance at any point on the sphere interior surface. A photopic light sensor is placed near the port aperture to measure the amount of the light flux getting into the sphere. Baffles are used to shade the sensor from direct light emanating from the sample. The VT is calculated as the ratio of the sensor reading when the sample is placed on the port aperture to the sensor reading when the sample is removed from the port aperture. A correction factor is introduced to account for the effect of the sample size and its light reflectance on the sensor reading. To get accurate results of VT, the sensor response should be linearly sensitive to light levels within the measurement interval, and the ratio of the port to sphere surface area should be lower than 5% (SphereOptics LLC, 2007). The ASTM E-1175 standard (ASTM, 2009) requires a maximum port ratio of 0.5% to get an accuracy of 0.003 units. McCluney (2006) derived a general formulation for the VT measurement using integrating spheres so that the sphere and its port sizes (e.g., high port ratios) may be traded-off with the sample reflectance and the measurement accuracy.
Goniophotomters are devices to measure the angular variations of light intensity (or luminance/radiance) of a light source or light-transmitting/reflecting sample. Various types of goniophotometers have been developed by the lighting industries and researchers covering conventional and digital devices (Anderson et al., 2001; Anderson et al., 2005). Conventional scanning goniophotomters use a rotating detector, or a grid of detectors deployed along the meridian lines of the emerging hemisphere centered at the sample center point. Goniophotometers have been used in lighting to measure intensity distribution of lighting fixtures, and in the measurement of bi-directional
transmittance and reflectance properties of complex glazing materials. TDD manufactures have also developed their own goniophotometers to measure the visible transmittance and intensity distribution of TDD products (Goudey et al., 2010). A common source of measurement errors in all types of the goniophotmeters is due to the angular resolution of the device (number of meridian and circumferential measurement grid points). To measure the transmittance of TDD products, the light flux emerging from the sample has to be integrated all over the grid points. Previous studies (Anderson, 2006; Apian-Bennewitz and Von der Hardt, 1998) found out that values of VT based on goniophotometers compared within 14% on average with the integrating sphere using an angular resolution of 5 x 5. Lower differences between the two devices were associated with fully diffusing samples, where a coarse angular resolution may be sufficient to capture the intensity profile, and large differences were associated with strongly scattering or redirecting samples, where a fine angular resolution is needed to capture the peak directional intensities (Andersen, 2004).
EXPERIMENTAL SETUP
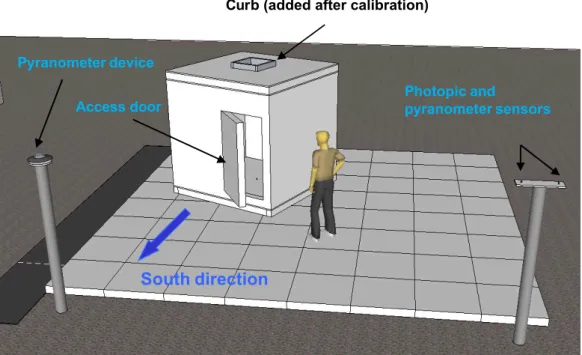
A new large cubic integrating box was designed and erected to measure the visible transmittance of TDD’s under direct sunlight. This procedure was also used by other researchers (Edmonds, 2010) to measure TDD transmittance under controlled incident light. The box measures roughly 2 m (76.5”) in height with a rough circular aperture of 0.375 m (14.75”) diameter centered at the roof surface to accommodate the sizes of the selected TDD samples. The port aperture to box surface area ratio was 0.46%. The walls of the box were made of 32 mm (5/4”) MDF (medium density fiberboard) sheets and were covered from the exterior using a white roofing membrane for water proofing. A wooden door was made in the south-facing wall to allow access to the box indoor space. A thin, 16 mm (5/8”), MDF sheet covered the ceiling surface of the box. Two beams (with height of 90 mm (3.5”) to support the roof structure were fixed to the ceiling MDF sheet at the mid distance (0.4 m (15.75”) between the edge of the aperture and the wall surface. After the box calibration, a plywood sheet, secondary beams and roofing membrane were placed on the roof surface to seal the box and prevent the ingress of rain water. Wooden curb and “chimney” were erected around the box aperture to hold the tested TDD’s. The box was placed on the roof of a three storey building, located in Ottawa (latitude = 45.32o north, and longitude = 75.67o east), Ontario, Canada.
Four photometric sensors were placed on the ceiling surface (facing downwards) along a circular ring at a mid-distance between the port opening edge and box wall surface to measure the amount of the light flux getting into the box. The signals from the four photometric sensors were averaged and used in the measurement of the sample transmittance. To check the radiance uniformity at the interior surfaces of the box, three additional photometric sensors were placed at the center points of the box surfaces (floor, west, south).
Two additional photometric and pyranometer sensors were placed on an outdoor post to measure the outdoor horizontal global illuminance and irradiance (see Figure 1). A second pyranometer device (Delta-T Devices, 2011) was placed on another outdoor post to measure the horizontal global and diffuse solar irradiances without the need of any mobile part. The device uses seven thermopile sensors and a computer-generated shading pattern so that, at any time, at least one sensor is always fully exposed to the solar beam, and at least one sensor is fully shaded from it (more details may be found at www.delta-t.co.uk)
The photometric sensors were cosine corrected up to an incidence angle of 80o, and had a sensitivity response
function within 5% of the CIE V photometric efficiency function. The outdoor pyranometer device was also calibrated by the manufacturer with a reported accuracy of 5% (or 10 W/m2).
The outdoor pyranometer sensor and device were compared against each other during the measurement. Readings from the pyranometer device were usually about 10% higher than the outdoor pyranometer sensor.
BOX PAINT SELECTION
The inside surfaces of the box were painted using a custom-made high reflectance diffuse paint. Some commercial paints with excellent properties were available, but they were either too difficult to apply, or too expensive. The selected paint coating was developed in-house using a commercially available household paint. The paint was inexpensive, easy to apply and quite resistant to water. It was selected from 33 samples that were created using water base white paint, water base primer, alkyd paint, and additives such as paint pigment, and other white powdered pigments. Paint thinners such as varsol, turpentine and water were also used to thin the paint as needed. Samples were painted on a thick white cardboard with two to three coats. The visible reflectance (both the diffuse and specular components) of each sample was measured initially using a commercial handheld reflectance meter (sensitive in the spectrum range from 360 to 740 nm). A commercial white film (sample #3 in Figure 2) was also tested. The initial measurement showed that the samples were fully diffusing (very low specular component of reflectance). Seven samples were selected for a more detailed reflectance measurement (from 250 to 2500 nm) at
the Measurement Science and Standards of the National Research Council of Canada. Figure 2 shows the spectral reflectance profiles of the selected samples. Sample #5 (magenta dashed line) was selected for the box. Reflectance measurement of the selected paint was also taken after the paint was applied on the box surfaces by pointing the handheld reflectance meter onto four points of the box wall surfaces. The reflectance profile was found to lay very close to the profile in Figure 2. The average reflectance over the spectrum range was found to be 93% and 89% for the visible and solar spectrum, respectively.
DATA ACQUISITION AND REDUCTION
The measurement sensors were connected to a data acquisition system. The data acquisition system read the sensor signals in voltage and converted them to the desired units using the sensor calibration data supplied by the manufacturers. Data acquisition of sensors was done every minute, and averaged every five minutes to obtain the targeted measurements. The measurements were taken for a whole day period, covering different sky conditions: overcast, partly cloudy and clear sunny skies. The obtained measurement data were post-processed to compute the transmittance of the tested samples using the procedure described in the following section.
TRANSMITTANCE CALCULATION
The integrating sphere measurement assumes that the radiation flux reaching any indoor sensor is linearly proportional to the radiation flux entering the sphere through the sample. The coefficient of the flux proportionality at a sensor point is a function of many factors, including the sensor position with respect to the port surface, port to sphere surface area ratio, reflectance of sphere and sample surfaces, and radiation intensity distribution emanating from the sample. Those effects will be minimized by a high diffuse reflectance surface so that inter-reflection flux density at any point on the sphere inner surface is significantly higher than the direct flux density reaching the point under consideration from the sample. Furthermore, a special characteristic of an integrating sphere is that any point on its surface will receive radiation fluxes from all other points. This is not true for the integrating box. For example, a point on a given planar wall surface does not receive any radiation flux from its wall surface. The shape of the integrating box is, therefore, an additional factor that will affect the flux proportionality coefficient.
The sample transmittance is expressed as the ratio of the radiation flux transmitted through the sample to the radiation flux incident on the sample surface. In an integrating sphere or box, the radiation flux emerging from the sample is composed of the transmitted flux and inter-reflected flux between the sphere/box and the sample inner
surfaces. It can be demonstrated that the inter-reflected flux is linearly proportional to the transmitted flux. A correction factor should thus be introduced to account for the inter-reflected flux. The sample transmittance may, thus, be expressed as follows:
(1)
where:
As : surface area of sample which receives the radiation flux (m2, ft2);
Ei : illuminance of radiation incident on the sample surface (lx, fc);
F : correction factor;
Qs : luminous flux emerging from the sample that accounts for both the transmitted and inter-reflected flux
components (lm);
Qi : luminous flux incident on the sample surface (lm);
: visible transmittance of sample.
Assuming that the sample and sphere/box surfaces are diffuse, the correction coefficient (F) may be computed by applying the radiation balance on the sample and sphere/box surfaces. It follows that (F) is given by:
(2) where:
Ab : area of sphere/box surface not including the sample (m2, ft2);
b : reflectance of sphere/box surface;
s : reflectance of sample surface.
Equation (2) is analogous to the formulation given in (McCluney, 2006; Goudey et al., 2010). For the integrating box under consideration (with a measured sample reflectance 10%), F evaluates to 0.994.
Assuming the detector response is linear, the detector signal (e.g., the average voltage from the four ceiling sensors) is proportional to the radiation flux emerging from the sample, as explained before:
(3)
where:
C : proportionality constant, to be determined (m-2, ft-2);
Ed : detector voltage signal converted to illuminance using the detector calibration constant (lx, fc).
By substituting Equation (3) in Equation (1), one obtains:
The constant (C) was calculated by calibrating the integrating box. The box was calibrated when sunbeam light was incident on the un-covered port aperture, resulting in = 1 and F = 1. Equation (4) will result in the following relation for the constant (C):
(5)
where c is the box calibration constant, and Ed,0the detector signal converted to illuminance in the absence of the
sample. Taking into account equation (5), the sample transmittance takes the following form:
(6)
BOX CALIBRATION
During the box calibration, the roof of the box had only a 16 mm (5/8”) layer of MDF sheet with the support beams in place. Although the support beams were distant enough from the edge of the aperture (0.4 m, 15.75”), their height together with the thickness of the ceiling MDF sheet will obstruct incident radiation to get directly into the box indoor space (ideally, the thickness of the MDF sheet should be very thin to minimize the incident radiation flux reaching the wall of the aperture), and therefore, significant errors may be introduced in the measurement at sun altitude angles lower than 10°. Lower measurement errors are, therefore, expected around the sunrise and sunset hours.
During the calibration phase, the port aperture was open without any cover. The average values of the ceiling sensors and the outdoor global solar radiation were recorded during sunny, partly cloudy and overcast days. The box calibration constant (c) in equation (6) was computed by plotting the average ceiling sensor signals versus the outdoor solar radiation under a clear sunny day. The measurement under partly cloudy and overcast sky conditions was used to check the variability and robustness of the computed calibration constant (c) with the luminous intensity profile of specimen. The intensity distribution of sunbeam and sky light getting into the box under partly-cloudy and overcast sky conditions may mimic the behavior of strongly scattering and fully diffusing specimen, respectively.
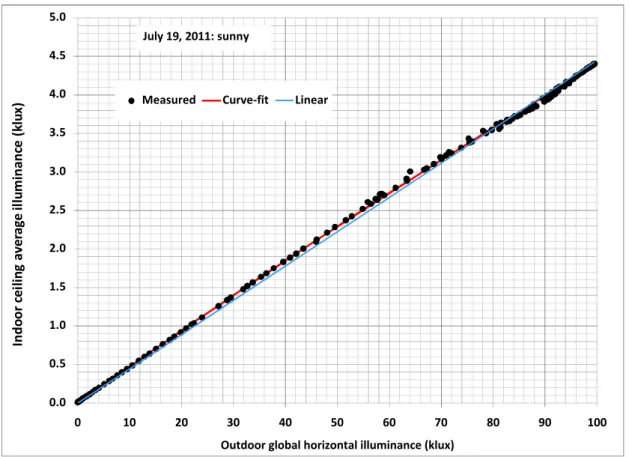
Figure 3 shows the calibration plot for the visible (photopic) sun spectrum during a sunny day in July 2011. The average of the four ceiling photometric sensors was plotted against the outdoor global illuminance as measured by the outdoor photometric sensor. The calibration profile exhibits a linear profile, but slightly changed its slope when the sunbeam light hit the floor surface of the box (outdoor illuminance > 80 klx (8 kfc)). The slope of the linear
profile (blue line) over the measurement range (up to 100 klx (10 kfc)) was very close to the curve-fitting line (red line, using a three degree polynomial function). The calibration constant (c) was found equal to 0.04488 over the measurement range.
It should be noted that under a sunny day, the readings from the four ceiling photometric sensors were almost identical, thanks to a significant contribution of the inter-reflected radiation fluxes at the box surfaces. The radiances of the box interior surfaces as indicated by their respective photometric sensors were also almost identical.
MEASUREMENT UNCERTAINTIES
The errors involved in the measurement of the TDD transmittance may be categorized into two types. The first type of errors was due to the measurement method using the integrating box, and the second type of errors was due to the sensitivities of the measurement equipment used in the integrating box procedure. The first error type may be estimated by comparing the results from the integrating box with an existing measurement standard such as the integrating sphere procedure. This error type was out of the scope of this work. However, a rough estimate of this error type may be obtained by comparing the box measurement of a benchmark sample whose transmittance is known a priori. This error was found to be about 5% (see the following section).
The second error type may be estimated using equation (6). The relative error in the transmittance measurement is expressed as follows:
(7)
By taking into account the measurement uncertainties of the photopic sensors (5%), equation (7) evaluates to a relative error of 10%.
MEASUREMENT BENCHMARKING
After establishing the box calibration, the box measurement was benchmarked by measuring the visible transmittance of a known sample. A 3 mm Lexan XL transparent sheet was chosen for this purpose. The sheet was placed on the box aperture surface. The transmittance and reflectance data at a normal incidence angle of the sheet were taken from the International Glazing Database (ID number = 3500; VT = 0.867). The research version of an in-house software tool (Laouadi and Arsenault, 2003; NRC, 2011.) was used to generate transmittance data at oblique incidence angles and time of the day.
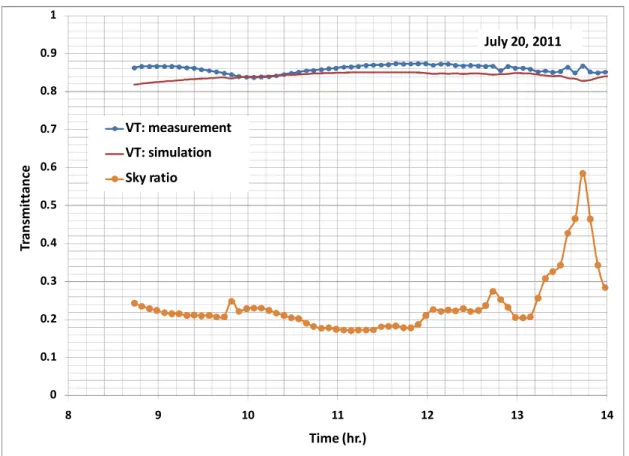
Figure 4 shows a comparison between the measurement and simulation for the global visible transmittance of the plastic sheet under a sunny day in July 2011. The simulation values of the global visible transmittance were calculated from the transmittance values for the sunbeam and sky diffuse light, and the measured ratio of diffuse to global horizontal solar irradiances (called herein sky ratio) using Equation (10). The measurements compared very well with the simulations, within a 5% deviation.
TRANSMITTANCE MEASUREMENT OF TDD CEILING DIFFUSERS
After the box calibration and benchmarking, two TDD ceiling diffusers were mounted on the box aperture to measure their visible transmittance profile. The VT angular profiles of the TDD diffusers were not supplied by the manufacturers, but they were needed to perform VT simulations for the complete TDD systems. Both TDD diffusers were made of double diffusive glazing.
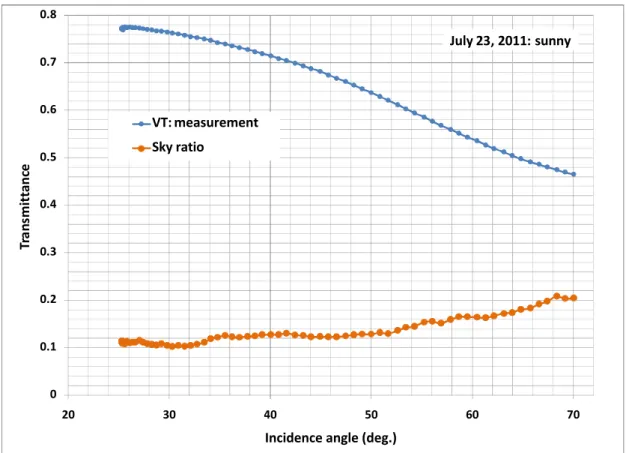
Figure 5 shows the VT angular profile of the ceiling diffuser of the TDD product A under clear sky conditions. Curve fitting of the measurement data produced the following equation:
(8)
where is the incidence angle of the diffuser surface.
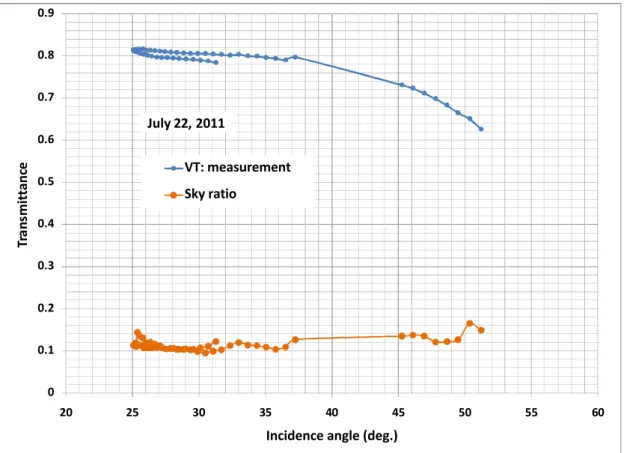
Figure 6 shows the VT angular profile of the ceiling diffuser of the TDD product B under clear sky conditions. Curve fitting of the measurement data produced the following equation:
(9)
Equations (8) and (9) were implemented in the in-house software tool (NRC, 2011). Although equations (8) and (9) were derived for the measurement angular range (25° < < 70°), their extension to the complete range from 0° to 90° resulted in overall good approximations for the VT (more details may be found in Laouadi et al., 2012b). Selected TDD specimen
After the box calibration and benchmarking tests, wooden curb and vertical “chimney” were made around the box aperture to hold the selected TDD products. The pipes of the TDD’s were inserted in the wooden “chimney” and connected to their collectors and ceiling diffusers according to the manufacturer installation guide. Manufacturer specific flashing rings were placed on the opening surface of the “chimney” and connected to the TDD collectors. The ceiling diffusers were themselves connected to the ceiling MDF sheet using the supplied plastic
ring and screws according to manufacturer specification. The surface of the plastic ring was painted with the same paint of the box.
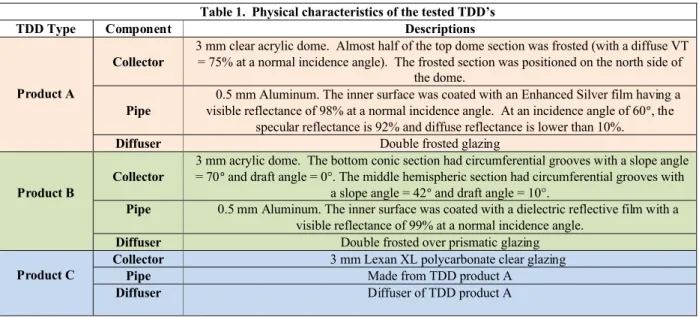
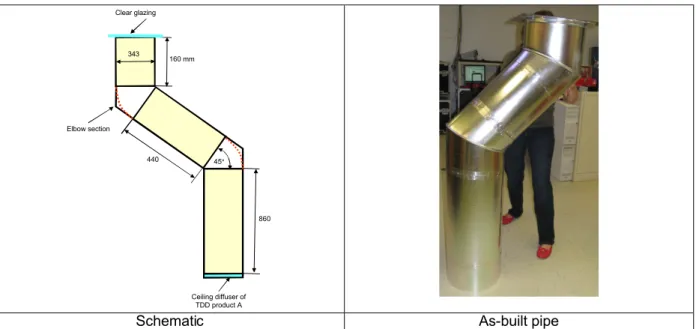
Two commercially available TDD products (A, B) were selected for the measurement. Both TDD products had complex domed collectors with prismatic or frosted elements built-in the single glazing. The same TDD products were also tested with a planar collector to isolate any effect of a complex collector on the TDD transmittance. The Lexan XL polycarbonate clear glazing (used in the benchmark tests) was used for the planar collector. A custom complex TDD product (C) with an elbowed pipe and planar collector was made in-house from the components of the TDD product A, and tested to show the effect of pipe elbows on the TDD transmittance. The lower section of the elbowed pipe was inserted in the wooden “chimney”, while the middle and upper sections were secured to the “chimney” flashing ring using tape. The middle pipe section was oriented towards the south, north and west directions. Table 1 summarizes the physical characteristics of the tested TDD’s, and Figures 7 and 8 show their geometrical details, and Figure 9 shows snapshots of as-installed TDD’s.
Computer simulation
Prediction of the visible transmittance of the tested TDD’s used a new optical model, which was presented in the first part of the study (Laouadi et al., 2012a). The new model was based on the ray tracing technique to compute the spectral or broad-band optical characteristics (transmittance, reflectance and glazing layer absorptances) of various types of complex TDD’s, featuring multi-pane collectors with hemispheric and conical shapes and embedded local optical structures (prisms, reflectors, diffusing elements, etc.), pipes with roof and ceiling elbows, and hemispheric ceiling diffusers with multiple complex panes (prismatic, or diffusing). The following assumptions were made in the computer simulations:
ASSUMPTIONS
Prismatic elements incorporated in a TDD system were made with ideal prisms with sharp edges (round edges due to manufacturing were not accounted for)
The optical properties at oblique incidence angles of clear glazing sheets making up a TDD system were calculated using the customary laws of optics, and the supplied optical properties at normal incidence angles (taken from the International Glazing Database). The optical algorithms for a planar glazing assembly by
Laouadi and Parekh (2007) were used to compute the optical characteristic of the glazing assembly at any local point on a TDD surface.
Frosted glazing sections of TDD collectors were modeled as clear glazing, but with a transmittance haze of 100% (fully diffusing).
The reflectance values of the TDD pipes were taken as constant inputs from the manufacturer data (angular dependency was not accounted for).
The transmittance values of the TDD ceiling diffusers were taken from the measurement results (see Figures 5 and 6) and extended beyond the measurement ranges using Equations (8) and (9). Significant errors in the TDD transmittance at low sun altitude angles (beyond the measurement range) were, therefore, expected.
In addition to the foregoing assumptions, errors were also introduced in the calculation of the overall transmittance of a TDD system due to the numerical integration over the collector surface. The numerical errors would be even higher for a complex collector incorporating a mixture of glazing types (such as plain/prismatic, or plain/frosted, etc.). The present work used a 10 point Gauss integration method. The TDD collector surface was roughly divided into a number of sub surfaces with homogenous glazing (e.g., four circumferential x three meridian sections were used for the TDD product A, and nine meridian sections were used for the TDD product B).
METHODOLOGY
The new optical model of TDD’s was implemented in the research version of the in-house software tool (NRC, 2011). The tool computes the angular and hourly profiles of the overall optical characteristics (transmittance and layer absorptances) of TDD glazing components and assemblies based on the optical properties of the glazing sheets making up the TDD assemblies. For the hourly profiles, the tool calculated, at each time step of a given day of the year, the optical characteristics of TDD’s for the sunbeam and sky diffuse light. The diffuse optical characteristics of TDD’s for the diffuse sky light were calculated based on the sky luminance distribution pattern. Perez et al. (1993) model was used to deduce the sky luminance patterns based on the sub-hourly weather data (global and diffuse solar radiation, and the outdoor dry bulb and dew point temperatures) at the measurement location. The solar radiation data were measured onsite using the pyranometer device, whereas the outdoor dry bulb and dew point temperatures were measured by Environment Canada at a distant location in the same city.
CALCULATION OF TDD TRANSMITTANCE
TDD visible transmittance (VT) is defined as the ratio of the luminous flux emerging from the TDD ceiling diffuser to the luminous flux incident on an outdoor horizontal surface with a surface area equal to the inner cross-section surface area of the TDD pipe (Laouadi et al., 2012a). Under real sky conditions, the solar radiation incident on the TDD surface is composed of the sunbeam light and diffuse skylight. The VT for the global light (beam + diffuse) was, therefore, calculated as follows:
(10) where:
Esd : outdoor horizontal illuminance from the sky diffuse light, measured (lx, fc);
Egl : outdoor horizontal global illuminance from the combined sunbeam and sky diffuse light, measured (lx, fc);
VTsb : visible transmittance for the sunbeam light at a given sun’s altitude angle (simulated);
VTsd : visible transmittance for the sky diffuse light (simulated);
VTgl : visible transmittance for the global sunbeam and sky diffuse light (simulated).
Equation (10) was used to compare the aforementioned box measurement results with the computer simulations.
Model validation results
Computer simulations were performed for the tested TDD’s, and the results were compared with the measurements. The following results were obtained.
PRODUCT A
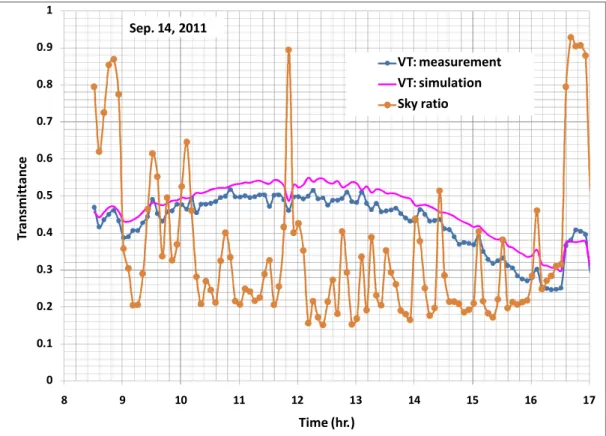
Figures 10 and 11 show a comparison between of the measured and simulated visible transmittance for the TDD product A with planar and domed collector, respectively. The hourly profile (in standard time) of the sky ratio (ratio of the diffuse to global solar irradiances) was also plotted in the graphs to indicate the sky conditions (clear sky conditions correspond to a sky ratio < 0.3). For the TDD product with the planar collector, the predictions compared very well with the measurements, within an average deviation of 10% (from 9:00 to 17:00). As expected, lower errors occurred at high sun altitude angles around noontime (9:00 to 15:00), and higher errors occurred at low sun altitude angles. The large errors at low sun altitude angles were more likely due to the transmittance overestimation of the TDD ceiling diffuser using equation (8), cosine sensitivities of the measurement sensors and box calibration errors. Furthermore, the pipe reflectance may have varied with the incidence angle (see Table 1) during the measurement, but was assumed constant in the simulation.
Similarly, the predictions for the TDD product with the domed collector (Figure 11) compared overall well with the measurements, within an average deviation of 10% (from 8:00 to 17:00), given the uncertainty in measurements as mentioned before. It should be noted that the measured VT profile was not symmetrical around the solar noontime. This suggests that the frosted dome section was not truly oriented towards the north direction, and/or the TDD was not in an ideal vertical position. Positioning a TDD a few degrees from the vertical will indeed affect the hourly profile of its transmittance. Similar to Figure 10, the predictions were higher than the measurement. This suggests that the pipe reflectance varied with the incidence angle during the measurement.
PRODUCT B
Figures 12 and 13 show a comparison between of the measured and simulated visible transmittance for the TDD product B with a planar and domed collector, respectively. For the TDD product with the planar collector (Figure 12), the predictions compared very well with the measurements, within an average deviation of 6% (from 9:00 to 15:00). For the TDD product with the domed prismatic collector (Figure 13), the predictions compared overall well with the measurement, within an average deviation of 10% (from 7:00 to 17:00), and a maximum deviation of 24%. The maximum errors occurred around an incidence angle of 47°. This large difference could be attributed to the effect of the non-ideal prismatic glazing of the actual collector and probability of dust accumulation in the prismatic grooves. TDD product B incorporates two different prismatic elements in the collector glazing to increase the lighting power at low sun altitude angles. As-built prismatic elements could have rounded edges, and, therefore, their effect to increase the lighting power is reduced. Furthermore, the non symmetrical profile of VT around the solar noontime suggests that the prismatic elements were not uniform around the circumference due to the manufacturing process, or the TDD was not in an ideal vertical position.
PRODUCT C
Figures 14 to 16 show a comparison between of the measured and simulated visible transmittance for the TDD product C with an elbowed pipe with the tilted middle pipe section (the upper and lower pipe sections were vertical) facing the south, north and west direction, respectively. For the south facing pipe configuration (Figure 14), the predictions compared well with the measurement, within an average deviation of 11% (from 11:00 to 17:00), and a maximum deviation of 30%. The maximum errors occurred around an incidence angle of 64° (around 15:00). This large difference could be attributed to the effect of the shape of the elbow section. The elbow section of the
custom-made TDD was custom-made by joining the pipe sections together (see Figure 8). The simulations, however, used a smooth elbow section, section of a “horn” torus (see the red dotted line in Figure 8; More details may be found in Laouadi et al., 2012a). Smooth elbow surfaces redirect better the incident radiation than discrete elbow surfaces, and, therefore, result in higher transmittance.
For the north facing pipe configuration (Figure 15), the predictions followed the same trend as the measurements, but were higher, within an average deviation of 21% (from 8:00 to 16:00), and a maximum deviation of 30%. The maximum deviation occurred around noon solar time. This large difference was again attributed to the effect of the shape of the elbow section, as explained before in Figure 15. For example, when the sun was at noontime, the smooth elbow surface (used in the simulation) may result in a lower number of ray reflections at the pipe surface than the actual discrete elbow surface (see the illustration in Figure 15). Under certain incidence angles, a discrete elbow surface may even reject incident rays back to the pipe entrance whereas a smooth elbow surface redirects them downwards to the pipe exit surface. It should be noted that the measurements were not symmetrical around the solar noontime due to the fact that the upper pipe section was not in an ideal vertical position. The upper pipe was weakly supported to the box structure, and a few degrees off the vertical line were found.
For the west facing pipe configuration (Figure 16), the predictions compared overall well with the measurements, within an average deviation of 14% (from 8:00 to 16:00), and a maximum deviation of 24%. The maximum deviation occurred in the morning (around 9:30) and afternoon hours (around 14:00) when the sun was high in the sky and facing the elbow surface. At those sun positions, the simulations resulted in a significantly higher transmittance than the measurement due to the effect of the simulated elbow shape, as was explained before in Figure 15.
In view of the results of Figures 14 to 16, orienting a complex pipe with roof/ceiling elbows towards the north direction (middle section pipe facing north) will result in a significantly higher transmittance than other orientations. Furthermore, the use of a smooth elbow surface such as a section of a horn torus surface will boost the transmittance. However, the magnitude of the transmittance increase due to the pipe orientation will depend on the dimensions of the pipe sections. The use of computerized algorithms will then help to design an optimized TDD configuration suitable for a given application.
This paper presented a methodology to measure the visible transmittance of several complex configurations of TDD’s, and conducted a comparison study between the measurements and computer simulations using the newly developed optical model, which was presented in the first part of the study (Laouadi et al., 2012a).
An integrating cubic box of 2 m (76.5”) height was built and calibrated to measure the visible transmittance of TDD’s under direct sunlight. Four photometric sensors were placed on the box ceiling surface (facing downwards) and their readings were averaged and used to compute the transmittance of the selected TDD specimen. The outdoor global and diffuse solar radiation was also measured on site. The integrating box procedure was benchmarked by comparing its measurement with the manufacturer data of a transparent glazing sample. The results compared within a 5% deviation. Two commercially available TDD products were selected for the measurement. Both TDD products had complex domed collectors with prismatic and frosted elements built-in the glazing. The same TDD products were also tested with planar single glazed collectors. A complex TDD with two roof/ceiling elbows and a planar collector was made in-house from the components of one of the TDD products, and tested for three pipe orientations (the middle pipe faced the south, north, and west direction; the upper and lower pipe sections were vertical). The predictions of the visible transmittance using the newly developed optical model were in good agreement with the measurement within the measurement error of 10% for the TDD’s with planar collectors. For the TDD’s with complex domed collectors, the predictions were also in good agreement with the measurement, within an average deviation of 10%, and a maximum deviation of 24%, particularly for the TDD with a prismatic collector. This large difference was more likely due to the non-ideal (as-manufactured) prismatic elements of the actual TDD collector (simulations used ideal prismatic glazing with sharp prism edges). The actual TDD prisms might have rounded edges, and probability of dust accumulation in the groove spaces. The simulations results for the custom-made TDD with an elbowed pipe were in an overall good agreement with the measurement, with an average deviation of 14%, particularly for the south and west-facing pipe configurations, and a maximum deviation of 30% for the north facing configuration. This large difference between the simulation and measurement was found when sunbeam light directly reached the elbow surface, and was attributed to the shape effect of the as-build elbow sections. The elbow sections of the custom-made TDD was made by joining the pipe sections together (two discrete pipe sections), whereas the simulations used a smooth elbow section, a section of a “horn” torus. Smooth elbow surfaces redirect better the incident rays than discrete elbow surfaces, and, therefore, result in higher transmittance. In view of such results, orienting the middle pipe section of a TDD with roof/ceiling elbows towards
the north direction will result in a significantly higher transmittance than other orientations. Furthermore, the use of a smooth elbow surface such as a section of a “horn” torus surface will further increase the transmittance. However, the magnitude of the transmittance increase due to the pipe orientation will depend on the dimensions of the pipe sections. The use of computerized algorithms will then help to design an optimized TDD configuration suitable for a given application.
Acknowledgement
This work was jointly funded by ASHRAE under the Research Project 1415-RP, and the Construction Portfolio of the National Research Council of Canada. The authors were very thankful for their financial support. The authors would also like to thank Solatube International Inc., VELUX America Inc., and ODL Inc. for their in-kind support to the project
References
Andersen M., Michel L., Roecker C., and Scartezzini J.-L. 2001. Experimental assessment of bi-directional transmission distribution functions using digital imaging techniques. Energy and Buildings, 33(5):417–431. Andersen M. 2004. Innovative Bidirectional video-goniophotometer for advanced fenestration systems. Ph.D.
Thesis. Ecole polytechnique federale de Lausanne. Switzerland.
Andersen M., Roecker C., and Scartezzini J.-L. 2005. Design of a time-efficient video-goniophotometer combining bidirectional functions assessment in transmission and reflection. Solar Energy Materials and Solar Cells, 88(1):97–118.
Andersen M. 2006. Validation of the performance of a new bidirectional video-goniophotometer. Lighting Research and Technology, 38 (4); 295-313.
Apian-Bennewitz P., Von Der Hardt J. 1998. Enhancing and calibrating a goniophotometer. Solar Energy Materials and Solar Cells, 54(1-4):309–322.
ASHRAE. 2004. ANSI/ASHRAE/IESNA Standard 90.1-2004: Energy Standard for buildings except low-rise residential buildings. American Society for Heating, Refrigerating, and Air-conditioning Engineers. Atlanta. ASTM. 2009. ASTM E1175 - 87(2009) Standard Test Method for Determining Solar or Photopic Reflectance,
Transmittance, and Absorptance of Materials Using a Large Diameter Integrating Sphere. American Society for Testing and Materials, Philadelphia, Pa, www.astm.org.
California Energy Commission (CEC). 2010. 2008 Building Energy Efficiency Standards for Residential and Nonresidential Buildings, California Code of Regulations, Title 24, Part 6. Author. www.energy.ca.gov/title24. Delta-T Devices. 2011. SPN1 - Sunshine Pyranometer. Cambridge, UK.
Edmonds I. 2010. Transmission of mirror light pipes with triangular, rectangular, rhombic and hexagonal cross section. Solar Energy, 84(6): 928-938.
Goudey H., Kohler C., Rubin M. 2010. Complex product visible transmittance research, Tubular Daylighting Devices. NFRC project 05-105-DR4, Lawrence Berkeley National Laboratory.
ISO. 2003. Standard 15099: Thermal performance of windows, doors and shading devices - detailed calculations. International Standard Organisation; Geneva: Switzerland.
Laouadi, A., Arsenault, C.D. 2003. Validation of skylight performance assessment software. ASHRAE Transactions, 112(Pt. 2); 1-13.
Laouadi A., Parekh A. 2007. Optical models of complex fenestration systems, Lighting Research and Technology, 39(2); 123-145.
Laouadi A., Galasiu A.D., Saber H.H., Arsenault C. 2012a. Tubular daylighting devices- Part I: Development of an optical model. Submitted to HVAC&R Research Journal.
Laouadi A., Saber H.H., Arsenault C., Galasiu A.D. 2012b. Thermal and lighting performance metrics of tubular daylighting devices: Validation of the optical and thermal models. Report B3251.4, National Research Council of Canada, Ottawa, Ontario.
McCluney R. 2006. Ratio of port size to integrating sphere diameter. Background Paper. National Fenestration Rating Council. Silver Spring, MD.
NFRC. 2010. NFRC 200: 2010- Procedures for Determining Fenestration Product Solar Heat Gain Coefficients, and Visible Transmittance at Normal Incidence. Greenbelt, MD.
NRC. 2011. SkyVision v1.2.1 National Research Council of Canada. Available for free download from: http://www.nrc-cnrc.gc.ca/eng/projects/irc/optical-characteristics.html/[Accessed September 2011].
Perez R., Seals R., and Michalsky J. 1993. All-Weather Model for Sky Luminance Distribution – Preliminary Configuration and Validation. Solar Energy, 50(3): 235-245.
SphereOptics LLC. 2007. Integrating sphere design and applications. URL: www.sphereoptics.com. Accessed in May 2011.
USGBC. 2011. LEED Green Building Certification System. U.S. Green Building Council. Washington DC. www.usgbc.org. Accessed in September 2011.
Table 1. Physical characteristics of the tested TDD’s
TDD Type Component Descriptions
Product A
Collector
3 mm clear acrylic dome. Almost half of the top dome section was frosted (with a diffuse VT = 75% at a normal incidence angle). The frosted section was positioned on the north side of
the dome.
Pipe
0.5 mm Aluminum. The inner surface was coated with an Enhanced Silver film having a visible reflectance of 98% at a normal incidence angle. At an incidence angle of 60°, the
specular reflectance is 92% and diffuse reflectance is lower than 10%.
Diffuser Double frosted glazing
Product B
Collector
3 mm acrylic dome. The bottom conic section had circumferential grooves with a slope angle = 70° and draft angle = 0°. The middle hemispheric section had circumferential grooves with
a slope angle = 42° and draft angle = 10°.
Pipe 0.5 mm Aluminum. The inner surface was coated with a dielectric reflective film with a visible reflectance of 99% at a normal incidence angle.
Diffuser Double frosted over prismatic glazing
Product C
Collector 3 mm Lexan XL polycarbonate clear glazing
Pipe Made from TDD product A
Curb (added after calibration) Photopic and pyranometer sensors Access door Pyranometer device
South direction
0% 10% 20% 30% 40% 50% 60% 70% 80% 90% 100% 250 500 750 1000 1250 1500 1750 2000 2250 2500 Re fle ct an ce Wave length (nm) sample #1 sample #2
sample #3 (white film) sample #4
sample #5 sample #6 sample #7
0.0 0.5 1.0 1.5 2.0 2.5 3.0 3.5 4.0 4.5 5.0 0 10 20 30 40 50 60 70 80 90 100 In do or c ei lin g av er ag e ill um in an ce (k lu x)
Outdoor global horizontal illuminance (klux) Measured Curve-fit Linear
July 19, 2011: sunny
0 0.1 0.2 0.3 0.4 0.5 0.6 0.7 0.8 0.9 1 8 9 10 11 12 13 14 Tr an sm itt an ce Time (hr.) VT: measurement VT: simulation Sky ratio July 20, 2011
Figure 4. Measured and simulated profiles of the global visible transmittance of the benchmark glazing sample under a sunny day
0 0.1 0.2 0.3 0.4 0.5 0.6 0.7 0.8 20 30 40 50 60 70 Tr an sm itt an ce
Incidence angle (deg.) VT: measurement
Sky ratio
July 23, 2011: sunny
0 0.1 0.2 0.3 0.4 0.5 0.6 0.7 0.8 0.9 20 25 30 35 40 45 50 55 60 Tr an sm itt an ce
Incidence angle (deg.) VT: measurement
Sky ratio July 22, 2011
343 10 9 10 0 0 m m 22 acrylic dome Ceiling double frosted diffuser 49 frosted 13 2 10 00 m m 337 33 acrylic dome
Ceiling double diffuser
prismatic
62
1
7
TDD product A TDD product B
160 mm 440 860 45° 343 Clear glazing Ceiling diffuser of TDD product A Elbow section
Schematic As-built pipe
Figure 8 Geometrical details of the custom-made TDD product C with an elbowed pipe (tilted middle section and vertical upper and lower sections)
Commercial TDD Custom-made TDD
0 0.1 0.2 0.3 0.4 0.5 0.6 0.7 0.8 0.9 1 8 9 10 11 12 13 14 15 16 17 Tr an sm itt an ce Time (hr.) VT: measurement VT: simulation Sky ratio Sep. 14, 2011
Figure 10 Hourly profiles of the measured and simulated visible transmittance of TDD product A with the planar collector.
0 0.1 0.2 0.3 0.4 0.5 0.6 0.7 6 8 10 12 14 16 18 Tr an sm itt an ce Time (hr.) VT: measurement VT: simulation Sky ratio Sep. 10, 2011
Figure 11 Hourly profiles of the measured and simulated visible transmittance of TDD product A with the domed collector.
0 0.1 0.2 0.3 0.4 0.5 0.6 0.7 0.8 0.9 1 8 9 10 11 12 13 14 15 Tr an sm itt an ce Time (hr.) VT: measurement VT: simulation Sky ratio Aug. 26, 2011
Figure 12 Hourly profiles of the measured and simulated visible transmittance of TDD product B with the planar collector.
0 0.1 0.2 0.3 0.4 0.5 0.6 0.7 0.8 0.9 1 6 8 10 12 14 16 18 Tr an sm itt an ce Time (hr.) VT: measurement VT: simulation Sky ratio Sep. 18, 2011
Figure 13 Hourly profiles of the measured and simulated visible transmittance of TDD product B with the domed collector.
0 0.1 0.2 0.3 0.4 0.5 0.6 0.7 0.8 0.9 1 10 11 12 13 14 15 16 17 18 Tr an sm itt an ce Time (hr.)
VT: measurement VT: simulation Sky ratio
Sep. 26, 2011: South-facing pipe
Figure 14 Hourly profiles of the measured and simulated visible transmittance of TDD product C with the elbowed pipe facing the south direction.
0 0.1 0.2 0.3 0.4 0.5 0.6 0.7 0.8 0.9 1 6 8 10 12 14 16 18 Tr an sm itt an ce Time (hr.)
VT: measurement VT: simulation Sky ratio
Oct. 5, 2011: North-facing pipe
Reflection from a smooth elbow
Reflection from a discrete elbow
Figure 15 Hourly profiles of the measured and simulated visible transmittance of TDD product C with the elbowed pipe facing the north direction.
0 0.1 0.2 0.3 0.4 0.5 0.6 0.7 0.8 0.9 1 6 8 10 12 14 16 18 Tr an sm itt an ce Time (hr.)
VT: measurement VT: simulation Sky ratio
Oct. 6, 2011: West-facing pipe
Figure 16 Hourly profiles of the measured and simulated visible transmittance of TDD product C with the elbowed pipe facing the west direction.