Publisher’s version / Version de l'éditeur:
Vous avez des questions? Nous pouvons vous aider. Pour communiquer directement avec un auteur, consultez la première page de la revue dans laquelle son article a été publié afin de trouver ses coordonnées. Si vous n’arrivez Questions? Contact the NRC Publications Archive team at
PublicationsArchive-ArchivesPublications@nrc-cnrc.gc.ca. If you wish to email the authors directly, please see the first page of the publication for their contact information.
https://publications-cnrc.canada.ca/fra/droits
L’accès à ce site Web et l’utilisation de son contenu sont assujettis aux conditions présentées dans le site LISEZ CES CONDITIONS ATTENTIVEMENT AVANT D’UTILISER CE SITE WEB.
Client Report (National Research Council of Canada. Construction), 2018-06-15
READ THESE TERMS AND CONDITIONS CAREFULLY BEFORE USING THIS WEBSITE. https://nrc-publications.canada.ca/eng/copyright
NRC Publications Archive Record / Notice des Archives des publications du CNRC :
https://nrc-publications.canada.ca/eng/view/object/?id=d83bf020-3ae4-4ee8-8d06-af0f49d9eedb https://publications-cnrc.canada.ca/fra/voir/objet/?id=d83bf020-3ae4-4ee8-8d06-af0f49d9eedb
NRC Publications Archive
Archives des publications du CNRC
For the publisher’s version, please access the DOI link below./ Pour consulter la version de l’éditeur, utilisez le lien DOI ci-dessous.
https://doi.org/10.4224/40001234
Access and use of this website and the material on it are subject to the Terms and Conditions set forth at
Climate resilience of buildings: overheating in buildings ― literature
review
Climate Resilience of Buildings:
Overheating in Buildings
―
Literature Review
A. Laouadi, A. Gaur, and M. Bartko
Report: CRBCPI-Y2-R14
15-June-2018
Climate Resilience of Buildings:
Overheating in Buildings — Literature Review
Author
A. Laouadi, Sub-task manager
Authors:
A. Gaur, and M. BartkoApproved
Ms. Marianne Armstrong
Project Manager, CRBCPI Project
Approved
Dr. Phillipe Rizcallah, P. Eng.
Program Leader, Building Regulations for Market Access
Client Report: CRBCPI-Y2-R14
Report Date:
15 June, 2018
Contract No:
A1-012020-05
Reference:
29 November 2016
Program:
Building Regulations for Market Access
88 pages Copy no. 1 of 5
This report may not be reproduced in whole or in part without the written consent of the National Research Council Canada and the Client.
Table of Contents
1. Introduction ... 8
2. About the overheating project ... 11
3. Effect of heat on the human health ... 12
3.1 Physiological response to heat ... 12
3.2 Acclimatisation and adaptation ... 13
3.3 Heat related illnesses ... 14
4. Climate change effects ... 14
4.1 Climate modelling approaches ... 15
4.2 Climate change in Canada – historical observations ... 16
4.3 Climate change in Canada – projected temperatures ... 17
4.4 Planned approaches for generating future climate data ... 19
4.4.1 Acquisition of downscaled climatic data from ECCC ... 19
4.4.2 Extraction of climate projections for different global warming thresholds ... 19
4.4.3 Additional pre-processing steps ... 22
4.4.4 Reference year selection ... 22
5. Extreme heat events (EHE) ... 25
5.1 Definition ... 25
5.2 Health impact of EHE ... 29
5.2.1 Mortality ... 30
5.2.2 Morbidity ... 34
6. Risk factors for EHE-related health ... 34
6.1 Vulnerable people ... 34
6.2 Environment factors ... 36
6.3 Community factors ... 36
6.4 Built environment factors ... 38
7.1 Thermal comfort metrics ... 40
7.2 Physiological metrics ... 41
7.3 Meteorological-based metrics ... 46
7.4 Epidemiological metrics ... 48
8. Overheating in buildings... 51
8.1 Field measurement studies ... 51
8.2 Computer simulation studies ... 54
8.3 Adaptation measures ... 56
8.4 Reference summer weather year for estimating the risk to overheating ... 58
8.5 Definition of overheating ... 60
8.5.1 CIBSE overheating criteria ... 61
8.5.2 DfES overheating criteria ... 62
8.5.3 ZCH criteria ... 62
8.5.4 Passive House Institute criteria ... 63
8.5.5 USGBC criteria ... 63
9. Conclusions ... 63
10. Acknowledgements ... 66
List of Figures
Figure 1. Time-series of projected changes in annual mean temperatures in Canada. The changes were calculated with reference to a baseline time-period of 1986-2005 (Source:
http://climate-scenarios.canada.ca/index.php?page=download-cmip5) ... 18 Figure 2. Median changes in average temperatures projected for cases: a) 2050s & RCP 2.6, b) 2050s and RCP 8.5, c) 2090s & RCP 2.6, and d) 2090s & RCP 8.5. Future timelines: 2050s and 2090s
represent time-periods: 2046-2065 and 2081-2100 respectively. The changes have been calculated with reference to the baseline historical time-period of 1986-2005 (Source:
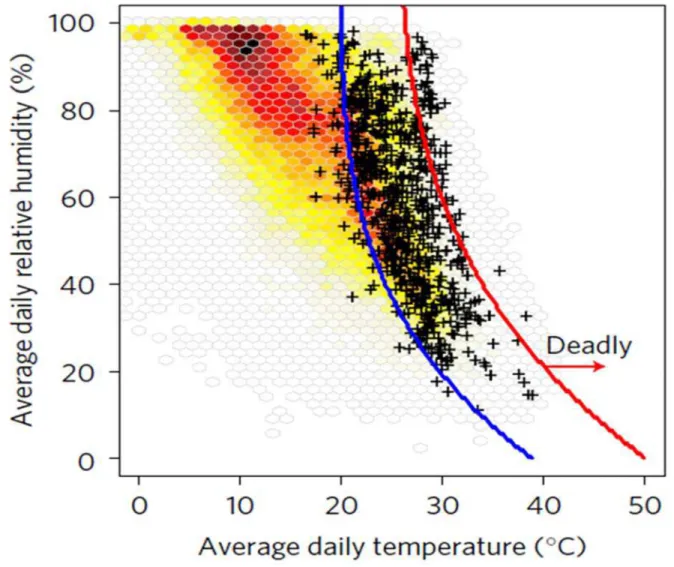
http://climate-scenarios.canada.ca/index.php?page=download-cmip5). ... 21 Figure 3. Temperature distribution of climate (30 year period) and extreme heat events ... 28 Figure 4. Non-traumatic mortality-temperature profiles during the summer seasons (June-August) of 1986-2005 for selected Canadian cities (Source: Casati et al., 2013) ... 28 Figure 5. Thresholds of the mean daily air temperature and relative humidity during lethal heat events (black crosses) and during non-lethal heat events (red to yellow dots). Blue line is the threshold that best separates lethal and non-lethal heat events, and the red line is the 95% probability threshold; Areas to the right of the thresholds are classified as deadly and those to the left as non-deadly (Source: Ma et al., 2017). ... 32
List of Tables
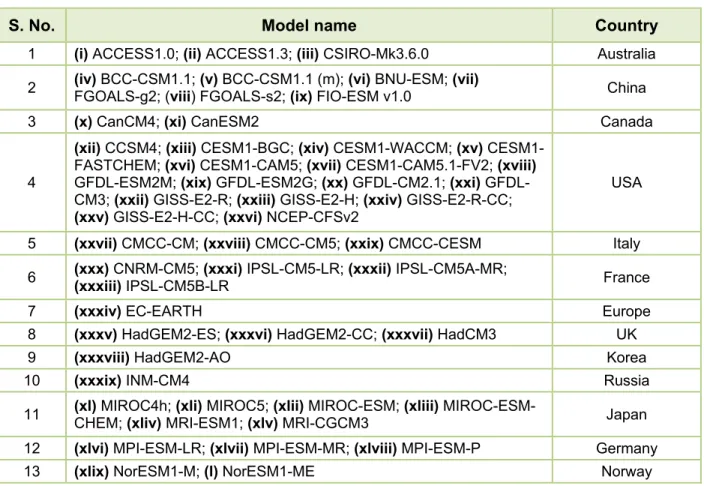
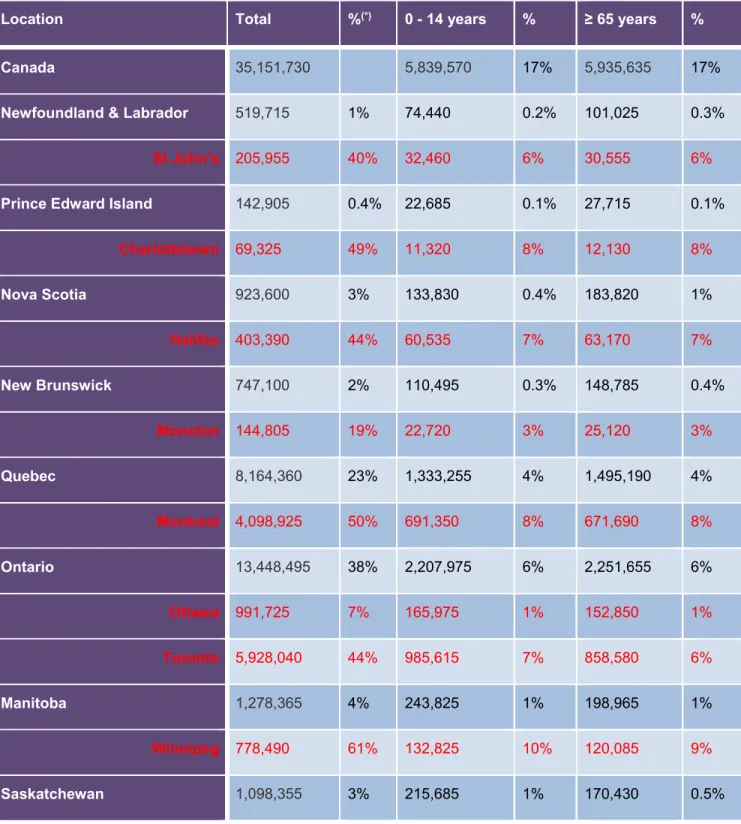
Table 1. List of Global Climate Models (GCMs) contributing towards the CMIP5 multi-model ensemble.. 15 Table 2. Projected median changes in average temperatures for individual provinces, and averaged across Canada. Changes corresponding to RCP 2.6 and RCP 8.5 were provided for 2050s (2046-2065) and 2090s (2081-2100) timelines. Changes were calculated with reference to a baseline historical time-period of 1986-2005 (Source: http://climate-scenarios.canada.ca/index.php?page=download-cmip5). ... 19 Table 3. ETCCDI indices recommended for the assessment of climate change impacts on temperature and precipitation extremes (Source: http://etccdi.pacificclimate.org/; Zhang et al. 2011) ... 24 Table 4. Environment Canada’s heat alert criteria for public warnings (Tmax = daily maximum temperature, and Tmin = daily minimum temperature) ... 29 Table 5. Distribution of Canadian population taken from the 2016 census (Source: StatCan, 2018; http://www12.statcan.gc.ca/census-recensement/2016/dp-pd/hlt-fst/as/Table.cfm?Lang=E&T=12&type=1 ) ... 37
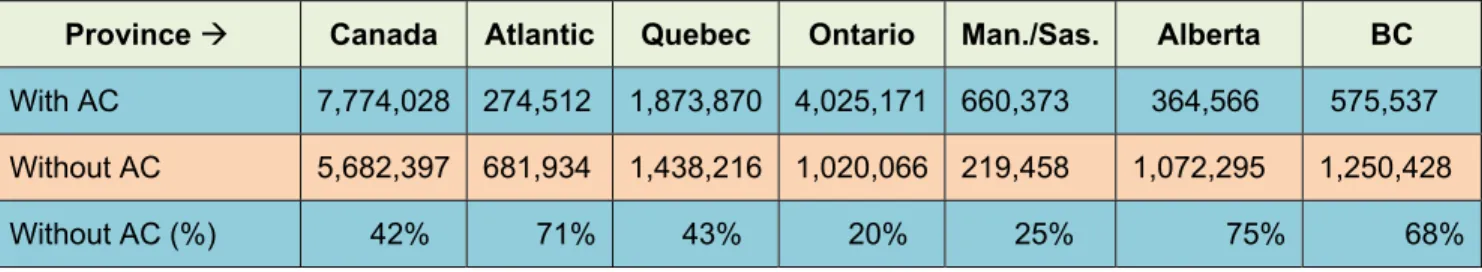
Table 6. Air conditioning use in residential buildings per province based on the 2011 NRCan household
survey (NRCan, 2011) ... 39
Table 7. Air conditioning use in residential buildings per building type based on the 2011 NRCan household survey (NRCan, 2011) ... 39
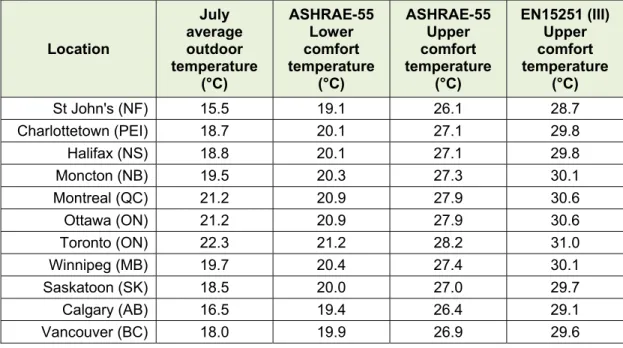
Table 8. ASHRAE-55 and EN15251 adaptive comfort temperatures for selected Canadian cities in July. The monthly averages are taken from the historical climate data of 1981-2010 (Source: EC, 2018b;) ... 41
Table 9. Thermal sensation scale of the perceived temperature (PT) ... 43
Table 10. Thermal sensation scale of the Standard Effective Temperature (SET) ... 43
Table 11. Thermal sensation scale of the UTCI... 45
Table 12. Thermal sensation scale of the physiologically equivalent temperature (PET) ... 46
Table 13. Humidex scale and its corresponding thermal comfort scale in terms of operative temperature and PPD for a typical indoor setting of: RH = 50%, wind speed = 0.15 m/s, metabolic rate = 1 met (sedentary activity), and summer clothing insulation = 0.5 clo. ... 46
Table 14. Heat Index scale and its corresponding thermal comfort scale in terms of operative temperature and PPD for a typical indoor setting of: RH = 50%, wind speed = 0.15 m/s, metabolic rate = 1 met (sedentary activity), and summer clothing insulation = 0.5 clo ... 47
Table 15. TLV reference values of the WBGT and its corresponding operative temperatures under typical indoor conditions for acclimatized and un-acclimatized persons with reference clothing (ISO, 2017). Clothing adjustment to WBGT may be found in ISO (2017) and Havenith and Fiala (2016). ... 48
Executive Summary
Under the Pan-Canadian Climate Change Framework, Infrastructure Canada has provided funding to NRC to deliver the Climate-Resilient Buildings and Core Public Infrastructure (CRBCPI) Project over a five year period. The purpose of the project is to develop decision support tools, including codes, guides and models for the design of new climate resilient buildings (CRB) and core public infrastructure (CPI) and rehabilitation of existing buildings and CPI in key sectors to ensure that the impact of existing and future climate change and extreme weather events are addressed.
This report relates to the research project A1-012820-06: Overheating in Buildings under the CRBCPI Project. The specific goal of project A1-012820-06 is to develop guidelines to address the overheating risk in retrofitted and new buildings as may arise from climate change and extreme heat events. The guidelines are also intended to feed the future updates of the National Building Code of Canada on the climate resilient design of buildings.
The report presents a state of the art literature review on the effects of climate change and extreme heat events on the overheating risk of building interior spaces and its consequences on the heat-related health of building occupants. More than 270 technical articles and best practice guides have been reviewed. The review is summarized as below:
It is unequivocal that the climate has been warming over the past decades and is projected to worsen in the future. Overheating of building interior spaces as may arise from such global warming and extreme heat events has been identified as a major concern to the comfort and health of vulnerable people, overloading of building HVAC systems, increasing the cost and burden of the health care system, and straining of the electric and water utility demands.
Prolonged exposure to extreme heat induces heat stresses on the health of people that may lead to severe health issues (such as cramps, heat exhaustion and fatal heat stroke) or even death.
Furthermore, extreme heat events increase environmental chemical reactions that can lead to issues of indoor air quality, which in turn pose a greater risk to the human health. Extreme heat events in urban heat island city centers combined with air pollution in industrial areas were found to increase morbidity (sickness), mortality (loss of life), food and energy prices, and insurance claims, particularly in North America. The extent of this effect varies from climate to climate, region to region, and city to city. In Canada and the USA, the number of excess mortalities due to extreme heat events is higher than any other natural hazard event such as storms and floods. Heat-related mortality is largely preventable if proper actions and adaptation measures are implemented at a community and/or individual level to reduce the risk of extreme heat events. In this regard, many Canadian jurisdictions from the east to the west coasts have developed various extreme heat adaption measures through the establishment of extreme heat alert systems and response plans, particularly at a community level. Canadian health organisations have also developed best practice guidebooks and guidelines to assess the vulnerability and adaptation of health care workers to extreme heat events. Studies on climate change adaptations at
a building (or individual) level have been, however, very limited in the Canadian context due to the lack of information on exposure to elevated indoor temperatures.
Effect of heat on the human health
The effect of heat on the human health is a well-known topic in the medical discipline as it directly leads to illnesses and tissue injury or damage. Heat-related illnesses and injuries develop when the body core temperature is higher than 37°C, resulting in heat cramps, heat exhaustion or fatal heat stroke.
Vulnerable people such as seniors, sick people and children are the most affected by heat due to limitations of their thermo-regulatory systems.
Climate change effects
The review included various modeling approaches to predict future climate change and extreme heat events and generate the required hourly weather data for building thermal simulation. Changes in climate can occur both due to natural factors and anthropogenic (human-made) factors. The World
Meteorological Organisation has recommended a 30 year time-period as the minimum to smooth out short-term climate variability, and identify robust climate change signals. When analyzing the extreme climatic events, changes in their frequencies, durations, and intensities over the 30 year period are analyzed. Premier climate modelling agencies have generated future projections of climate using Global Climate Models (GCMs) as discussed in details in successive Inter-governmental Panel on Climate Change (IPCC) reports. The GCMs simulate the response of global climate system to greenhouse gas (GHG) emissions following four representative concentration pathways: RCP2.6 scenario that depicts aggressive future climate mitigation; two intermediate scenarios RCP4.5 and RCP6.0; and a business-as-usual RC8.5 scenario. As such, GCMs are able to simulate global temperatures and temperature
extremes with more accuracy than other more heterogeneous variables such as precipitation and wind. Regional climate downscaling techniques are used to produce higher spatial resolution (< 50 km) regional climatic data for performing regional scale impact assessments.
Observational records show that average temperatures across Canada have increased on average by 1.3 °C over the past 50 years, approximately twice the global average. The degree of warming has been found to vary spatially, temporally, and for different climate indices. Stronger increases have been recorded for the daily minimum temperatures than for the daily maximum temperatures, in the north-western and north-western regions of Canada than the rest of the country, and in the winter and spring seasons than the rest of the year. The long-term temperature forecasts made by the IPCC models suggest a mean warming of approximately 2 °C to 6 °C in the average temperatures across Canada for the different emission pathway scenarios. The projected changes vary spatially over Canada with some provinces having higher warming magnitudes than the others. The provinces of Nunavut, Northwest Territories, and Manitoba are consistently projected with significantly higher warming than the rest of the Canada. The provinces of Saskatchewan and Yukon Territory also fall marginally above the Canadian average.
Extreme heat events (EHE)
The review included the various definitions of extreme heat events, studies on EHE historical occurrences around the world, and EHE health impact studies on the mortality and morbidity of the population. There is currently no specific definition of EHE which is accepted worldwide. The challenge resides particularly in the selection criteria for threshold values for the intensity and duration of the EHE. The Canadian heat alert system uses a combination of humidex, and the daily maximum and minimum temperatures for a few climatic locations distributed across each province. The EHE-related health outcomes include mortality and morbidity. Although mortality has been well studied, mortality studies have many
confounding factors (e.g. air pollution, population socioeconomic status), and the outdoor temperature is typically used as the predictor for excess mortality, which is different than the indoor temperature to which most people (up to 90%) are exposed when present in residences, schools, or workplaces. Morbidity studies have been, however, very limited due to the lack of publicly available data.
Risk factors for EHE-related health of people
The possible risk factors were summarized for the heat related health including vulnerable people, environmental factors, community factors, and factors relating to the built environment.
Heat stress related metrics
The various thermal comfort and heat stress indices developed in the past were summarized in this section. The indices included thermal comfort metrics, physiological heat stress metrics, empirical (or bio-meteorological) metrics and epidemiological metrics. There are more than 100 metrics, but a few of them are universally used in buildings (e.g., thermal comfort) and occupational heat and safety guides and standards. All metrics are developed for healthy adult people, and there is none that address vulnerable people such as seniors, sick people and children.
Overheating studies
Buildings may play a major role to limit the risk of overheating and thereby protect occupants from the harmful outside environment. Buildings influence the indoor thermal conditions to which people (occupants) are exposed most of the time and to which they experience thermal stress. The indoor conditions are a direct consequence of the outdoor conditions, but the severity of indoor conditions depends on many other factors, amongst which are building type (houses, apartment buildings, schools, hospitals, etc.), internal space usage (occupancy density, internal heat gains), construction characteristics (insulation levels, window surface proportions, orientation of facades), and building operation
(air-conditioning use, natural ventilation). Various field measurement and simulation studies on the effects of climate change on overheating in different types of buildings and proper adaptations strategies were reviewed. The review also included studies on how various international organisations have responded to limit the risk of overheating through the development of standards and technical guides for best practice. Various definitions of overheating were presented and analysed to develop a suitable definition for the Canadian context.
Climate Resilience of Buildings:
Overheating in Buildings — Literature Review
Authored byA. Laouadi, Ph.D.; A. Gaur, Ph.D.; and M. Bartko, Ph.D.
1. INTRODUCTION
It is unequivocal that the global climate has been warming consistently over the past few decades. A global average temperature increase of 0.85°C was observed from the historical climate data for the past 130 years (IPCC, 2014). Locally, the temperature warming increase was more than double for the whole Canada and triple for the northern arctic latitudes (ECCC, 2016). The climate change has also been found to be associated with more frequent, longer and intense extreme events such as heat waves and droughts. At the global scale, an increase of the hot temperature extremes in summer and decrease of cold temperature extremes in winter were observed since 1950.
Human influences, driven by the global economic and population growth with its consequences on increasing greenhouse gas emission, have been found to be an extremely likely cause of climate change (IPCC, 2014). As human influences continue to grow, future climate warming is expected to follow. Depending on the greenhouse gas emission scenario, the global climate warming for the late 21st century is projected to likely exceed 1.5°C relative to 1850-1900 (IPCC, 2014). In Canada, the future
temperature projection shows significant variability among provinces and territories with an average value exceeding the global value by more than 50% (ECCC, 2016).
Beside global temperature increases, the future climate change is likely to increase the intensity, duration and frequency of extreme heat events. Extreme heat events are characterised by temperatures that are much warmer than the seasonal average.
The future climate change is expected to have a significant impact on building infrastructures and
communities and population health (Boyle et al., 2013; IPCC, 2014). Overheating of the built environment as may arise from the global climate warming and extreme heat events has been identified as a major concern to (IOM, 2011; CIBSE, 2014):
1. Affect the comfort and health of particularly vulnerable occupants. Vulnerable occupants include those whose age or prior health status renders them more susceptible to environmental heat stress, and those having reduced economic mobility and capacity to adapt to or mitigate the effects of increasing heat;
2. Reduce the productivity and performance of building occupants;
3. Overload the HVAC systems of buildings leading to potential system operation failure; and 4. Strain the demands of electric and water utilities leading to power outages.
Overheating of the built environment is characterised by indoor temperatures reaching excessive values over a period of time that can lead to negative effects on the comfort and health of building occupants. Prolonged exposure to extreme heat induces heat stresses on the health of people that may lead to severe health issues (such as heat exhaustion and heat stroke) and in some instances death. As well, increases in environmental chemical reactions attributable to excessive heat may lead to increases in indoor air quality issues that in turn pose a greater risk to health. Extreme heat events in city centers where there is an evident urban heat island effect combined with air pollution in industrial areas was found to increase morbidity (sickness), mortality (loss of life), food and energy prices, and insurance claims, particularly in North America (IPCC, 2014). The extent of this effect varies from climate to climate, region to region, and city to city. In Canada and the USA, the number of excess mortalities due to
extreme heat events is higher than any other natural hazard event such as storms and floods (Berko et al, 2014; CDC, 2017; ICLR, 2018).
Heat-related mortality is largely preventable if proper action and adaptation measures are implemented at the community and individual level to reduce the risk of extreme heat events (Vaidyanathan et al., 2017). Heat-related mortality occurs over a few days to a few weeks after the occurrence of the extreme heat event (Gasparrini and Armstrong, 2010), and therefore to avoid any potential loss of life any intervention should be planned ahead of time and responded to promptly In this regard, many Canadian
municipalities from the east to the west coasts have developed various extreme heat adaption measures through the establishment of extreme heat alert systems and response plans, particularly at a community level (Richardson, 2010; Gower et al., 2011; TPH, 2017; Mehiriz and Gosselin, 2016). Canadian health organisations have also developed best practice guidebooks and guidelines to assess vulnerability and adaptation of health care workers to extreme heat events (HC, 2011a, b; 2012). Although relatively well addressed at a community level, studies on climate change adaptations at a building (or individual) level are very limited in the Canadian context. This is a part due to the lack of information on the indoor temperature exposure for both the historical and projected climate data. Furthermore, although there are numerous research studies that have addressed the effects of climate change on overheating in buildings as occurs in various climates around the world, only a few countries have developed standard guides for buildings (CIBSE, 2005).
Buildings that shelter and protect people from the outdoor environment may pose an increased h risk to the heat-related health of occupants in various ways. First, building occupants are more exposed to the indoor conditions than the outdoor environment as they spend more than 90% of their time indoors whether in residences, in schools, or in workplaces (IOM, 2011). Depending on the building type, indoor temperatures may exceed the outdoor temperatures by several degrees, particularly for naturally
ventilated buildings (TPH, 2015; Touchie et al., 2016; van Loenhout et al., 2016). Second, given the fact that buildings are designed for cold climates in Canada, cooling and ventilation in summer are not mandated in building energy codes and regulations. Many building types (e.g., multi-unit residential
buildings; schools) do not use mechanical cooling to reduce the risk of space overheating. In Canada, the use of air conditioning varies among provinces with an average of 58% and 69% for residential and commercial buildings respectively (NRCan, 2011; 2012). Third, old buildings, which make up a significant portion of the building stock, are leakier and not energy efficient and have poor indoor air quality; such buildings often house vulnerable people (e.g. socially deprived), particularly in social housings and apartment buildings. Fourth, new highly insulated buildings, particularly those having high internal heat gains or fully glazed facades may result in periods of space overheating due to unmet air conditioning demands (Mulville and Stravoravdis, 2016). Furthermore, excessive use of air conditioning in buildings would strain the demand for electricity of utilities with potential consequences of power surges and blackouts and that, in turn, would exacerbate the health risk of occupants. Last but not least, most commercial buildings and MURBS are located in large urban areas. The latter may experience the heat island effect (UHI) with 1 to 12°C warmer temperatures particularly at nighttime compared to the
surrounding countryside (Gachon et al., 2016). During a heat wave event, warmer nighttime indoor temperatures, particularly if combined with high humidity, may result in sleep privation, and therefore this exacerbates the heat related heath effect during hot days (NASEM, 2016).
Adaptation of old and new buildings to become resilient to future climate change has thus become an urgent need. Recently, the National Research Council through funding from Infrastructure Canada under the Pan-Canadian Climate Change Framework has initiated multiple research projects on climate-resilient buildings and core public infrastructure (CRB-CPI). The purpose of the research projects is to develop decision support tools, including codes, guides and models for the design of resilient new buildings and CPI and rehabilitation of existing buildings in key sectors to address future climate change and extreme weather events. With regards buildings, two projects were identified: (1) Overheating in buildings
(A1-012820-06) and (2) Hygrothermal response and durability of building envelopes (A1-012820-05).
This report is the first deliverable of the project A1-012820-06. The report reviews state of the art literature that relates to the effect of climate change on the built environment and the potential health effects on building occupants as may arise from a changing climate. The report is structured as follows:
Section 2: About the overheating project (A1-012820-06)
This section provides an overview of the project and provides the context for this first deliverable of the project.
Section 3: Effect of heat on the human health
This section describes the well-known effects of heat on the human health, and lists the potential heat-related illnesses and injuries than may develop when the body core temperature is higher than the neutral value.
Section 4: Climate change effects
This section reviews previous work related to the historical observational records over Canada, and the various modeling approaches used to predict the future climate change and extreme heat events. Methodologies to generate the hourly weather data for a reference extreme year for overheating analysis are also reviewed.
Section 5: Extreme heat events (EHE)
This section reviews in particular extreme heat events of climate change, including their definition, studies on their historical occurrences around the world, and studies on their health impact on the mortality and morbidity of population.
Section 6: Risk factors for EHE-related health of people
This section reviews and lists the possible risk factors of EHE for the health of particularly vulnerable people. The risk factors are grouped into environmental (climate) factors, community factors, and built environment factors.
Section 7: Heat stress related metrics
This section reviews and lists the many variant types of metrics to quantity the effect of EHE on the comfort and health of people (healthy and vulnerable).
Section 8: Overheating studies
This section focuses on buildings as a potential risk factor for the comfort and health of occupants. It starts with the review of previous work (through field measurement and simulation) around the world to assess the overheating risk in the built environment, and how various international organisations have responded to limit the risk of overheating through the development of standards and technical guides for best practice.
2. ABOUT THE OVERHEATING PROJECT
The goal of the project (A1-012820-05) is to develop guidelines to address the overheating in retrofitted and new buildings and the heat related health risks of occupants as they may arise from climate change effects. The guidelines will feed the future updates of the National Building Code of Canada. The specific project objectives are:
1. To review literature on the effects of climate change and extreme heat events on the overheating of building indoor spaces under a Canadian context;
2. To evaluate building responses to climate change;
3. To develop and evaluate the effectiveness of selected resilient (adaptation) measures for new and retrofit buildings;
4. To update the Canadian national building codes to address overheating in buildings;
5. To develop guidelines and tools for overheating in buildings and health risk of occupants arising from climate change effects.
The project is composed of five main tasks as follows:
Task 1 – Literature review
Task 2 – Climate change effects (historical and future data)
Task 3 – Building responses to climate change and extreme heat events Task 4 – Development of guidelines and tools for overheating in buildings Task 5 – Proposed changes to the national building code (NBC)
3. EFFECT OF HEAT ON THE HUMAN HEALTH
The effect of heat on human health is a well-known topic in the medical discipline as it directly leads to illnesses and tissue injury or damage (HC, 2011a; EPA, 2016; Yeo, 2004; Parsons, 2003). The human body maintains an optimum body core temperature of 37°C to perform its vital physiological functions. The environmental thermal conditions imposed on the human body combined with its activity level will affect the body temperature, and will therefore trigger a response of the thermoregulatory system to cool the body by balancing the heat gain with the heat loss. If the environmental conditions are not short term (less than a few weeks), the body will be acclimatized (become tolerant) to such conditions and
individuals would use various adaptation measures (e.g., wearing light clothing, reduce direct exposure to heat, and other measures) to restore their thermal comfort (HC, 2011b; Deschenes, 2014). If the
thermoregulatory system is overwhelmed by the imposed thermal conditions, the human body will
experience some minor to serious illnesses depending on the thermal stress level. Heat-related illnesses develop when the body core temperature is between 37°C and 40.6°C, and tissue injury or destruction occurs at higher body core temperatures (Yeo, 2004).
3.1 P
HYSIOLOGICAL RESPONSE TO HEATThe physiological system of the human body continuously generates heat through its metabolism to
maintain a body core temperature within a very tight range of 35°C to 41°C around a mean of 37°C (Periard et al., 2015). The excess heat is dissipated to the environment through respiration, and peripheral blood flow to the skin. The skin surface exchanges the blood-transported heat with the environment though radiation, convection and evaporation. If the body core temperature is above the neutral value (37°C) the thermoregulatory system uses two mechanisms to cool the body surface: (1) increase of the peripheral blood flow through higher cardiac output (heart blood flow) and vasodilation of the blood vessels in the skin; and; (2) sweat (water and salt) release for evaporative cooling. The first cooling mechanism is triggered when the environmental thermal conditions are close to the neutral conditions (slightly warm on the thermal comfort scale) and the body core temperature is between 36.8°C to 37.2°C (Rida et al., 2014). The second cooling mechanism is the most efficient one; it is triggered when the first cooling mechanism is not sufficient
under higher body core temperatures. However, this cooling mechanism may be compromised by high values of relative humidity of the local environment and body dehydration. In hot and dry conditions, heat can easily be removed from body by the evaporative cooling through sweat, and the body cooling capacity is limited to the maximum sweat rate of the sweat glands and fluid intake to replace the loss of water from sweating. If body dehydration occurs, the muscle blood flow, sweat rate and salt retention may decrease accordingly, resulting in higher core temperatures and consequent development of health issues. In hot and humid conditions, the evaporative cooling may be significantly reduced, and the body will therefore
accumulate heat and the high peripheral blood flow to the skin may compromise the blood and nutrient flows to other body organs, potentially resulting in heat-related illnesses (HC, 2011a).
3.2 A
CCLIMATISATION AND ADAPTATIONUnder natural environmental conditions, people adapt to restore thermal comfort if they experience thermal discomfort by using various adaptation means, which can be grouped as physiological (or acclimatization), behavioural, and psychological (Parsons, 2003).
Acclimatisation refers to the physiological adaptation in response to repeated exposures to hot or cold
environment over a few weeks duration (HC, 2011a; ISO, 2017), thus increasing the ability of people to become more tolerant to temperatures higher than the neutral conditions (Parsons, 2003).
Acclimatization involves various physiological changes, including decreasing the threshold body core temperature for sweating and blood flow (thus sweating initiated earlier), increased dilute sweat production, lower peripheral blood flow and salt conservation. Acclimatisation explains why people in warm climates tolerate higher threshold temperatures than people in cold climates (Hajat and Kosatky, 2010; Basu, 2009). Furthermore, extreme heat events (EHE) have higher impacts on the population in early summer as compared to full summer due to fewer people acclimatized at the beginning of the warm season (Basu, 2009; HC, 2012).
Behavioural (or physical) adaptation is the most effective means to ensure survival, comfort and
performance (Parsons, 2003). It involves any changes that a person can make to oneself or the environment to reduce the effect of heat. Personal and environmental changes may include wearing lighter clothes, use of air conditioning, ventilation fans, opening windows, moving around to avoid direct heat, and other similar measures. Behavioural adaptation is the key driver to achieve adaptive thermal comfort in naturally ventilated buildings (Brager and de Dear, 1998).
Psychological adaptation refers to the altered perception of and reaction to sensory information due to
past experience and expectations (Parsons, 2003). In other words, people may perceive and react differently to the imposed environment conditions, and their physiological and behavioural adaptation may therefore be influenced accordingly. Psychological adaptation plays a role in naturally ventilated buildings where people are more tolerant to heat than in air conditioned buildings (Brager and de Dear, 1998).
3.3 H
EAT RELATED ILLNESSESHeat related illnesses progress from the start of feeling thermal discomfort, to mild heat stress or cramps, to heat exhaustion, and then to heat stroke, potentially leading to organ dysfunctions (such as renal failure) and death in some instances. Heat illnesses are caused by dehydration, electrolyte (salt) losses, and a failure of the thermoregulatory system (Yeo, 2004).
Heat cramps (mild heat stress) — Are caused by the loss of fluids and salts due to sweating. It is
accompanied by painful muscle cramps and spasms, and heavy sweating. Drinking water and application of a firm pressure on cramping muscle or gentle message may relief the symptoms (EPA, 2006).
Heat exhaustion — Occurs when the body core temperature is between 37°C and 40°C, and the body
becomes dehydrated and can no longer dissipate heat. The cardiovascular system is unable to meet the needs for cooling of skin surfaces and muscles due to lower blood volume. It is accompanied by heavy sweating, fatigue and weakness, dizziness and fainting, and nausea and vomiting (Yeo, 2004; EPA, 2006; HC, 2011a). Drinking water and cooling the body may relief the symptoms (EPA, 2006).
Heat stroke — Occurs when the thermoregulatory system fails, the body core temperature reaches
40.6°C or higher (extreme hyperthermia), and the skin becomes hot and dry.. It is accompanied by headache, confusion, nausea and dizziness. Heat stroke is a severe medical emergency, and any delay to its cure may be fatal (Yeo, 2004; EPA, 2006). If it occurs, the body needs immediate cooling (e.g., placing individual in air conditioned area), and seek for medical emergency.
4. CLIMATE CHANGE EFFECTS
Climate change is characterized by changes in the climatic conditions of a region, which persist for a considerable period of time. The World Meteorological Organisation (WMO) and climate scientific communities consider 30 years as the minimum period to smooth out the natural variability of climate (Charron, 2014). Premier climate modelling agencies have generated future projections of climate using Global Climate Models (GCMs) as discussed in detail in successive reports of the Inter-governmental Panel on Climate Change (IPCC). The GCMs simulate the response of global climate system to greenhouse gas (GHG) emissions following four representative concentration pathways (RCP): RCP2.6 scenario that depicts aggressive future climate mitigation; two intermediate scenarios RCP4.5 and RCP6.0; and a business-as-usual RCP8.5 scenario. As such, GCMs are able to simulate global temperatures and temperature extremes with more accuracy than other more heterogeneous variables such as precipitation and wind. Regional climate downscaling techniques are used to produce higher spatial resolution (< 50 km) regional climatic data for performing regional scale impact assessments.
4.1 C
LIMATE MODELLING APPROACHESGlobal climate models (GCMs) are mathematical models that simulate global coupled land-atmosphere-ocean system, and are used to study the response of climate system to greenhouse gas forcings.
Different climate modelling groups have contributed towards providing future projections of global climate. The results of these systematic climate experiments are disseminated primarily through the Coupled Model Inter-comparison Project – Phase 5 (CMIP5). A suite of 50 GCMs, listed in Table 1, have been identified in IPCC (2014) as contributing towards the CMIP5 multi-model ensemble. Canada currently contributes to the CMIP5 ensemble by means of two models: CanCM4 and CanESM2. It has been discussed in IPCC (2014) that the future projections of climate obtained from each of the listed GCMs should be considered equally plausible and no model should be considered better than the other. This introduces significant uncertainty in the projections of future climate, which has been quantified in many studies (Teng et al., 2011).
Table 1. List of Global Climate Models (GCMs) contributing towards the CMIP5 multi-model ensemble.
S. No. Model name Country
1 (i) ACCESS1.0; (ii) ACCESS1.3; (iii) CSIRO-Mk3.6.0 Australia
2 (iv) BCC-CSM1.1; (v) BCC-CSM1.1 (m); (vi) BNU-ESM; (vii)
FGOALS-g2; (viii) FGOALS-s2; (ix) FIO-ESM v1.0 China
3 (x) CanCM4; (xi) CanESM2 Canada
4
(xii) CCSM4; (xiii) BGC; (xiv) WACCM; (xv)
CESM1-FASTCHEM; (xvi) CESM1-CAM5; (xvii) CESM1-CAM5.1-FV2; (xviii) ESM2M; (xix) ESM2G; (xx) CM2.1; (xxi) GFDL-CM3; (xxii) GISS-E2-R; (xxiii) GISS-E2-H; (xxiv) GISS-E2-R-CC;
(xxv) GISS-E2-H-CC; (xxvi) NCEP-CFSv2
USA
5 (xxvii) CMCC-CM; (xxviii) CMCC-CM5; (xxix) CMCC-CESM Italy
6 (xxx) CNRM-CM5; (xxxi) IPSL-CM5-LR; (xxxii) IPSL-CM5A-MR;
(xxxiii) IPSL-CM5B-LR France
7 (xxxiv) EC-EARTH Europe
8 (xxxv) HadGEM2-ES; (xxxvi) HadGEM2-CC; (xxxvii) HadCM3 UK
9 (xxxviii) HadGEM2-AO Korea
10 (xxxix) INM-CM4 Russia
11 (xl) MIROC4h; (xli) MIROC5; (xlii) MIROC-ESM; (xliii)
MIROC-ESM-CHEM; (xliv) MRI-ESM1; (xlv) MRI-CGCM3 Japan
12 (xlvi) MPI-ESM-LR; (xlvii) MPI-ESM-MR; (xlviii) MPI-ESM-P Germany
13 (xlix) NorESM1-M; (l) NorESM1-ME Norway
Future projections of climate are made in accordance with the projected trajectories of technological, socio-economic and policy development pathways that the global community can adopt in the future. In the CMIP5 multi-model ensemble, future projections of climate are provided for four “representative” concentration pathways (RCPs; van Vuuren et al. 2011) that encompass the range of radiative forcing
projections found in the open literature i.e. from 2.6 W/m2 to 8.5 W/m2. The RCPs: RCP 2.6, RCP 4.5, RCP6.0, and RCP8.5 correspond to greenhouse gas emission trajectories that would result in an end of 21st century radiative forcing levels of 2.6 W/m2, 4.5 W/m2, 6.0 W/m2, and 8.5 W/m2 respectively. The possibility of multiple future growth pathways therefore adds another layer of uncertainty in future projections made by the GCMs.
The typical spatial resolutions at which the simulations are performed within the GCMs range between 1° (~110 km) and 5° (~550 km). To use these projections for local scale impact assessments, the projections are downscaled to obtain higher spatial resolution estimates of future climate. There are two broad categories of downscaling methods that have been used: (1) statistical, and; (2) dynamic. Statistical downscaling models derive statistical relationships between coarser resolution GCM projections and climatic observations, and use the relationships to obtain downscaled climatic projections (Schoof, 2013). The assumption involved is that the nature of the relationships between coarser and finer scale climate estimates will remain unchanged between the historical and future timelines.
On the other hand, dynamic downscaling methods involve the use of Regional Climate Models (RCMs) which are limited-area climate models i.e. they simulate only a subset of global area but at much higher resolution as compared to the GCMs. The typical spatial scale at which RCM simulations are performed is at 25-50 km scale. RCMs generally use atmospheric boundary conditions from the GCMs and generate higher resolution climatology over the region of interest (Xue et al. 2014). One of the known limitations of RCMs is that they rely on GCMs for atmospheric boundary conditions, and the bias associated with GCM simulated boundary conditions is thus transferred to RCM downscaled projections as well. Previous studies have developed statistical procedures to correct for this bias directly in the RCM simulated climatology (Bordoy and Burlando, 2013), or correcting for bias in the GCM boundary conditions before performing RCM simulations (Colette et al. 2012; Bruyere et al. 2014).
4.2 C
LIMATE CHANGE INC
ANADA–
HISTORICAL OBSERVATIONSThe influences of climate change have been detected in Canada. Observational records convey that the average temperatures across Canada have increased on average by 1.3 ºC over the past 50 years, approximately twice the average increase recorded globally (Bizikova et al. 2008). The degree of warming has been found to vary spatially, temporally, and for different climate indices. Stronger increases have been recorded for daily minimum temperatures than for daily maximum temperatures, in the
north-western and north-western regions of Canada than the rest of the country, and in the winter and spring seasons than the rest of the year (Zhang et al. 2000).
Similarly, changes in temperature extremes have also been recorded. Wang et al. (2014) analyzed changes in one-in-20 year minimum and maximum temperatures recorded in Canada. They found that between 1911 and 2010, significant increases in extreme indices have been recorded especially in case of extremely low temperatures, and in the Arctic regions of Canada. Alexander et al. (2006), Vincent and
Mekis (2006), and Khaliq et al. (2007) analyzed observed changes in temperature related extreme climate indices in different parts of Canada, and obtained evidence of widespread warming including increases in maximums and minimum temperature extremes, decreases in the numbers of cold days and cold nights, increases in the numbers of warm days and warm nights, decreases in the daily temperature ranges, decreases in the numbers of frost and ice days, increases in the growing season length, and increases in the warm spell durations.
4.3 C
LIMATE CHANGE INC
ANADA–
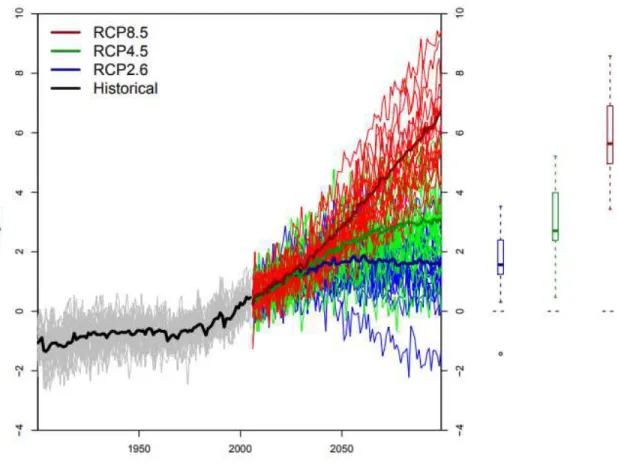
PROJECTED TEMPERATURESClimate change is expected to influence considerable changes in temperature patterns across Canada. The time-series of long-term temperature forecasts made by CMIP5 models provided by Environment and Climate Change Canada (ECCC, 2016) suggests a median (across all GCMs considered) warming of approximately 2 ºC to 6 ºC in average temperatures across Canada for different scenarios as shown in Figure 1. The future trajectories of temperature in Figure 1 have been forecasted for three RCPs: RCP 2.6, RCP 4.5, and RCP 8.5 for the time-periods spanning 20th and 21st centuries. Figure 2 presents the median projected changes in summertime (June-August) temperatures averaged across Canada. Slightly lower summer-time changes have been projected as compared to annual changes which aligns well with a higher warming projected for winter months (not shown).
Figure 1. Time-series of projected changes in annual mean temperatures in Canada. The changes were calculated with reference to a baseline time-period of 1986-2005 (Source: http://climate-scenarios.canada.ca/index.php?page=download-cmip5)
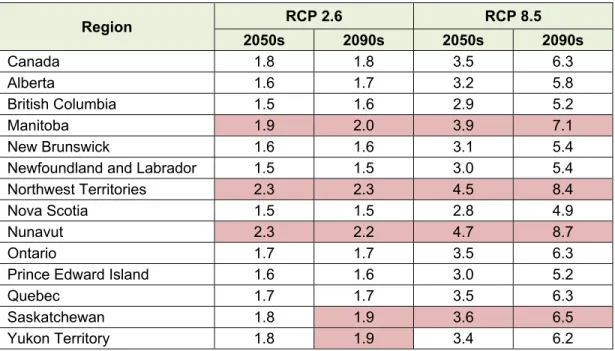
The projected changes vary spatially, and across different provinces of Canada. A summary of the projected mean changes in annual temperatures across Canada is provided in Table 2 for two extreme RCPs: RCP 2.6 and RCP 8.5. In the table, median changes in average temperatures are provided for individual provinces and for the entire Canadian landmass. As discussed before, the average projected changes in temperature between historical and 2090s timelines, averaged across Canada, range between 2 ºC to 6 ºC. However, some provinces are projected with higher warming magnitudes than the others. In Table 2, the provinces projected with warming magnitudes higher than the Canadian average are highlighted in red. The provinces of Nunavut, Northwest Territories, and Manitoba are consistently projected with significantly higher warming under all RCPs than the rest of the Canada. The provinces of Saskatchewan and Yukon Territory also fall marginally above the Canadian average in terms of the projected warming.
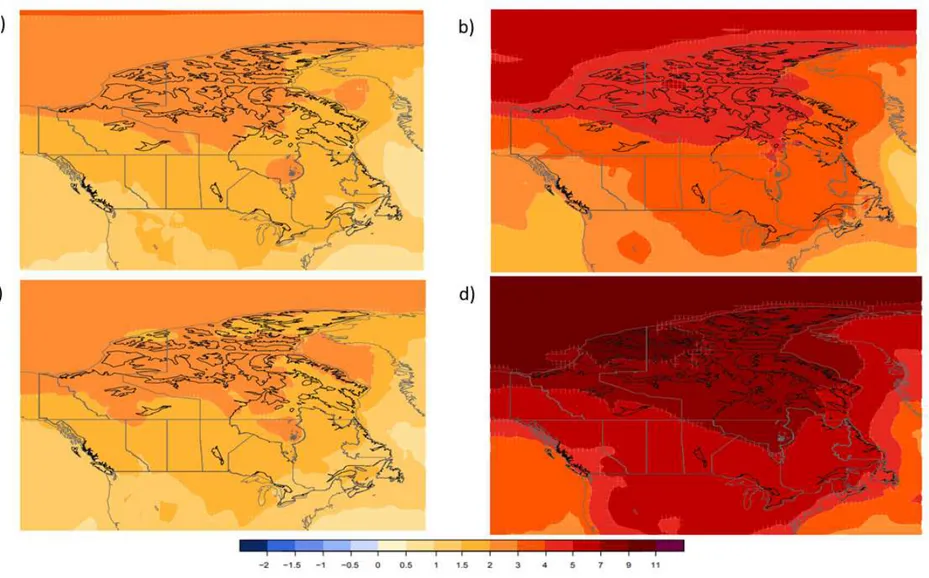
The spatial heterogeneity in the projected temperature changes can also be noted in the results presented in Figure 2. The Figure shows the color-coded projections of median temperature changes between the baseline historical time-period of 1986-2005 and future timelines: 2050s and 2090s for two extreme RCPs: RCP 2.6 and RCP 8.5. It is evident that the projected increases in temperature are
significantly higher for the northern regions of Canada than the southern regions. Similarly, projected increases are marginally higher in the western regions than in the eastern regions.
Table 2. Projected median changes in average temperatures for individual provinces, and averaged across Canada. Changes corresponding to RCP 2.6 and RCP 8.5 were provided for 2050s (2046-2065) and 2090s (2081-2100) timelines. Changes were calculated with reference to a baseline historical time-period of 1986-2005 (Source:
http://climate-scenarios.canada.ca/index.php?page=download-cmip5). Region RCP 2.6 RCP 8.5 2050s 2090s 2050s 2090s Canada 1.8 1.8 3.5 6.3 Alberta 1.6 1.7 3.2 5.8 British Columbia 1.5 1.6 2.9 5.2 Manitoba 1.9 2.0 3.9 7.1 New Brunswick 1.6 1.6 3.1 5.4
Newfoundland and Labrador 1.5 1.5 3.0 5.4
Northwest Territories 2.3 2.3 4.5 8.4
Nova Scotia 1.5 1.5 2.8 4.9
Nunavut 2.3 2.2 4.7 8.7
Ontario 1.7 1.7 3.5 6.3
Prince Edward Island 1.6 1.6 3.0 5.2
Quebec 1.7 1.7 3.5 6.3
Saskatchewan 1.8 1.9 3.6 6.5
Yukon Territory 1.8 1.9 3.4 6.2
4.4 P
LANNED APPROACHES FOR GENERATING FUTURE CLIMATE DATAThe following steps will be performed to generate the necessary climatic data for undertaking whole building thermal simulations under historical and future projected climates:
4.4.1 Acquisition of downscaled climatic data from ECCC
The climatic projections from the Canadian Regional Climate Model version 4 (CanRCM4) will be the primary source of climatic data that will be used to generate inputs for building simulations. The
CanRCM4 data was derived by performing dynamic downscaling of Canadian GCM: CanESM2. The data comprises of fifty members of model projections spanning 1950-2100, each simulated by considering a randomly generated cloud property parameter in the CanRCM4 model.
4.4.2 Extraction of climate projections for different global warming thresholds
The CanRCM4 data obtained from ECCC will be used to extract 31-year long climatic time-series that would correspond to historical, and multiple future scenarios of globally averaged warming ranging from
0.5°C to 3.5°C in 0.5°C increment intervals. In addition to the datasets described in Section 3.4.1, ECCC has also provided centre-years when these global warming thresholds are expected to be reached in the future. Using this information with the datasets described in Section 3.4.1, the 31-year time-series for historical and future time-periods will be extracted for different cities chosen for assessment.
Figure 2. Median changes in average temperatures projected for cases: a) 2050s & RCP 2.6, b) 2050s and RCP 8.5, c) 2090s & RCP 2.6, and d) 2090s & RCP 8.5. Future timelines: 2050s and 2090s represent time-periods: 2046-2065 and 2081-2100 respectively. The changes have been calculated with reference to the baseline historical time-period of 1986-2005 (Source:
4.4.3 Additional pre-processing steps
It is anticipated that some pre-processing steps may be required to bridge the gap between information available from the CanRCM4 model, and that required for performing building simulations. The following are some of the steps that may be required:
Bias-correction: Studies have identified the existence of bias between observed climate and that simulated by RCMs (Bordoy and Burlando, 2013). The CanRCM4 data will be checked for the existence of bias; and in the presence of bias, suitable methods will be used to estimate bias-corrected information from the raw CanRCM4 data.
Disaggregation: Hourly time-series of climate are required for performing building simulations. Out of the 50 sets of CanRCM4 projections, 15 are available in hourly time-steps whereas the rest are available in daily time-steps. The data available in daily time-steps will need to be disaggregated to obtain hourly data. Appropriate disaggregation methods will be used to estimate hourly time-series from the daily time-series of CanRCM4 projections.
Estimation of direct and diffused radiation fractions: The direct and diffused fractions of incoming solar radiations are generally not provided in the GCM/RCM databases. Suitable methodologies described in the literature (Duffie and Beckman, 1980; Orgill and Hollands, 1977; Morris, 2016; Thevenard, 2010) will be used to obtain this information using the projections of “downward shortwave radiative flux” that are more commonly available.
Generation of sub 1-km resolution information for select cities: The CanRCM4 projections provided by ECCC have a spatial resolution of 0.44 deg. (~50 km). Higher resolution climatic information is required to identify the spatial heterogeneity of projected climate within the cities to identify the hazard exposure on specific buildings or communities. Modelling at higher resolutions (≤4 km) has also been found to improve the modelling accuracy of key urban climate phenomenon such as Urban Heat Island (Prein et al. 2015). However, high resolution modelling also requires significant computational and time resources and therefore sub-km scale simulations will be performed using a Weather Research and Forecasting (WRF) model at select cities within Canada so that the information can be used to prepare overheating hazard maps across the selected cities.
4.4.4 Reference year selection
For the purposes of overheating analysis arising from climate change and EHEs, it is essential to identify years or time-periods when the most intense and frequent temperature extreme events are expected. Some critical aspects that are likely to affect the choice of selected reference years are as follows:
Definition of extremes: Several definitions of extremes have been used in the past. Some of the most widely used include: annual maximums (Westra et al. 2013); events crossing 95th quantile (Zhang et al. 2017a, b; Scoccimarro et al. 2015); events crossing 98th quantile (Wasko and Sharma 2014); events
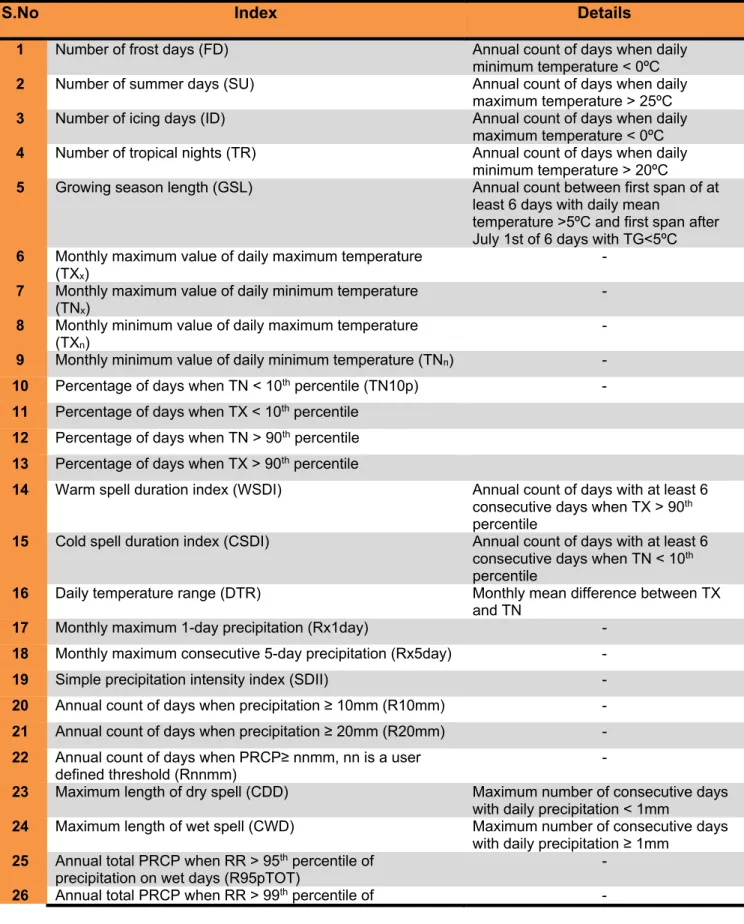
crossing 99th quantile (Shaw et al. 2011). Apart from these definitions, the joint CCI/CLIVAR/JCOMM Expert Team on Climate Change Detection and Indices (ETCCDI) has proposed a set of 27 indices for the assessment of climate change impacts on temperature and precipitation extremes (Zhang et al. 2011). A list of these indices is provided in Table 3. The choice of definition for extremes can be expected to introduce considerable uncertainty in the definition of the hazard (Gaur et al. 2018), and subsequent selection of the reference years.
Choice of climate variables: Although the focus of the project is on temperature related extremes, the thermal comfort and heat stress indices are also dependent on other climate elements such as humidity, solar radiation, and wind-speed (Li et al., 2018). This would imply that the selection of reference years need to be made taking into consideration not only temperature extremes, but also the joint extremes of, e.g., high temperatures, high humidity, high solar radiation, and low wind-speeds. Therefore joint extremes of these critical climate variables will be taken into consideration when selecting the reference years. Choice of Extreme Value Distributions (EVDs): Finally, depending on the selected definition of the
extremes, different EVDs such as: Generalized Extreme Value (GEV) for annual maximums, Generalized Pareto Distribution (GPD) for peak-over-threshold extremes can be chosen to fit the extreme values and obtain quantile magnitudes of pre-defined return periods. Sometimes, more than one EVD can be used to fit the same extreme quantiles, and that can introduce another layer of uncertainty in the selection of reference years. For example, Das et al. (2008) simulated extreme precipitation magnitudes by fitting annual maximums using three different distributions commonly used to fit annual precipitation extremes i.e. Gumbel, GEV, and Log-Pearson type 3. They found differences in the performance of the distributions in fitting precipitation extremes and recommended GEV distribution over others for modelling precipitation extremes in the city of London, Ontario. This suggests that the magnitudes of extreme events for pre-selected return periods can also be expected to vary with the distribution pre-selected to fit extreme quantiles.
Table 3. ETCCDI indices recommended for the assessment of climate change impacts on temperature and precipitation extremes (Source: http://etccdi.pacificclimate.org/; Zhang et al. 2011)
S.No Index Details
1 Number of frost days (FD) Annual count of days when daily minimum temperature < 0ºC
2 Number of summer days (SU) Annual count of days when daily maximum temperature > 25ºC
3 Number of icing days (ID) Annual count of days when daily maximum temperature < 0ºC
4 Number of tropical nights (TR) Annual count of days when daily minimum temperature > 20ºC
5 Growing season length (GSL) Annual count between first span of at least 6 days with daily mean
temperature >5ºC and first span after July 1st of 6 days with TG<5ºC
6 Monthly maximum value of daily maximum temperature (TXx)
-
7 Monthly maximum value of daily minimum temperature (TNx)
-
8 Monthly minimum value of daily maximum temperature (TXn)
-
9 Monthly minimum value of daily minimum temperature (TNn) -
10 Percentage of days when TN < 10th percentile (TN10p) -
11 Percentage of days when TX < 10th percentile
12 Percentage of days when TN > 90th percentile
13 Percentage of days when TX > 90th percentile
14 Warm spell duration index (WSDI) Annual count of days with at least 6 consecutive days when TX > 90th percentile
15 Cold spell duration index (CSDI) Annual count of days with at least 6 consecutive days when TN < 10th percentile
16 Daily temperature range (DTR) Monthly mean difference between TX and TN
17 Monthly maximum 1-day precipitation (Rx1day) -
18 Monthly maximum consecutive 5-day precipitation (Rx5day) -
19 Simple precipitation intensity index (SDII) -
20 Annual count of days when precipitation ≥ 10mm (R10mm) -
21 Annual count of days when precipitation ≥ 20mm (R20mm) -
22 Annual count of days when PRCP≥ nnmm, nn is a user defined threshold (Rnnmm)
-
23 Maximum length of dry spell (CDD) Maximum number of consecutive days with daily precipitation < 1mm
24 Maximum length of wet spell (CWD) Maximum number of consecutive days with daily precipitation ≥ 1mm
25 Annual total PRCP when RR > 95th percentile of precipitation on wet days (R95pTOT)
-
precipitation on wet days (R99pTOT)
27 Annual total precipitation in wet days (PRCPTOT) -
5. EXTREME HEAT EVENTS (EHE)
5.1 D
EFINITIONExtreme heat events (EHE; also dubbed heat waves) are the result of the natural variability of climate
exacerbated by global climate warming (IPCC, 2014). Extreme heat events are characterised by their intensity, duration and frequency of occurrence. The EHE characteristics are very important in studies that evaluate the risks of EHE. A proper definition of EHE that incorporates the EHE characteristics is also necessary to properly assess the health effects arising from exposure to elevated temperatures (Xu et al., 2017). From the climate perspective, an EHE is vaguely defined as a rare event that occurs at a particular place over a particular period of time (IPCC, 2014; NASEM, 2016). The word ‘rare’ inherently refers to the event relative intensity as compared to the reference average intensity over the period of time being considered (e.g., months, seasons) at the locality. The EHE intensity is expressed in temperature (e.g., daily maximum, minimum or average temperature), or a combination of temperatures and other confounding climate variables (e.g., relative humidity, wind speed, solar radiation or other relevant climate parameter). The event duration, be it days or weeks, is not specified in this definition. For practical applications there is no specific definition of EHE which is accepted worldwide (WHO, 2009; Gachon et al., 2016; EPA, 2016). The challenge resides particularly in the selection criteria of the threshold values of intensity and event duration. The event frequency is, however, statistical and computed as the inverse of the probability of occurrence (or cumulative frequency distribution) of the intensity variable and the specified threshold value (see Figure 3). The duration is also indirectly included in the probability density of the threshold value. For example a long EHE with a constant intensity would have a higher probability density than the same event that occurs over a shorter period of time. In other words, an event with a threshold value of a given percentile would have the same effect as an event with a lower percentile but with a higher threshold value. The product of the EHE intensity and duration indicates the severity of EHE. For public warning against EHE, the duration of EHE should therefore be specified to reflect the accuracy of the weather forecast to avoid false positives. Weather forecasts of more than three days are usually not accurate (Gachon et al., 2016). Given this challenge, the climate and health organisations and scientific communities have used various definitions of EHE (Vaidyanathan et al., 2017; EPA, 2016; Gachon et al., 2016). These definitions may be grouped into three categories: climate (or meteorological) based, impact based or a combination of climate and impact based definitions. For all definitions, the EHE duration is arbitrarily fixed to two or more days.
The climate based definitions express the intensity as a function of the climate variables with thresholds that can be absolute or relative, or a combination of both. The EHE intensity uses the maximum daily temperature, minimum daily temperature, average daily temperature, or combination of the daily temperatures (Met Office, 2015; Laaidi et al., 2012; Medina-Ramon and Schwartz, 2007). The absolute thresholds (e.g., maximum
temperature of 29°C to 40°C) are determined from historical climatology (over a 30 year period), and their corresponding frequencies of occurrence are computed from the probability density distribution (NASEM, 2016). The relative thresholds are arbitrarily chosen from either the percentile of exceedance (e.g., 90th to 99th; WHO, 2009) or deviation from the historical mean value (e.g., 5°C to 10°C). The disadvantage of the absolute threshold method is that the thresholds are fixed for any climate and therefore the acclimatization of the population to warm events is not considered. Similarly, for the relative threshold method, which can be applied to any climate, there is no fixed percentile from which EHE and their effects can be discerned that would work for any given climate. Due to these limitations, alternative definitions for EHE use a combination of absolute and relative thresholds for a particular location (Guo et al., 2017). Recently, Russo et al. (2015, 214) developed a new heat wave
magnitude index daily (HWMId) that combines the magnitude and duration of a heat wave in any climate for a given location. The index defines the heat wave as an event that occurs over at least three days with daily maximum temperatures above the 90th percentile. The magnitude of the heat wave is computed as the ratio between the difference in the daily maximum temperature and its 25th percentile over the difference between the 75th and 25th percentiles. The percentile is computed using the reference historical data for 1981-2010. HWMId is computed as the sum of the heat wave magnitudes over the number of days of each month for the reference period. The index was applied to Europe and produced the known heat waves that occurred over past decades back to 1950.
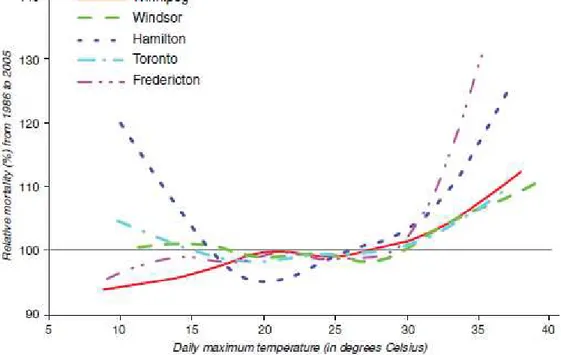
The impact-based definitions of EHE are based on the effects of EHE on the comfort and health of the population. Indices for physiological heat stress together with epidemiological studies on all-cause (non-accidental) mortality data are used to establish the thresholds for the EHE intensity. Mortality–based EHE intensity uses the daily maximum temperature, daily average temperature, or combination of daily maximum or average and minimum temperature (Gachon et al., 2016). The threshold values are chosen to correspond to the onset of excess mortality above the seasonal average (Hajat and Kosatky, 2010; Zeng et al., 2016). Various threshold values are therefore determined depending on location, delineating the variability of mortality data with the local climate and vulnerability of the population to EHE (see Figure 4). This approach is, however, not accurate in delineating EHE due to many reasons (EPA, 2006; Cheng and Berry, 2013): (1) not any lethal temperature is an EHE; in fact lethal temperatures that are not associated with EHE frequently occur (Mora et al., 2017); (2) The actual exposure temperature within a building is different from the outside environment given the fact that most people spend up to 90% of their time indoors (IOM, 2011); Information given in (1) and (2) might explain why some mortality studies found that the onset of excess mortality occurred at temperatures at the limit between thermal comfort and discomfort (25 to 28°C), particularly in cold or temperate climates (Casati et al., 2013); (3) Mortality has many confounding variables such as population vulnerability (e.g. sex, age, prior
illnesses, socioeconomic status), usage of air conditioning, and degree of air pollution; it is therefore very difficult to isolate the effect of outdoor temperature on mortality given the occurrence of an EHE.
Physiological thresholds for heat stress use the universal thermal comfort and heat stress metrics to establish the limit when EHE are perceived as warm, hot, very hot, or become dangerous to health (Chindapol et al.,
2017; Blazejczyk et al., 2012). These indices are based on the heat balance of a human body. Thermal comfort indices are subjective (based on the average votes of a large population) and include the popular Fanger’s Predicted Mean Vote (PMV) index and the adaptive comfort for naturally ventilated buildings
(ASHRAE, 2017). There are over a hundred metrics for heat stress (Epstein and Moran, 2006), and these are either subjective (based on the PMV scale) or purely physiological (e.g., thresholds of skin wettedness, skin and rectal temperatures, and sweat rate). Some of the most commonly used indices include the Standard Effective Temperature (SET), Perceived Temperature (PT), Effective Temperature (ET), Physiological
Equivalent Temperature (PET), and Universal Thermal Climate Index (UTCI). Various thresholds for EHE are thus established according to the human body model that varies from a simple one node model (Fanger’s single skin temperature) to more complicated multi-nodes models. These models are, however, developed for healthy and average adult people, and therefore cannot be applied to vulnerable populations (e.g. children, seniors, sick people). Furthermore, the newly developed models for healthy individuals (such as UTCI, PET, and others) still need further work to these being generalized for use in different climates.
The EHE definition that combines the climate and impact based thresholds (also called bio-meteorological) usually use a combination of weather variables (e.g. temperature, relative humidity, wind speed, solar radiation) into an empirical index that relates to an individuals’ perceived heat. Such indices include Apparent Temperature (AT), Humidex (H), Heat Index (HI), Discomfort Index (DI), and Wet Bulb Globe Temperature (WBGT). Details of these indices are found in Section 6 of this report. Absolute or relative thresholds of these indices (based on percentiles) are used to discern EHE and their effects on human health.
The forgoing analysis shows that a universal definition and metric for EHE is a complex matter to determine given the fact that EHE are transient in nature and their effects on human comfort and health depend on the previous (e.g., nighttime) and actual exposure to the thermal conditions, and are confounded by many climate and non-climate factors. It is, however, well known that the physiological acclimatization of individuals to climate and the effects of temperature on human comfort and health are well established, particularly for healthy individuals. As human health is affected by absolute temperatures, this suggests that that the human heat balance is likely the right approach to establishing universal absolute temperature thresholds for the definition of EHE for any climate and that accounts for climate adaptation. Threshold temperatures may be determined from laboratory or field studies to cover healthy and vulnerable population categories. While comfort and health metrics for healthy individuals are available those for vulnerable people have yet to be developed. Results from recent encouraging studies (Rida et al., 2014; Ma et al., 2017) indicted that heat balance models have been developed for the elderly that account for age, gender and ethnicity whereas thresholds(or scales) for heat induced stress of vulnerable people have not yet been developed.
Given the absence of proper comfort and heat-stress health metrics for vulnerable people, climate and health organisations around the world and local jurisdictions have adopted EHE definitions that are based on the local prevailing climate and population vulnerability (EC, 2018; EPA, 2016; WHO, 2009). To issue public warnings regarding heat waves in various provincial climatic regions Environment Canada (EC) has adopted the metrics
of Humidex, daily maximum temperature, or combination of the daily maximum and minimum temperatures
(EC, 2018). Table 4 summarizes EC’s heat definition and heat warning thresholds.
Figure 3. Temperature distribution of climate (30 year period) and extreme heat events
Figure 4. Non-traumatic mortality-temperature profiles during the summer seasons (June-August) of 1986-2005 for selected Canadian cities (Source: Casati et al., 2013)
0 Pr ob a b ility Density Temperature Historical Future Mean Cold Hot Warmer future climate Hotter Extreme Threshold