HAL Id: hal-01621291
https://hal.archives-ouvertes.fr/hal-01621291
Submitted on 4 May 2018HAL is a multi-disciplinary open access archive for the deposit and dissemination of sci-entific research documents, whether they are pub-lished or not. The documents may come from teaching and research institutions in France or abroad, or from public or private research centers.
L’archive ouverte pluridisciplinaire HAL, est destinée au dépôt et à la diffusion de documents scientifiques de niveau recherche, publiés ou non, émanant des établissements d’enseignement et de recherche français ou étrangers, des laboratoires publics ou privés.
of the western Mediterranean Sea.
Javier Castro-Jimenez, Badreddine Barhoumi, Andrea Paluselli, Marc Tedetti,
Begoña Jiménez, Juan Muñoz-Arnanz, Henri Wortham, Mohamed Ridha
Driss, Richard Sempere
To cite this version:
Javier Castro-Jimenez, Badreddine Barhoumi, Andrea Paluselli, Marc Tedetti, Begoña Jiménez, et al.. Occurrence, loading and exposure of atmospheric particle-bound POPs at the African and European edges of the western Mediterranean Sea.. Environmental Science and Technology, American Chemical Society, 2017, 51 (22), pp.10.1021/acs.est.7b04614. �10.1021/acs.est.7b04614�. �hal-01621291�
Environmental Science & Technology is published by the American Chemical Society. 1155 Sixteenth Street N.W., Washington, DC 20036
at the African and European edges of the western Mediterranean Sea
Javier Castro Jiménez, Badreddine Barhoumi, Andrea Paluselli, Marc Tedetti, Begoña Jiménez, Juan Muñoz-Arnanz, Henri Wortham, Mohamed Ridha Driss, and Richard Sempéré
Environ. Sci. Technol., Just Accepted Manuscript • DOI: 10.1021/acs.est.7b04614 • Publication Date (Web): 20 Oct 2017
Downloaded from http://pubs.acs.org on October 20, 2017
Just Accepted
“Just Accepted” manuscripts have been peer-reviewed and accepted for publication. They are posted online prior to technical editing, formatting for publication and author proofing. The American Chemical Society provides “Just Accepted” as a free service to the research community to expedite the dissemination of scientific material as soon as possible after acceptance. “Just Accepted” manuscripts appear in full in PDF format accompanied by an HTML abstract. “Just Accepted” manuscripts have been fully peer reviewed, but should not be considered the official version of record. They are accessible to all readers and citable by the Digital Object Identifier (DOI®). “Just Accepted” is an optional service offered to authors. Therefore, the “Just Accepted” Web site may not include all articles that will be published in the journal. After a manuscript is technically edited and formatted, it will be removed from the “Just Accepted” Web site and published as an ASAP article. Note that technical editing may introduce minor changes to the manuscript text and/or graphics which could affect content, and all legal disclaimers and ethical guidelines that apply to the journal pertain. ACS cannot be held responsible for errors or consequences arising from the use of information contained in these “Just Accepted” manuscripts.
Occurrence, loading and exposure of atmospheric particle-bound POPs at the
1
African and European edges of the western Mediterranean Sea
2
3
Javier Castro-Jiménez1*, Badreddine Barhoumi2, Andrea Paluselli1, Marc Tedetti1,
4
Begoña Jiménez3, Juan Muñoz-Arnanz3,Henri Wortham4, Mohamed Ridha Driss2,
5
Richard Sempere1
6
7
1
Aix Marseille Univ, University de Toulon, CNRS, IRD, MIO UM 110, Marseille,
8
France.
9
2
Laboratory of Heteroatom Organic Chemistry, Department of Chemistry, Faculty of 10
Sciences of Bizerte, University of Carthage, Tunisia
11
3
Department of Instrumental Analysis and Environmental Chemistry, Institute of
12
Organic Chemistry (IQOG-CSIC), Madrid, Spain
13
4
Aix-Marseille University, CNRS, Laboratory of Environmental Chemistry (LCE),
14
Marseille, France
15
*Corresponding author. Phone: +33(0)486090524;
16
E-mail: javier.castro-jimenez@mio.osupytheas.fr
17
Abstract
19
A comparative study for 62 toxic chemicals based on the monthly collection of aerosol
20
samples during 2015-2016 in two coastal cities at both the African (Bizerte, Tunisia)
21
and European (Marseille, France) edges of the W Mediterranean basin is presented.
22
Legacy polychlorinated biphenyls (Σ18PCBs) and polychlorinated dibenzo-p-dioxins
23
and dibenzofurans (Σ17PCDD/Fs) show generally higher median levels at the African
24
edge (2.1 and 0.2 pg m-3, respectively) compared to the European coastal site (1.0 and
25
0.08 pg m-3, respectively). Contrary, the “emerging” polybrominated diphenyl ethers
26
(Σ27PBDEs) median concentrations were higher in Marseille (~ 9.0 pg m-3) compared to
27
Bizerte (~ 6.0 pg m-3). Different past usage and current emission patterns were found at
28
both edges of the W Mediterranean, most probably linked to the respective different
29
regulatory frameworks for toxic chemicals. Our results indicate that the total organic
30
carbon (TOC) and/or the elemental carbon (EC) contents in the atmospheric aerosol
31
may have a stronger effect than the total suspended particle (TSP) content as a whole on
32
the spatial-temporal variability and the long-range atmospheric transport potential of the
33
studied POPs. A “jumping” of the PBDE local atmospheric stocks from the NW
34
European Mediterranean edge to the NW African coast seems to be possible under
35
favorable conditions at present. While a higher PBDE median loading is estimated for
36
Marseille area (~ 550 ng m-2 y-1) compared to Bizerte (~400 ng m-2 y-1), the median
37
PCB and PCDD/F dry deposition fluxes were higher at the African site, resulting in a
3-38
fold higher toxic equivalent (TEQ) loading of dioxin-like pollutants (400 pg TEQ m-2 y
-39
1
) compared to Marseille (~140 pg TEQ m-2 y-1) with potential implications for the
40
aquatic organisms. However, the inhalation exposure assessment points to a minimum
41
risk for human health at both sites.
42
Keywords:
44
PCB, flame retardant, dioxin, marine pollution, environmental risk
45 46 TOC art 47 48 49
Introduction
50
51
Atmospheric particulate matter has been recognized as a major environmental airborne
52
pollutant impacting human health and ecosystems.1 A recent study performed in the
53
Mediterranean Sea supports the hypothesis that atmospheric aerosols can elicit a
54
number of toxic effects in marine organisms due to the presence of hydrophobic
55
contaminants intimately associated to the atmospheric particle phase.2 High molecular
56
weight (HMW) polycyclic aromatic hydrocarbons (PAHs) and generally persistent
57
organic pollutants (POPs) such as polychlorinated dibenzo-p-dioxins and dibenzofurans
58
(PCDD/Fs) and polychlorinated biphenyls (PCBs) are among the contaminants
59
suspected to produce these hazardous effects.2 In addition, POPs associated to the
60
atmospheric particle phase can be more resistant to atmospheric degradation processes
61
(e.g. photodegradation) increasing therefore their atmospheric residence times,
62
subsequent long-range atmospheric transport (LRAT) and potential expossure.2 A first
63
step in order to elucidate the potential role of particle-bound POPs in toxic pathways
64
and to estimate their atmospheric dry deposition, considered as the main vector for the
65
introduction of the most hydrophobic contaminants in aquatic ecosystems, is their
66
accurate qualitative (congener specific distribution) and quantitative (environmental
67
concentration) determinations in the atmospheric aerosol. The legacy PCDD/Fs and
68
PCBs may lead to complex mixtures in the environment. However, the seventeen
69
2,3,7,8-chlorine substituted PCDD/Fs (i.e. seven PCDDs or “dioxins” + ten PCDFs or
70
“furans”) and the twelve dioxin-like PCBs (DLPCBs) named CBs81, 77, 105, 114,
-71
118, -123, -126, -156, -157, -167, -169, -189, jointly considered as dioxin-like
72
pollutants, have received most of the attention due to their accumulation and toxic
73
effects in biota and humans.3-6 In addition, a set of non-dioxin-like PCBs, commonly
referred as indicator PCBs (IDPCBs), containing CBs-28, -52, -101, -138, -153 and -180
75
are often monitored due to their higher environmental concentrations and potential toxic
76
effects by different mechanisms of action.7-9 Other POPs with recognized toxicity too,
77
such as polybrominated diphenyl ethers (PBDEs) can add up to the
“contaminant-78
aerosol cocktail”.10,11 These pollutants have different sources in the environment.
79
PCDD/Fs can occur as unintentional by-products in a number of industrial processes
80
and domestic heating,12,13 while current emissions of PCBs are urban/industrial centers,
81
open burning of products containing PCBs, waste incinerations, accidental fires and
re-82
volatilization from environmental reservoirs.14,15 PBDE were mostly used (and still used
83
in some regions) as flame retardants and, contrary to PCDD/Fs and PCBs, are
84
considered as a first generation of “emerging contaminants” (only recently restricted).
85
Three PBDE commercial formulations were extensively used worldwide: the
penta-86
formulation (with predominance of BDE-47 and -99), the octa-BDE (with PBDE-183 as
87
one of the major components) and the deca-BDE (with BDE-209 predominating).16
88
These contaminants are globally banned by the Stockholm Convention of POPs
89
(including all PBDE formulations) and regulated by the Water and Marine Strategy
90
Framework Directives at European level (except for the octa- and deca-PBDE
91
formulations). However, still very little or no information exists on current base line
92
levels and stocks for many marine areas, even in environments under important
93
anthropogenic pressure like the Mediterranean Sea. This semi-enclosed environment of
94
high ecological and socio-economic relevance is largely impacted by POPs and related
95
contaminants.17,18,19 PCDD/Fs, PCBs and PBDEs are among the POPs found in the
96
atmospheric compartment from various NW Mediterranean coastal environments (from
97
rural to large cities),20-26 and the central/Eastern basin27-33, but also farther from the
98
coast in the entire Mediterranean Sea.34-36 The European Mediterranean coast is by far
the most studied and only few measurements (focussing in the SE Mediterranean) have
100
been carried out in the African Mediterranean edge. 37,38. The atmospheric occurrence of
101
POPs over the NW Mediterranean African coast still largely unknown. In addition,
102
parallel observations at both the African and European margins of the Mediterranean
103
Sea have never been attempted to the best of our knowledge.
104
We report here results from 22 aerosol samples (total suspended particles, TSP)
105
simultaneously collected (once per month) in two urban coastal sites at both the African
106
and European edges of the W Mediterranean. The samples have been analysed for 62
107
toxic chemicals associated to the atmospheric aerosol. The main objectives of this study
108
are: (1) to establish base line atmospheric levels of three of the most toxic POPs
109
families (i.e. PCDD/Fs, PCBs, and PBDEs) in two reference urban coastal sites in the
110
European and African W Mediterranean and (2) to compare the status of pollution, to
111
estimate the atmospheric loading and potential exposure of those chemicals at both
112
edges of the W Mediterranean coast.
113
114
Materials and Methods
115
116
Sampling and study areas 117
118
Atmospheric aerosols samples (TSP) were simultaneously collected from March 2015
119
to January 2016 in two representative coastal locations under strong anthropogenic
120
pressure at both the African and European W Mediterranean Sea edges: the cities of
121
Bizerte (Tunisia) and Marseille (France) (Figure S1). The air was drawn through
pre-122
combusted quartz fiber filters (QFFs) placed in high volume air samplers (Tisch
Environmental, Inc, USA). The sampling volume raged from ~ 1800 to ~5000 m3
124
depending on the site and sampling event (Table S1).
125
126
Marseille: Samples were collected at the roof (~10m AGL) of the Endoume Marine 127
Research Station (43° 16' 49.90'' N, 5° 20' 57.32'' E) located at the water front and
128
around 4 km from the city center and the Marseille maritime terminal. Marseille can be
129
considered as a NW large coastal city of the Mediterranean basin (~1 million
130
inhabitants), inducing important car traffic and biomass burning. A detailed area
131
description has been reported elsewhere. 39-41 Briefly, Marseille hosts one of the most
132
important ports of the Mediterranean Sea (~88 million tonnes of goods handled per
133
year) and stands in the vicinity (40 km SE) of the large petrochemical and industrial
134
complex of Fos-Berre area (e.g. petroleum refining, cement factory, waste combustion
135
units, metallurgical industries). The region is well known for its intense photo-oxidative
136
pollution episode42,43 and several characteristic wind patterns, generally below 5m s−1,
137
except during the Mistral events (NW strong wind, 20-30 m s-1) which are frequent in
138
the area (100 days/year) (Figure S1)
139
140
Bizerte: Sampling was conducted on the roof top (~8 m AGL) of the Faculty of Science 141
of Bizerte (37° 16' 0.5802'' N, 9° 52' 49.875'' E) around 1 km far from the city center,
142
close to the Gulf of Bizerte shoreline and Bizerte lagoon water front (Figure S1). A
143
detailed sampling description is offered elsewhere. 44 Briefly, Bizerte is a medium-size
144
city (~127 000 inhabitants), located in the north of Tunisia, between the Mediterranean
145
Sea and the Bizerte lagoon. Even if agriculture and fishery activities are important in the
146
area, a considerable number of light and heavy industries (i.e., cement, plastic, textile,
147
mechanic and electronic, iron and steel metallurgy, petroleum refining and lubricants)
are present in the area. 44 Average temperature of 22 °C, with hot summer and mild
149
spring, frequent (200 days per year) NW winds (average speed of 6–8 m s-1) and
150
precipitation episodes mostly in fall and winter months, characterized the climate of
151 Bizerte area. 44 152 153 Sample processing 154
QFFs were lyophilized, weighed, and spiked with a suit of PCDD/Fs, PCBs, and PBDEs
155
13
C-labeled standards prior to Soxhlet extraction (24h) with a n-hexane: DCM (9:1)
156
mixture. Extracts were rota-evaporated and cleaned-up by using the “Dioxin Prep
157
System-Florisil Version” (Supelco, Bellefonte, PA, USA). PCBs and PBDEs were
158
collected in a first fraction by elution (100 mL of n-hexane) of the multilayer silica gel
159
column coupled to a florisil column and a subsequent elution (40 mL of DCM) of only
160
the multilayer silica gel column (prior removal of the florisil column). PCDD/Fs were
161
obtained in a second fraction by elution of the florisil column with 50 mL of DCM.
162
Final extracts were rota-evaporated to ~ 1 mL, transferred to vials, and dried under a
163
gentle nitrogen steam. Fractions were reconstituted in a few microliters of the respective
164
PCDD/F, PCB, and PBDE 13C-labeled injection standards prior to instrumental analysis
165 (Text S1). 166 167 Instrumental Analysis 168 169
Samples were analysed for 17 PCDD/Fs (congeners 2,3,7,8-susbtituted), 18 PCBs (12
170
DLPCBs+6IDPCBs) and 27 PBDEs (Text S1). Quantification was carried out by isotopic
171
dilution according to 1613 US EPA method45 on a gas chromatograph (Trace GC ultra,
Thermo Fisher Scientific, Milan, Italy) coupled to a high resolution mass spectrometer
173
(DFS, Thermo Fisher Scientific, Bremen, Germany). The injection temperature was 260
174
ºC and 1 µL of extract was injected (splitless mode). GC separation of PCBs and
175
PCDD/Fs was achieved using a 60 m × 0.25 mm × 0.25 µm DB-5MS column (Agilent
176
J&W, USA), while a 15 m × 0.25 mm × 0.10 µm Rxi®-5Sil MS column (Restek, USA)
177
was used for PBDEs. Different oven temperature programs were used for each family of
178
analytes (Table S2). Positive electron ionization (EI+) was used operating in selected
179
ion monitoring (SIM) mode at 10,000 resolving power.
180
181
Quality assurance / quality control (QA/QC) 182
183
Clean QFFs were individually wrapped in aluminum foil, baked at 450 ºC overnight,
184
weighted and then stored at -20 oC in double sealed plastic bags until used. Field blanks,
185
consisting on baked QFFs transported to the sampling area, mounted in the sampler, and
186
dismounted, were collected at both sites, stored and analysed concurrently with the
187
samples. After sampling, QFFs were wrapped in aluminium foil again and stored in the
188
dark at -20°C. Blank levels were generally low for the three POP classes compared to
189
their concentrations in the samples, ranging from 0.02 to 3.5 pg (PCDD/Fs), from not
190
detected (n.d.) to 150 pg (PCBs), and from n.d. to 530 pg (PBDEs) depending on the
191
congener and sample (Table S3). Laboratory blanks (1 blank per five-sample batch)
192
showed lower or similar levels to field blanks, so no contamination during sampling,
193
storage and analysis occurred. Results were blank corrected. Chromatographic peaks
194
were only considered when the ratio between the two monitored ions was within ±15%
195
of the theoretical value, and the signal-to-noise (S/N) ratio>3 (instrumental limit of
detection, LOD). Limits of quantification (LOQs) corresponded to S/N≥10. Calibration
197
curves were daily checked. Median LODs ranged from ~ 0.3 to ~ 1.1 pg (PCDD/Fs),
198
from 2.1 to ~ 8.3 pg (PCBs) and from ~ 1.1 to 32.5 pg (PBDEs) depending on the
199
compound and sample (Table S4). Median method recoveries
(extraction-cleanup-200
analysis) varied from 70 to 97 % (PCDD/Fs), from 83 to 110 % (PCBs) and from 60 to
201
120 % (PBDEs) (Table S5). Results were corrected by recoveries. 202
203
TOC, EC determinations and statistical analysis 204
205
Total organic carbon (TOC) content was determined in filter subsamples by high
206
temperature combustion (CHN analyser).46 For the elemental carbon (EC)
207
determination, additional filter sub-samples were pre-combusted at 340 °C during 2 h
208
under oxygen flow47 and then analysed as above indicated. STATA/SE 12.1 software
209
was employed for the statistical data analysis.
210
211
Results and discussion
212
213
Concentrations in the atmospheric aerosol
214
215
Dioxin-like POPs 216
217
∑2,3,7,8-PCDD/F concentrations in the aerosols over Bizerte area (Tunisia) ranged
218
from 32 to 1100 fg m-3 (222 fg m-3, median) along the sampling period and were
219
generally higher than those over Marseille coastal area (France), varying from 31 to
220
1280 fg m-3 (83 fg m-3, median) (Figure 1A). The highest differences were found for the
months of April, July and September 2015 (3, 11, ~5-fold higher levels in Bizerte,
222
respectively). However, these values were not significantly different (Mann-Whitney
223
test, p=0.28) for the sum of 2,3,7,8-PCDD/Fs most probably due to the high annual 224
variability, in particular in Bizerte site, and the limited number of samples analysed.
225
Significant differences were only found for two furan congeners (i.e.
2,3,4,6,7,8-226
HxCDF and 1,2,3,4,6,7,8-HpCDF) (Mann-Whitney test, p=0.04) (Figure S2, Table S6). 227
A general trend showing higher PCDD/F levels in the coldest months of the year was
228
observed at both sites. This effect has been previously reported in other Mediterranean
229
coastal areas and has been attributed to the combined effect of the increase of diffusive
230
combustion sources (e.g. domestic heating and road traffic) and a less efficient
231
dispersion of the local emissions during cold conditions. 23
232
The ∑2,3,7,8-PCDD/F was clearly dominated by the contribution of PCDDs in
233
Marseille whereas a more even contribution of PCDDs and PCDFs was found for the
234
aerosols of Bizerte area (Figure 1A), pointing to different PCDD/F sources at both sites.
235
This is the first time that PCDD/Fs have been measured in atmospheric aerosols from
236
the Marseille area and in a coastal site at the African Mediterranean edge. The
237
concentrations found at both sites are within the range of those previously reported for a
238
coastal area in the Gulf of Lion (50-1500 fg m-3)23, urban/industrial sites from
239
Barcelona area (570-1162 fg m-3)24 and in the open NW Mediterranean (94-990 fg m-3).
240
35
Reported values from a cruise transect close to the NW Mediterranean African coast
241
(38 fg m-3) are lower than those measured in Bizerte coastal area. 35 Concentrations
242
measured in a background site in Barcelona area (230 fg m-3) are lower too than those in
243
Marseille24. No data for comparison was found in the central/eastern Mediterranean Sea.
244
Recent PCDD/F measurements carried out in the atmospheric aerosol over remote areas
from the Atlantic, Pacific and Indian oceans revealed 6 to 11-fold lower background
246
levels (5 to 113 fg m-3).48
247
248
The ∑18PCB concentrations measured in the aerosols from Bizerte, ranging from 0.7 to
249
~4.0 pg m-3 (2.1 pg m-3, median) were significantly higher (Mann-Whitney test, p=0.03) 250
than those measured in the aerosols over Marseille, which varied from 0.5 to 2.7 pg m-3
251
(1.0 pg m-3, median). IDPCBs dominated the total levels at both sites with ∑IDPCB
252
concentrations significantly higher too in Bizerte (0.6 to 3.4 pg m-3, median value of ~
253
2.0 pg m-3) than in Marseille (0.3 to 1.8 pg m-3, median value of 0.8 pg m-3)
(Mann-254
Whitney test, p=0.01) (Figure 1B). ∑DLPCB concentrations, which represented a minor
255
contribution to the total PCB atmospheric stock at both sites, were not statistically
256
different (0.1 - 0.5 pg m-3 in Bizerte compared to 0.1 - 0.8 pg m-3 in Marseille).
257
However, the concentrations of some of the most toxic DLPCBs (i.e. CB-81, -126, -169)
258
as well as the CBs-167, -189 were significantly higher in Bizerte than in Marseille
259
coastal area (2-4 fold-higher median values depending on the congener) (Figure S3,
260
Table S7).
261
∑18PCB (and ∑IDPCB) concentrations exhibited different annual trends in both sites.
262
While a general increase of concentrations was observed in winter months compared to
263
spring and summer in Marseille, a more pronounced seasonality was observed for
264
Bizerte, showing clearly higher concentrations in spring-early summer and late
autumn-265
winter months, with minimum levels in August, September and October (Figure 1B). As
266
a result, 2 to 8-fold higher ∑18PCB levels were measured in Bizerte than in Marseille
267
from March to July while the concentration differences between the two sites in winter
268
months were less important, and in some months (e.g. November) higher for Marseille.
269
Interestingly, higher ∑DLPCB concentrations were generally measured from August
2015 to January (except in December) in Marseille. These facts highlight the differential
271
environmental behaviour, seasonality and related exposure of individual PCBs at both
272
sites.
273
PCB data comparability may be tricky since different number and type of PCBs may be
274
considered. Therefore, for comparative purposes we focus only on IDPCBs. ΣIDPCB
275
concentrations measured at both edges of the NW Mediterranean Sea were generally
276
lower than previous coastal measurements performed in the NW Mediterranean in the
277
Gulf of Lion (0.5 to 7.2 pg m-3)23,26 and those carried out close to Barcelona area (9 - 26
278
pg m-3).26 Cruise measurements encompassing the Mediterranean Sea and the SW Black
279
Sea in 2006 and 2007 revealed higher concentrations too for ΣIDPCB (0.4-18 pg m-3),
280
but PCB-118 was included in the sums.36 However, concentrations measured in Bizerte
281
and Marseille were generally higher that those reported for a coastal site (considered as
282
a background location) in the Eastern Mediterranean27 consistent with previous studies
283
indicating higher PCB levels in the W Mediterranean.36 Most of the previous studies
284
correspond to measurements performed more than a decade ago (as for PCDD/Fs) so
285
comparison must be done carefully. Particle-bound PCBs have received little attention
286
since then in the Mediterranean basin compared to gas phase PCBs, most probably due
287
to the dominant role of vapor PCBs driving total PCB ambient levels (especially for low
288
MW congeners) and the increasing applications of passive sampling techniques to POP
289
atmospheric measurements. Thus, recent studies in the Mediterranean Sea considered
290
only the gas phase or the assemble gas+particle phases. 32,33 ∑DLPCB background
291
measurements in the atmospheric aerosol over remote areas from the Atlantic, Pacific
292
and Indian oceans revealed up to 500-fold lower levels (1 - 2675 fg m-3).48
293
These figures confirmed that the NW Mediterranean Sea is considerably exposed to
294
dioxin-like POPs, and might act in turn as a potential secondary source, in particular of
PCBs, for other Mediterranean regions (less exposed) and for the most pristine areas of
296
the major oceans of the Earth. It has been reported that the principal control on the
297
levels of legacy POPs in active circulation in the global environment is currently in a
298
state of transition (from primary to secondary source control).14 The role of the NW
299
Mediterranean Sea (and other similar impacted marine areas) as potential secondary
300
sources at present remains uncertain and requires further investigation.
301 302 0 500 1000 1500 2000 2500 3000 3500 4000 4500 ∑PCBs ∑ID-PCBs ∑DL-PCBs ∑PCBs ∑ID-PCBs ∑DL-PCBs
C
o
n
ce
n
tr
a
ti
o
n
(
fg
m
-3)
MA BZB
0 200 400 600 800 1000 1200 1400Mar.15 Apr.15 May.15 Jun.15 Jul.15 Aug.15 Sep.15 Oct.15 Nov.15 Dec.15 Jan.16 ΣPCD/Fs ΣPCDDs ΣPCDFs ΣPCD/Fs ΣPCDDs ΣPCDFs MA BZ
A
0 10000 20000 30000 40000 50000 60000 ∑27PBDEs BDE-209 ∑27PBDEs BDE-209C
MA BZFigure 1. Temporal variability of PCDD/F (A), PCB (B) and PBDE (C) concentrations
303
in atmospheric aerosols over Marseille (MA) and Bizerte (BZ) coastal areas from March
304 2015 to January 2016. 305 306 PBDEs 307 308
Σ27PBDE concentrations were generally higher than dioxin-like POPs (in particular
309
compared to PCDD/Fs) at both sites. Levels in the aerosol from Bizerte ranged from 1.0
310
to 54.0 pg m-3 (~ 6.0 pg m-3, median), while in Marseille varied from 2.2 to 17.6 pg m-3
311
(~ 9.0 pg m-3, median) (Figure 1C). A general trend of higher levels in Marseille area
312
was found, with the exception of the samples collected in spring in Bizerte, in particular
313
the one of March 2015 (which exhibited 3 to ~50-fold higher PBDE levels than the rest
314
of samples collected in Bizerte). This concentration peak can be attributed to an unusual
315
higher concentration of medium-high MW PBDEs in that sample compared to the
316
others, in particular BDE-183 (Table S8), likely due to the combined effect of the air
317
mass back trajectories (BTs) and potential local sources during this sampling event (see
318
discussion below). However, the concentrations at both sites did not show a statistical
319
difference (Mann-Whitney test, p>0.05). Still, some individual congeners exhibited 320
statistical differences but with contrasting trends, like BDE-47 with 3-fold higher
321
median concentrations in Marseille than Bizerte (Mann-Whitney test, p=0.01), while 322
BDE-3, -7, -71, -77, -126, and -156 showing higher levels in the aerosols from Bizerte
323
(p˂0.01 – 0.04) (Figure S4, Table S8). PBDE-209 was the major contributor to the total
324
Σ27PBDE for most of the samples at both sites (Figure 1C).
325
Σ27PBDE concentrations measured in Marseille and Bizerte were generally within the
327
range of those reported for a coastal site in the NW Mediterranean (2-18 pg m-3,
328
Σ8PBDE)23, higher than levels in a coastal background site in central/E Mediterranean
329
(0.5-2 pg m-3, Σ15PBDE)30 but in the lower end of values reported for aerosols collected
330
over large cities in the E Mediterranean like Athens (Greece) (15-23 pg m-3,
331
Σ12PBDE)29 and Izmir (Turkey) (27-62 pg m-3, Σ7PBDE). 38
332
333
POPs patterns in the atmospheric aerosol
334
335
The PCDD/F atmospheric pattern (congener relative contribution) for most of Bizerte
336
samples showed an important contribution of furans, with 1,2,3,4,6,7,8-HpCDF and
337
OCDF accounting for the 16.3±3.7 % and 12.2±7.3 % of the ∑2,3,7,8-PCDD/F, values
338
almost reaching the relative contribution of 1,2,3,4,6,7,8-HpCDD (17.0±4.0 %) and
339
OCDD (25.5±4.5 %) which are the two most abundant PCDDs (Figure 2A-1). However,
340
the PCDD/F pattern in samples from Marseille was dominated by a higher contribution
341
of 1,2,3,4,6,7,8-HpCDD (21.2±6.8 %) and OCDD (53.0±4.0 %) and lower contribution
342
of 1,2,3,4,6,7,8-HpCDF and OCDF accounting for the 5.8±3.0 % and 6.0±2.8 % of the
343
∑2,3,7,8-PCDD/F, respectively (Figure 2A-2). A higher contribution of PCDFs in the
344
PCDD/F atmospheric pattern compared to PCDDs has been associated in previous
345
studies to ‘fresh’ emissions (sources). A situation in which the lower chlorinated
346
congeners, in particular PCDFs, have insufficient time to experience significant
347
atmospheric degradation / depletion processes.23,35,49,50 Contrary, a predominance of
348
higher chlorinated PCDDs and little contribution of PCDFs is considered as a ‘sink’
349
signal where the lighter congeners were ‘weathered’ in their travel from the source to
350
the sampling sites due to atmospheric processes (e.g. photodegradation).
These patterns suggest current local PCDD/F emission in Bizerte in combination with a
352
minor contribution of long/medium-range atmospheric transport of PCDD/Fs to the
353
area. Contrary, the long/medium range atmospheric transport seems to drive the
354
atmospheric occurrence of PCDD/Fs in Marseille area with a minor contribution of
355
local sources. The possibility of short-range atmospheric transport from the adjacent
356
industrial areas (Fos-Berre) to Marseille with known sources of PCDD/Fs (e.g. from
357
incinerators, metallurgical and petrochemical facilities) is not excluded. Nevertheless,
358
because of the surrounding topography of Marseille, bordered by the Mediterranean
359
from the SW and enclosed from N, E and S by mountain ranges up to ~700m ASL,
360
direct transport from the Fos-Berre area to Marseille is rarely observed. Such transport
361
could occur when the wind is a composition of land/sea breeze and light Mistral but the
362
air mass will go towards the sea before to come back to Marseille which corresponds to
363
a half-range atmospheric transport. Furthermore, these wind conditions correspond
364
generally to sunny period inducing strong photochemical processes. 39-41,43
365
366
The PCB atmospheric pattern was dominated in general by the HMW IDPCBs at both
367
sites. A clear predominance of PCB-180 in Bizerte (accounting for the 35.0±8.7 % of
368
the ∑18PCBs) was observed compared to Marseille area (19.2±5.1 % of the ∑18PCBs).
369
A similar pattern was observed in the two sites for DLPCB, but PCB-118 and -105
370
predominated in Marseille (12.6±3.2% and 5.7±1.8%, respectively) compared to Bizerte
371
(4.6±2.0% and 1.9±0.5%, respectively). The different abundance of these three major
372
PCBs may be either the reflect of different past usage of PCB commercial mixtures at
373
both sites or distinct emissions rates to the environment at present. For example,
PCB-374
180 is one of the major constituent of Aroclor 1260 and 1262, while CB-105, 118 were
375
relatively more abundant in the Aroclor 1254 formulation. One of the major uses of
these Aroclor formulations was as industrial oils destined to transformers. 51 It has been
377
very recently reported that a large number of transformers containing PCBs are still
378
used or stored in unsatisfactory conditions in Bizerte area with high probability of oil
379
leaks. 44 This could explain the higher contribution of PCB-180 in Bizerte compared to
380
Marseille.
381
382
383
Figure 2. Average atmospheric pattern (n=11) of PCDD/F (A) and PCBs (B) in
384
Marseille (MA) and Bizerte (BZ) coastal areas. The small figures (1) and (2) show a
385 0 10 20 30 40 50 60 70 0 10 20 30 40 50 60 70 80 SOURCE-BIZERT (n=7) SINK BIZERT (n=4) 0 10 20 30 40 50 60 70 80 SOURCE-MARSEILLE (n=2) SINK - MARSEILLE (n=9)
R
e
la
ti
v
e
d
is
tr
ib
u
ti
o
n
(%
)
0 10 20 30 40 50 MARSEILLE (FR) BIZERT (TN)A
B
1
2
MARSEILLE (FR) BIZERTE (TN) SOURCE-BZ (n=7) SINK-BZ (n=4) SOURCE-MA (n=2) SINK - MA (n=9)focus on the differences in the atmospheric pattern found in Bizerte (dominated by a
386
characteristic “source pattern”, n=7) and in Marseille (dominated by a characteristic
387
“sink” pattern, n=9).
388
389
The predominance of BDE209 was reflected also in the atmospheric congener pattern
390
(Figure 3) accounting for the 72.3±18.6% and 65.5±18.0% of the Σ27PBDE in Marseille
391
and Bizerte, respectively. The important abundance of this BDE denotes the past and
392
maybe current usage of deca-PBDE formulations at both edges of the NW
393
Mediterranean Sea.16 In addition, the predominance of BDE-47 and BDE-99 in the
394
pattern from Marseille samples too, together with their higher abundance (6.8±7.3% and
395
5.3±4.5% for BDE-47 and -99, respectively) compared to the pattern in Bizerte (2.0
396
±1.9 % and 2.8±2.5 % for BDE-47 and -99, respectively), point first to a major usage of
397
penta-PBDE compared to the octa-PBDE formulations in Marseille. Second, to a
398
different emission and usage pattern compared to Bizerte, where a major usage of
octa-399
PBDE formulations may be the most likely scenario represented by a higher BDE183,
-400
206, -207 predominance in Bizerte reaching up to 31.6, 9.1 and 13.8% of the Σ27PBDE,
401
respectively.
402
404
Figure 3. Average atmospheric pattern (n=11) of PBDEs in Marseille and Bizerte
405
coastal areas.
406
407
Factors affecting temporal and spatial variability
408
409
The finest fractions of the atmospheric TSP, like TOC and EC, have been reported to
410
efficiently sorb POPs-like contaminants.29,52-53 Generally higher median concentrations
411
of TSP (66.0 ug m-3), TOC (7.5 ug m-3) and EC (2.0 ug m-3) were measured in the
412
aerosols over Bizerte compared to Marseille area, exhibiting 48.0, 6.4 and 0.9 ug m-3 of
413
TSP, TOC and EC, respectively. However, only significant differences (Mann-Whitney
414
test, p=0.03-0.006) were found for the TSP and EC (Figure S5). No correlations were 415
found for PCDD/F concentrations and TSP levels in any of the sites and only ∑18PCB,
416
∑IDPCBs and one PCB congener correlated (p=0.01-0.04) with TSP concentration in
417
Bizerte (Figure S6). ∑PCDD/F and ∑DLPCB (as well as most of PCDD/Fs and a certain
418
number of DLPCBs) concentrations positively correlated with TOC concentration
419 60 70 80 90 100 MARSEILLE (FR) BIZERT (TN) 0 2 4 6 8 10 12 14 MARSEILLE (FR) BIZERTE (TN)
R
e
la
ti
v
e
d
is
tr
ib
u
ti
o
n
(%
)
MARSEILLE (FR)
BIZERTE (TN)
(p=0.004-0.03) but not with EC levels in Marseille. Only 2,3,7,4-TCDD positively 420
correlated with TOC concentrations in Bizerte and no correlations were observed for
421
DLPCBs and TOC in Bizerte. Interestingly, PCDD/F concentrations were not correlated
422
with EC levels in any of the sites, while ∑DLPCBs, ∑18PCB and ∑IDPCBs were
423
correlated with EC mostly in Bizerte (p=0.002-0.01), most probably due to the higher 424
EC levels in this site. Σ27PBDE concentrations did not significantly correlate with TSP,
425
TOC or EC in any of the sites. However, while only two individual PBDEs correlated
426
with TSP levels (Bizerte) a considerable number of PBDE congeners were correlated
427
with TOC concentrations in Marseille and with EC levels in Bizerte (Figure S7). The
428
fact that PCDD/Fs did not correlate with EC is somehow unexpected since this
429
correlation has been suggested in other atmospheric studies. 54,55 The narrow range of
430
variation of EC concentrations in the samples analysed could have resulted in this lack
431
of correlation. Regarding TOC, the correlations mostly observed for Marseille could be
432
the result of different TOC sources (different sorption properties) in both sites (e.g.
433
more related to urban activities in Marseille and predominantly industrial activities in
434
Bizerte).
435
436
Our results indicate that the TOC and/or EC contents in the atmospheric aerosol may
437
have a stronger effect than the TSP as a whole on the spatial-temporal variability of the
438
studied POPs. Concentrations normalized by TOC slightly decreased the
∑2,3,7,8-439
PCDD/F, ∑18PCB ∑IDPCBs and ∑27PBDE annual variability at both sites (except for
440
the month of January 2016) and confirmed the similar spatial variability with no
441
significant differences for PCDD/Fs (p=0.67) and PBDEs (p=0.66) and higher levels of
442
∑18PCB (although not significant, p=0.07) and ∑IDPCBs (p=0.03) in Bizerte (Figure
443
S8). The higher concentrations in January 2016 resulted in 4 to 9-fold higher levels in
Bizerte (412, 1050, 154 and 3210 ng gTOC-1)compared to Marseille (80,113, 51 and 811
445
ng gTOC-1) for ∑2,3,7,8-PCDD/F, ∑IDPCB, DLPCBs and ∑27PBDE, respectively. In
446
addition, an increase of the concentration differences (normalized by TOC) compared to
447
their respective volumetric concentrations was found for ∑DLPCBs in March 2015.
448
449
Concentrations normalized by EC (Figure S9) showed predominant levels of
∑2,3,7,8-450
PCDD/F for Marseille in March 2015 and January 2016 (where the lowest
451
concentration of EC were measured) and confirmed the ∑18PCB and ∑IDPCB higher
452
levels in Bizerte during spring-early summer compared to Marseille, but pointed to
453
generally higher concentrations in Marseille from September to winter. Interestingly, a
454
statistically significant (p<0.01) predominance of ∑DLPCB levels in Marseille resulted
455
from the normalization by EC, which was not verified as volumetric or TOC normalized
456
concentrations. The same effect (p˂0.001) was observed for the ∑27PBDE, exhibiting
457
higher levels in Marseille for all months (7.4 ug gEC-1, median value) than in Bizerte
458
(3.0 ug gEC-1, median value) with clear peak differences in August and September.
459
460
Four-day BTs were calculated (50, 500 and 1000m AGL) by using the HYSPLIT
461
model56 (Figure S10). The lowest ∑2,3,7,8-PCDD/F levels were registered in the
462
months of June, July and August 2015 in Marseille, where air masses had a clear
463
Atlantic influence, while the highest level was measured in the month of January 2016
464
with air masses showing continental influence (Figure S9). A similar min-max temporal
465
pattern was observed in Bizerte, with lower levels in summer months (except for July)
466
than in January. However, the BTs in July revealed a more important continental
467
influence for Bizerte compared to Marseille. ∑18PCB concentrations had minimum level
468
in April 2015 over Marseille, with air masses mostly circulating over the W
Mediterranean waters and peaked also in January 2016. The lowest ∑18PCB
470
concentrations were measured in October in Bizerte, whereas the higher levels
471
correspond to April 2015 (with air masses circulating over the Bizerte area and the
472
African continent) consistent with suspected current local PCB emissions.
473
Interestingly, ∑27PBDE exhibited the lowest concentrations in the months of March
474
2015 over Marseille, with air masses showing an important component coming from the
475
N African coast, while the highest concentrations were measured in the same month in
476
Bizerte, with air masses showing the 50m height component coming from the Gulf of
477
Lion area. Recent reports have shown evidences of the North to South atmospheric
478
particle transport over some regions in the NW and E Mediterranean Sea57,58. In
479
addition, PBDEs have been described to be mostly associated to the finest particles of
480
the atmospheric aerosol29, consistent with the correlations found with the TOC and/or
481
EC contents (more abundant and stronger) compared to the TSP as discussed above.
482
This will result in higher atmospheric residence times and a higher potential of LRAT.
483
These facts may support the hypothesis of the potential “jumping” of PBDE local
484
atmospheric stocks from the NW European Mediterranean edge to the NW African
485
coast (where lower PBDE ambient levels has been generally measured) under favorable
486
conditions. Indeed, the two sites are relatively close (around 780 km straight line).
487
However, this hypothesis requires further confirmation with more sites at both edges of
488
the NW Mediterranean. In addition, a better characterization of PBDE local sources
489
(emission inventory) at the African edge is needed. The BT analysis reveals too other
490
potential hot spots farther west in the N African coast which find their way to Bizerte
491
area passing through the Gibraltar strait and along the African cost, as observed in the
492
month of May 2015. The three POP families exhibited higher levels in Bizerte area
493
compared to Marseille (with a different air mass circulation pattern) in this month. This
situation has been previously described for PCDD/Fs35 and PAHs18 in the same region.
495
BTs could only explain part of the annual and spatial variability for the studied POPs,
496
most probably due to their different environmental sources and current local emissions
497
patterns (mostly for legacy POPs) at the studied sites as discussed above, which may
498
prevail over the BT influence at a local/regional scale in different seasons of the year. In
499
addition, other parameters affecting the atmospheric gas-particle partitioning of POPs
500
(e.g. temperature, relative humidity) may have an important influence at local scale.
501
502
Atmospheric dry deposition and exposure
503
504
Dry deposition fluxes (FDD, pg m-2 d-1) of PCDD/Fs, PCBs and PBDEs were calculated
505 as: 506 FDD= vd CA [1] 507 508
where CA is the POP volumetric concentration in the aerosol (pg m-3) and vd (cm s-1) is
509
the particle deposition velocity. A reference value of 0.2 cm s-1 for vd was adopted for
510
both sites. This value is within the range of vd experimentally measured 59
or previously
511
used in coastal NW Mediterranean Sea23,35,36 for the estimation of dry deposition fluxes
512
of POPs. However, a degree of uncertainty is associated to this calculation due to the
513
lack of vd measurements during the sampling events.
514
515
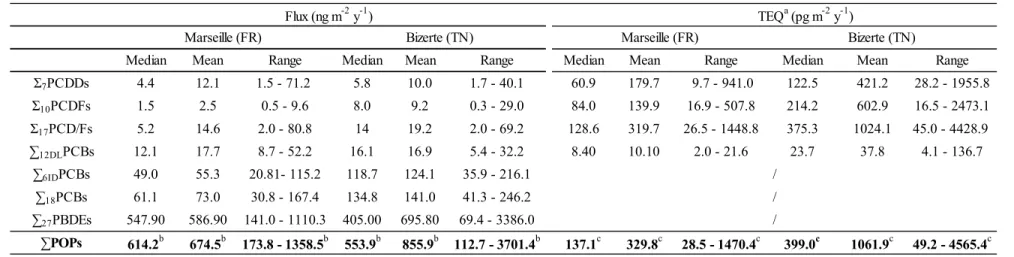
Overall, the atmospheric loading at both coastal areas is dominated by PBDEs, ranging
516
from 70 to ~ 3400 ng m-2 y-1, followed by PCBs (30 to ~ 250 ng m-2 y-1) and PCDD/Fs
517
(2 to 80 ng m-2 y-1) as expected from their relative atmospheric concentrations and the
518
assumptions considered in these calculations (Table 1, S9-S11). These fluxes were
generally within the range of previously reported dry deposition estimations in the
520
Mediterranean and SW Black Sea for the same POPs23,28,35. However, some differences
521
were found in the atmospheric loading at both edges of the Mediterranean Sea. While a
522
higher PBDE median loading is estimated for Marseille area (~ 550 ng m-2 y-1)
523
compared to Bizerte (~400 ng m-2 y-1), the median dry deposition fluxes of PCBs (135
524
ng m-2 y-1, and PCDD/Fs (14 ng m-2 y-1) in Bizerte were higher than those of Marseille,
525
~60 and 5 ng m-2 y-1, respectively. Indeed, a 3-fold higher loading of dioxin-like
526
pollutants was estimated for Bizerte as toxic equivalents (TEQ)60 (400 pg TEQ m-2 y-1,
527
median) compared to Marseille (137 pg TEQ m-2 y-1, median) due to a higher
528
contribution of PCDFs and DLPCBs in Bizerte (Table 1). These figures indicate a higher
529
potential exposure to these toxic chemical at the African edge of the W Mediterranean.
530
Considering 1.6 x10¹⁰ m2 as the surface of the Gulf of Lion61 and an equivalent surface
531
in the surroundings of Bizerte in the African coast, from 9 to 10 kg of POPs can be
532
annually loaded (median value) to surface waters at both edges of the Mediterranean
533
associated to the atmospheric aerosol. The sensitive environment of Bizerte coastal
534
lagoon (1.28 x10⁸ m2)62 could receive up to 0.5 kg of POPs yearly. This loading of toxic
535
chemicals may have implications for the aquatic organisms but this evaluation cannot
536
be performed with the present data. However, it should be further investigated.
537
538
A human health risk assessment for the whole set of dioxin-like POPs was performed
539
based on the inhalation exposure. We follow here a similar approach as a very recent
540
assessment based on only two dioxin-like PCBs performed in Bizerte area44. Briefly,
541
concentrations expressed as WHO05 TEQ were calculated using the latest available
542
toxic equivalency factors (TEFs).60 A daily air inhalation volume of 15 m3 for an adult
543
of 60 kg was assumed.63 The ∑2,3,7,8-PCDD/F and ΣDLPCB concentrations in the
aerosols over Bizerte area, ranged from 0.7 – 70.2 and 0.07 - 2.2 WHO05 TEQ fg m-3,
545
respectively, whereas in Marseille levels varied from 0.4 – 23.0 and 0.03 to 0.3 WHO06
546
TEQ fg m-3, respectively. Median TEQ values (for all dioxin-like congeners) of 6.3 and
547
2.2 WHO05 TEQ fg m-3 (Bizerte and Marseille) would result to potential intakes of
548
0.002 and 0.001 pg TEQ kg-1 day-1, respectively. Both levels are three orders of
549
magnitude lower than the daily intake threshold of 1-4 pg TEQ kg-1 day-1 propose by
550
WHO64. The atmospheric particle phase PCDD/F concentration can be considered as a
551
good descriptor of the total atmospheric concentration due to their general
552
predominance in this compartment after their emissions to the environment.22,23,35,49
553
Contrary, PCBs show a general preferential partitioning (mostly low MW congeners) to
554
the vapour phase.36,48 However, according to filed measurements performed in various
555
urban, coastal and remote Mediterranean environments and inland aquatic ecosystems
556
the ΣDLPCB gas phase concentrations are not expected to exceed more than 100 fold the
557
measured particulate phase concentrations. 23,27,36,63,65 Therefore, the worst case ΣDLPCB
558
TEQ concentration could be estimated as 100 fold the TEQ calculated considering only
559
the particle-bound PCB concentrations, resulting in a corrected daily intake (for all
560
dioxin-like congeners) of 0.01 and 0.004 pg TEQ kg-1 day-1 in Bizerte and Marseille
561
areas, respectively. This new value stills far below the daily intake threshold proposed
562
by WHO and therefore a risk by the inhalation route is excluded at present in the
563
studied areas. It should be noted thought that the daily intake threshold proposed by
564
WHO is based on toxicity studies evaluating dose-response through oral exposure.
565
However, absorption and tissue partitioning could be different via the inhalation route
566
and the local toxicity effect to lungs is not considered, so there is still an uncertainty
567
degree in this assessment.
There are no TEFs associated to PBDEs and according to the European Chemicals
569
Agency, the risks of deca-BDE and lower brominated transformation products to the
570
humans via the environment cannot be adequately addressed in a quantitative way due
571
to the high uncertainties regarding long-term exposure and effects.66 Similarly to
572
PCDD/Fs, PBDE particle-bound atmospheric concentrations can be a good indicator of
573
the total atmospheric levels, particularly considering that one of the most abundant
574
PBDEs is the HMW PBDE-209 (almost exclusively in the particle phase). For example,
575
the PBDE particle-bound fraction in a large Mediterranean city (Athens, Greece)
576
exhibiting similar atmospheric TSP concentration as Marseille and Bizerte accounted
577
from more than the 70% of the total airborne PBDE concentrations.29 Following the
578
above calculations, median intakes of 1.6 and 2.2 pg kg-1 day-1 were estimated for
579
Bizerte and Marseille, respectively. As a reference, three order of magnitude higher
580
(~7.0 ng kg-1 day-1) PBDE intakes has been reported for American adults.67 However,
581
the exposure to PBDE has been mostly associated to indoors environments (mainly dust
582
ingestion and dermal contact)67 and inhalation is not considered as the main route of
583
concern for these substances.
584
Acknowledgements
586
587
This work was funded by the Labex OT-Med (no. ANR-11-LABX-0061) – MEDPOP,
588
funded by the French Government “Investissements d’Avenir” (ANR) through the
589
A*MIDEX project (no ANR-11-IDEX-0001-02) and takes place in the
590
MERMEX/MISTRALS program. It also received the financial support from the IRD
591
French-Tunisian International Joint Laboratory (LMI) “COSYS-Med”, the MIO-IRD
592
Action Sud project “AEROBIZ” and the PACA region project “Particule”. Catherine
593
Guigue is acknowledged for her help on the sample preparation for the TOC/EC
594
determinations. We thank Patrick Raimbault for the TOC analyses, Xavier Mari and
595
Benjamin Guinot for the preparation of samples for EC determinations and Genevieve
596
Deviller (DERAC) for her contribution in the chemical risk assessment section.
597
598
Supporting information available
599
600
Additional data on the sampling and analytical procedures, QA/QC,
compound-by-601
compound atmospheric levels and spatial distribution (box-plots) and deposition fluxes
602
are presented in this section. This information is available free of charge via the Internet
603
at http://pubs.acs.org/
604
References
606
607
(1) WHO, 2004. Health Aspects of air Pollution. Results from the WHO Project
608
“Systematic Review of Health Aspects of air Pollution in Europe”. World Health
609
Organization Europe, p. 30
610
611
(2) Mesquita, S.R., Dachs, J., van Drooge, B.L., Castro-Jiménez, J., Barata, C., Vieira,
612
N., Guimarães, L., Piña, B. Toxicity assessment of atmospheric particulate matter in the
613
Mediterranean and Black Seas open waters. Sci. Total Environ. 2016, 545–546, 163– 614
170
615
616
(3) Safe, S. Polychlorinated biphenyls (PCBs) and polybrominated biphenyls (PBBs):
617
biochemistry, toxicology and mechanism of action. Crit. Rev. Toxicol. 1984, 13, 319-618
395.
619
620
(4) Safe, S. Polychlorinated biphenyls (PCBs), dibdenzo-p-dioxins (PCDDs),
621
dibenzofurans (PCDFs) and related compounds: environmental and mechanistic
622
considerations which support the development of toxic equivalency factors (TEFs).
623
Crit. Rev. Toxicol. 1990, 21, 51-88. 624
625
(5) Van den Berg, M., Birnbaum, L., Bosveld, A.T.C., Brunström B., Cook P, Feeley
626
M., Giesy J.P., Hanberg A., Hasegawa R., Kennedy S.W., Kubiak T., Larsen J. C., van
627
Leeuwen R.F.X., Djien Liem A.K., Nolt C., Peterson R.E., Poellinger L., Safe S.,
628
Schrenk D., Tillitt D., Tysklind M., Younes M., Wærn F., Zacharewski T.Toxic
equivalency factors (TEFs) for PCBs, PCDDs, PCDFs for humans and wildlife.
630
Environ. Health Perspec. 1998, 106, 775-792. 631
632
(6) Partzefall, W. Risk assessment of dioxin contamination in human food. Risk
633
assessment of dioxin contamination in human food. Food Chem. Toxicol. 2002, 40, 634
1185e1189.
635
636
(7) Opinion of the scientific panel on contaminants in the food chain on a request from
637
the Commission related to the presence of non-dioxin-like PCBs in feed and food. The
638
EFSA Journal (2005) 284, 1 - 137
639
640
(8) Faroon, O., Jones, D., De Rosa, C. Effects of polychlorinated biphenyls on the
641
nervous system. Toxicol Ind Health. 2000, 16, 305–333. 642
643
(9) Monosson, E. Reproductive and developmental effects of PCBs in fish: a synthesis
644
of laboratory and field studies. Rev. Toxicol. 1999, 3, 25–75. 645
646
(10) De Wit, C. An overview of brominated flame retardants in the environment.
647
Chemosphere 2002, 46, 583–624 648
649
(11) Vonderheidea, A.P., Mueller, K.E., Meija, M., Welshd, G.L. Polybrominated
650
diphenyl ethers: Causes for concern and knowledge gaps regarding environmental
651
distribution, fate and toxicity. Sci. Total. Environ. 2008, 400, 425-436. 652
(12) Harrad, S.J. and Jones, K.C. A source inventory and budget for chlorinated dioxins
654
and furans in the United Kingdom environment. Sci. Total Environ. 1992, 126, 89-107. 655
656
(13) Bruzy, L.P. and Hites, R.A.,1996. Global mass balance for polychlorinated
657
dibenzo-p-dioxins and dibenzofurans. Environ. Sci. Technol. 1996, 30, 1797-1804. 658
659
(14) Nizzetto, L., Macleod, M., Borgå, K., Cabrerizo, A., Dachs, J., Di Guardo, A.,
660
Ghirardello, D., Hansen, K. M., Jarvis, A., Lindroth, A., Ludwig, B., Monteith, D.,
661
Perlinger, J. A., Scheringer, M., Schwendenmann, L., Semple, K. T., Wick, L. Y.,
662
Zhang, G., Jones, K. C.; Nizzetto, L. Past, Present, and Future Controls on Levels of
663
Persistent Organic Pollutants in the Global Environment. Environ. Sci. Technol. 2010, 664
44, 6526–6531 665
666
(15) Breivik, K., Sweetman, A., Pacyna, J. M., and Jones, K. C.: Towards a global
667
historical emission inventory for selected PCB congeners – a mass balance approach: 2.
668
Emissions, Sci. Total Environ. 2002, 290, 199–224. 669
670
(16) La Guardia, M.J., Hale, C.R., Harvey, E.Detailed Polybrominated Diphenyl Ether
671
(PBDE) Congener Composition of the Widely Used Penta-, Octa-, and Deca-PBDE
672
Technical Flame-retardant Mixtures. Environ. Sci. Technol. 2006, 40, 6247-6254 673
674
(17) Mermex Group. Marine ecosystems' responses to climatic and anthropogenic
675
forcings in the Mediterranean. Prog. Oceanogr. 2011, 91, 97-166. 676
(18) Castro-Jiménez, J.; Berrojalbiz, N.; Wollgast, J.; Dachs, J. Polycyclic aromatic
678
hydrocarbons (PAHs) in the Mediterranean Sea: atmospheric occurrence, deposition and
679
decoupling with settling fluxes in the water column. Environ. Pollut. 2012, 166, 40-47. 680
681
(19) Castro-Jiménez, J. et al., Sources, Transport and Deposition of Atmospheric
682
Organic Pollutants in the Mediterranean Sea. In Occurrence, Fate and Impact of 683
Atmospheric Pollutants on Environmental and Human Health; McConnell, L., Dachs, 684
J., Hapeman C.J., Eds.; ACS Symposium Series, vol. 1149, American Chemical
685
Society, Washington, DC, 2013, pp. 231–260.
686
687
(20) Dalla Valle, M; Marcomini, A.; Sfriso, A.; Sweetman, A. J.; Jones, K. C.
688
Estimation of PCDD/F distribution and fluxes in the Venice Lagoon, Italy: Combining
689
measurement and modelling approaches. Chemosphere 2003, 51, 603–616. 690
691
(21) Jaward, F. M.; Farrar, N. J.; Harner, T.; Seweetman, A. J.; Jones, K. C. Passive air
692
sampling of PCBs, PBDEs and organochlorine pesticides across Europe. Environ. Sci. 693
Technol. 2004, 38, 34- 41. 694
695
(22) Castro-Jiménez, J.; Deviller, G.; Ghiani, M.; Loos, R.; Mariani, G.; Skejo, H.;
696
Umlauf, G.; Wollgast, J.; Laugier, T.; Héas-Moisan, K.; Léauté, F.; Munschy, C.;
697
Tixier, C.; Tronczyński, J. PCDD/F and PCB multi-media ambient concentrations,
698
congener patterns and occurrence in a Mediterranean coastal lagoon (Etang de Thau,
699
France). Environ. Pollut. 2008 ,156, 123-135. 700
(23) Castro-Jiménez, J.; Mariani, G.; Vives, I.; Skejo, H.; Umlauf, G.; Zaldivar, J.M.;
702
Dueri S.; Messiaen G.; Laugier, T. Atmospheric concentrations, occurrence and
703
deposition of persistent organic pollutants (POPs) in a Mediterranean coastal site (Etang
704
de Thau, France). Environ. Pollut. 2011, 159, 1948-1956. 705
706
(24) Mari, M., Schuhmacher, M., Feliubadalo, J., Domingo, J.L. Air concentrations of
707
PCDD/Fs, PCBs and PCNs using active and passive air samplers. Chemosphere 2008, 708
70, 1637–1643 709
710
(25) Gambaro, A., Radaelli, M., Piazza, R., Stortini, A.M., Contini, D., Belosi, F.,
711
Zangrando, R., Cescon, P. Organic micropollutants in wet and dry depositions in the
712
Venice Lagoon. Chemosphere 2009, 76, 1017–1022 713
714
(26) Garcia-Flor, N.; Dachs, J.; Bayona, J. M.; Albaiges, J. Surface waters are a source
715
of polychlorinated biphenyls to the coastal atmosphere of the North-Western
716
Mediterranean Sea. Chemosphere 2009, 75, 1144–1152. 717
718
(27) Mandalakis, M. and Stephanou, E. G.: Study of atmospheric PCB concentrations
719
over the eastern Mediterranean Sea, J. Geophys. Res. 2002, 107, 4716, 720
doi:10.1029/2001JD001566.
721
722
(28) Mandalakis M., Apostolakis M., and Stephanou E.G. Mass budget and dynamics of
723
polychlorinated biphenyls in the eastern Mediterranean Sea. Global biogeochem. Cy. 724
2005, 19, GB 018, 1-16
725
(29) Mandalakis, M., Besis, A., Stephanou, E.G. Particle-size distribution and
727
gas/particle partitioning of atmospheric polybrominated diphenyl ethers in urban areas
728
of Greece. Environ. Pollut. 2009, 157, 1227–1233 729
730
(30) Iacovidou, E.; Mandalakis, M.; Stephanou, E.G. Occurrence and diurnal variation
731
of polychlorinated biphenyls and polybrominated diphenyl ethers in the background
732
atmosphere of Eastern Mediterranean. Chemosphere 2009, 77, 1161-1167. 733
734
(31) Mosca, S., Torelli, N.G.; Guerriero, E.; Tramontana, G.; Pomponio, S.; Rossetti,
735
G.; Rotatori. M. Evaluation of a simultaneous sampling method of PAHs, PCDD/Fs and
736
dl-PCBs in ambient air. J. Environ. Monit., 2010, 12, 1092–1099 737
738
(32) Lammel, G.; Audy, O.; Besis, A.; & Efstathiou, C.; Eleftheriadis, K.; Kohoutek, J.;
739
Kukučka, P.; Mulder, M.D.; Přibylová1, P.; Prokeš, R.; Rusina, T.P.; Samara, C.;
740
Sofuoglu, A.; Sofuoglu, S.C. Taşdemir, Y.; Vassilatou, V.; Voutsa, D.; Vrana, B. Air
741
and seawater pollution and air–sea gas exchange of persistent toxic substances in the
742
Aegean Sea: spatial trends of PAHs, PCBs, OCPs and PBDEs. Environ. Sci. Pollut. Res. 743
2015, 22,11301–11313
744
745
(33) Pozo, K.; Palmeri, M.; Palmeri, V.; Estellano, V.H.; Mulder, M.D.; Efstathiou,
746
C.I.; Sará, G.L.; Romeo, T.; Lammel, G.; Focardi, S. Assessing persistent organic
747
pollutants (POPs) in the Sicily Island atmosphere, Mediterranean, using PUF disk
748
passive air samplers. Environ. Sci. Pollut. Res. 2016, 23, 20796–20804. 749