Publisher’s version / Version de l'éditeur:
Vous avez des questions? Nous pouvons vous aider. Pour communiquer directement avec un auteur, consultez la première page de la revue dans laquelle son article a été publié afin de trouver ses coordonnées. Si vous n’arrivez pas à les repérer, communiquez avec nous à PublicationsArchive-ArchivesPublications@nrc-cnrc.gc.ca.
Questions? Contact the NRC Publications Archive team at
PublicationsArchive-ArchivesPublications@nrc-cnrc.gc.ca. If you wish to email the authors directly, please see the first page of the publication for their contact information.
https://publications-cnrc.canada.ca/fra/droits
L’accès à ce site Web et l’utilisation de son contenu sont assujettis aux conditions présentées dans le site LISEZ CES CONDITIONS ATTENTIVEMENT AVANT D’UTILISER CE SITE WEB.
The 2nd Workshop on Data Mining in Bioinformatics (DMB 2007) [Proceedings],
2007
READ THESE TERMS AND CONDITIONS CAREFULLY BEFORE USING THIS WEBSITE. https://nrc-publications.canada.ca/eng/copyright
NRC Publications Archive Record / Notice des Archives des publications du CNRC :
https://nrc-publications.canada.ca/eng/view/object/?id=0d493998-977e-47bd-a783-3f550ec7252b
https://publications-cnrc.canada.ca/fra/voir/objet/?id=0d493998-977e-47bd-a783-3f550ec7252b
NRC Publications Archive
Archives des publications du CNRC
This publication could be one of several versions: author’s original, accepted manuscript or the publisher’s version. / La version de cette publication peut être l’une des suivantes : la version prépublication de l’auteur, la version acceptée du manuscrit ou la version de l’éditeur.
Access and use of this website and the material on it are subject to the Terms and Conditions set forth at
CAPRI- content-based analysis of protein structure for retrieval and
indexing
National Research Council Canada Institute for Information Technology Conseil national de recherches Canada Institut de technologie de l'information
CAPRI - Content-Based Analysis of Protein
Structure for Retrieval and Indexing *
Paquet, E., Viktor, H.L.
September 2007
* published at The 2nd Workshop on Data Mining in Bioinformatics
(DMB 2007). Vienna, Austria. September 23, 2007. NRC 49841.
Copyright 2007 by
National Research Council of Canada
Permission is granted to quote short excerpts and to reproduce figures and tables from this report, provided that the source of such material is fully acknowledged.
CAPRI- Content-based Analysis of Protein Structure for
Retrieval and Indexing
Eric Paquet
National Research Council of Canada
Building Montreal Road
Ottawa, Ontario, Canada
+1 613 991 5035
Eric.paquet@nrc-cnrc.gc.ca
Herna L Viktor
University of Ottawa
SITE Building, 800 King Edward Road
Ottawa, Ontario, Canada
+1 613 562 5800 2341
hlviktor@site.uottawa.ca
ABSTRACT
In molecular biology, current research suggests that the function of a protein may be inferred from its structure. Two proteins with similar local parts (or active sites) and shape are often closely related. This observation is of importance when determining the adverse effects of new medicine, identifying new protein architectures, predicting protein interactions such as the docking-problem (where the so-called receptor connects to the ligand) and explaining unexpected evolutions. Due to the vast amounts of newly discovered protein structures, there is an urgent need for multimedia data mining systems which can efficiently find similar proteins structures, based on both shape and physical properties. In this paper, we describe the Content-based Analysis of Protein Structure for Retrieval and Indexing (CAPRI) data mining system, which is used to explore very large multimedia databases containing numerous protein structure families. CAPRI is able to find similar proteins based on their structure, by utilizing firstly, the 2D colours, textures and composition and secondly, the 3D structure of the proteins. Our results against more than 26,000 protein structures as contained in the Protein Data Bank shows that our system is able to accurately and efficiently locate related protein structures. Through the use of the CAPRI system, domain experts are able to find these similar protein structures, using a “query by prototype” example. In this way, they are aided in the task of labelling new structures effectively, finding the families of existing proteins, identifying mutations and explaining unexpected evolutions.
1. INTRODUCTION
Protein function analysis is an important research issue in molecular biology, bio-informatics and pharmaceutics. A protein’s function is often dependent on the shape and physical properties of the so-called active sites (local subparts) of the molecular surface [1-3]. Current research suggests that, if two proteins have similar active sites, the function of the two proteins may be closely related [4]. This observation is of importance for many reasons.
Consider a protein which has shown to be successful in a prescription drug developed to treat a terminal illness. However, this protein has serious contra-indications and causes severe adverse effects in a certain subset of the population. Suppose a
protein with similar structure and functionality, but without these serious adverse effects, can be found. The subsequent modification of the harmful drug has obvious benefits.
There are currently more than 45,000 known protein structures in the Protein Data Bank, and an additional 100 are added every week [5]. It is estimated that the amount of newly discovered structures will growth linearly [1]. Ideally, new structures should be labelled by a domain expert. However, given the rate at which molecular biology technologies develop, this ideal unfortunately becomes unrealistic.
This has serious implications for the architects of “new” proteins. It is crucial to determine whether a protein structure has been discovered before; whether it is a mutation; and/or to find an indication to which fold, super-family or family it possibly belongs. Also, efficient systems to aid domain experts with the identification of new types of proteins architectures, unexpected evolutions and protein inter-actions such as the docking–problem (where the so-called receptor connects with a ligand) are highly desirable.
This paper presents the Content-based Analysis of Protein Structure for Retrieval and Indexing (CAPRI) data mining system which addresses this issue. In CAPRI, we are able to utilize the 2D colours, textures and composition as well as the 3D structure of a protein, in order to find the k most similar structures. The novelty of our approach is that we use these two representations to access chemical properties in terms of the colour and texture of the active sites as represented in 2D, as well as the 3D shape information, in order to discover these similar protein structures. Our results against more than 26,000 protein structures as contained in the Protein Data Bank show that our system is able to accurately and efficiently retrieve similar protein structures. Through the use of the CAPRI system, domain experts are able to find similar protein structures, using a “query by prototype” approach. In this way, they are aided in the task of labelling new structures effectively, finding the families of existing proteins, identifying mutations and unexpected evolutions.
The main benefit of 3D structural indexing is that the protein functionality is related to its 3D shape. 3D shape indexing is a natural way to index the functionality with all the foreseen applications in bioinformatics, genomic, as well as for the
pharmaceutical industry. Although 3D indexing takes into account the shape, it does not take into account the chemical substructures of the protein. By attributing a colour code to each chemical structure, it is possible to analyze them as 2D images. For example, an alpha helix substructure is indicated in purple, an extended beta as yellow and a coil as white. Using our 2D indexing and querying system, we are able to utilize such colour-related information in our similarity search algorithm. As our results will show, the 2D method presents comparable, although slightly inferior, results when compared to the 3D approach. Nevertheless, the strength of the 2D approach lies in the fact that it can be of use when the chemical structure is of particular interest or relevance. That is, the 2D algorithm can be utilised in order to refine the results of a 3D query. Importantly, the 2D method can be used in a generic way (four standard views) or for analysing the docking view, i.e. the chemical of the later.
This paper is organized as follows. The next section provides an overview of similarity search and its application in the protein structure domain. In Section 3, we present our CAPRI data mining system. This is followed, in Section 4, with an experimental evaluation. Section 5 concludes the paper.
2. BACKGROUND
Data mining through similarity search in multimedia databases involves finding similar objects (i.e. 2D images, 3D objects, audio, and so on) based on the multimedia content and/or a textual description thereof [6, 7]. Textual descriptions aim to use domain knowledge, in the form of queries, to guide the search. This approach has limited application when e.g. aiming to find similar shaped proteins. The second approach, also known as content-based indexing and retrieval, uses the multimedia object content (such as colour, texture or shape) or parts thereof, to index and subsequently retrieve the object. In order to determine the similarity of objects, a distance measurement such as the Euclidian or Manhattan distance is employed. Objects with distance measurements that are near are considered to be similar; whilst those with different values are considered dissimilar. This paper concerns the indexing or retrieval of protein structures described by means of 2D images and 3D objects- we therefore limit our discussion to mining this type of multimedia database. Describing such 2D images or 3D objects is difficult, since they convey a large amount of complex and ambiguous information. It follows that the indexing approach will have a serious impact on the similarity search results that can be retrieved.
Recently, a number of research teams have focused their attention on the use similarity search for protein structure retrieval, mainly using structure alignment [5]. For example, the approach followed by [4] uses a local approach to calculate the similarities between proteins. However, a drawback of their method is that they accumulate error and that it does not scalewell. Similarly, [2, 8] and [9] use a local approach to find the similarity between aligned structures: thus loosing semantic information about the interrelationship of the substructures on the protein. In the method of [5], the authors use 100 views of a protein structure to create a 2D projection. While their results are promising, the computational expense is limiting. (Note that in the CAPRI approach, we require only four (4) views.) In their research, reference [10] uses a shape-based approach in the form of a
sphere, grid or pie in order to compare structures. Reference [3] also employs a spherical approach, and uses a weighted distance measure to determine similarity.
The next section introduces the CAPRI system for indexing and similarity search of protein structures.
3. CAPRI System
This section describes the CAPRI data mining system, which is used to index and retrieve the protein structures, using both 2D image and 3D structural information.
3.1 Signature-based 2D Indexing
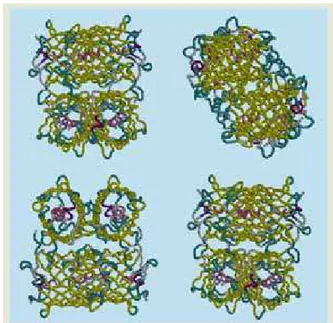
The 2D component of the CAPRI system creates a so-called feature-based image signature using the colour, texture and composition (i.e. the interrelationships between components) of the protein structure. Similar protein structures are then retrieved by finding those images with the closes signatures. For illustration, consider Figure 1 which contains four (4) views of the structure of the red fluorescent protein, which belongs to the fluorescent proteins family of the GTP-like fold. This protein is obtained from the Coral (Discosoma sp.) species which are classified as belonging to the a + b (alpha and beta) class in the SCOP database [1].
Figure 1: Four (4) views of the Red Fluorescent Protein of the Coral Species.
Using the CAPRI system’s 2D indexing, we are able to utilize the different colours used to classify the protein’s substructure; the later being described in terms of their associated colour, texture and composition. For example, the a helix chemical substructures are denoted in purple, while the extended b substructures are indicated in yellow. The red indicate presence of p (pi) helix substructures, and so on. The patterns created by these substructures are associated with the texture, while their local spatial organization is associated with the composition. These
abstract features, and the association thereof, are then described by our algorithm.
Algorithm Calculate2DIndexDescriptor
Input: A proteinFile from the ProteinDataBankDatabases Output: The 2DIndexDescriptor of proteinFile
1. read(proteinFile);
2. triangulatedProtein=triangulate(proteinFile); 3. for each triangle in triangulatedProtein do
triCentres.add(computeTriCentre(triangle)); weights.add(computeWeight(triangle)); 4. barycentre=computeBarycentre(triCentres); 5. tensorInertia=computeTensorInertia(barycentre, triCentres, weights); 6. principalComponents=jacobi(tensorInertia); 7. sortByPrincipalValues(principalComponents); 8. viewingDirections= calculateViewingDirections(principalComponents); 9. for each viewingDirection in viewingDirections do
views.add(renderView(viewingDirection, triangulatedProtein)); 10. mosaic=createMosaic(views); 11. sobolSequence=generateSobolSequence(); 12. initialise(histogram2DHue); 13. initialise(histogram2DSaturation); 14. for each position in sobolSequence do
structuringElement= selectStructuringElement(mosaic); hue=computeHue(structuringElement); saturation=computeSaturation(structuringElement); hueQuantified=quantified(hue); saturationQuantified=quantified(saturation); relativeProportionsHue= computeRelativeProportions(hueQuantified); relativeProportionsSaturation= computeRelativeProportions(saturationQuantified); histogram2DHue+= compute2DHistogram(relativeProportionsHue, hueQuantified); histogram2DSaturation+= compute2DHistogram(relativeProportionSaturation, SaturationQuantified); normalise(histogram2DHue); normalise(histogram2DSaturation); write(histogram2DHue); write(histogram2DSaturation); 15. Return 2DIndexDescriptor End Calculate2DIndexDescriptor
Figure 2. The Calculate2DIndexDescriptor Algorithm.
The Calculate2DIndexDescriptor algorithm is depicted in Figure 2. The algorithm inputs each of the protein structures, as obtained from the Protein Data Bank, and outputs an index, which is then stored in a database. Note that the colour distribution of each images is describes in terms of hue and saturation. This
colour space imitates many characteristics of the human visual system. The hue corresponds to our intuition of colour e.g. red, green or blue while saturation corresponds to the colour strength e.g. light red or deep red.
The triangular representation is the internal representation utilized by this algorithm. It allows us to analyze fine details irrespectively on their initial representation. It is also highly tolerant to tessellation i.e. it can be perform in various ways without negative effects on the results (robust approach).
PCA are used in order to obtain a reference frame which is translation and orientation invariant (remember that the protein can have any position and / or orientation). The PCA allows finding the most “natural” reference frame in the sense that the later is related to the spatial distribution of the protein. In this way, the PCA can be utilized to define standard viewing directions.
Subsequently, a set of points is sampled from the image. A quasi-random sequence generates the points. The choice of such a sequence is justified by the fact that no particular or a priori underlying structure or composition is assumed for the image. In the present implementation, the well-known Sobol sequence is used [11]. The Sobol sequence is used because it can be made multi-resolution (the structure can be analysed in more or less fine details) without “additional cost” i.e. the previous level of resolution is reused in order to generate the next level of resolution.
Such a sequence allows sampling the image at various resolutions while filling the gaps in the previously generated distribution. Each point of this sequence becomes the centre of a small rectangular window on the image. For each centre position, the pixels inside the corresponding window are extracted and the associated hue and saturation images are calculated. The statistical distribution of the colours within the window is characterized by a bidimensional histogram. The first dimension of this histogram corresponds to the hue or the saturation quantified on a discrete and finite number of channels. The second dimension corresponds to the relative proportion of each channel within the window. Intuitively, such a histogram can be assimilated to the palette (as understood in art) associated with the visual content of the window.
This bidimensional histogram is computed and accumulated for each point of the sequence, i.e. the current histogram is the sum of the histograms at the current and at the previous position. The displacement of the window over the image insures that not only global information about the later is accumulated but structural information is extracted as well. Here, structural information should not be understood as a set of spatial relations in between segmented areas, but as the repetition on various locations of small and similar patterns that characterise the composition of the image. Finally, each set of two histograms is converted into one compact descriptor or index. Such an index is a quantized representation of the bidimensional histograms. In the current approach, the proportions are quantized on four channels or bins while the colours (hue and saturation) are quantized on six channels. The 2D index is stored as a compact binary representation, in an index database PB2D, and has a typical size of
200 bytes.
The final index provides an abstract description of the composition of the protein image, i.e. of the local distribution of
colours throughout the four (4) views of the protein structure. This is very important. This index does not represent a global description of the image nor is it based on a particular segmentation scheme. Instead, it characterized the statistics of colour distribution within a small region that is moved randomly over the image. Consequently, there are no formal relations in between the different regions, which means that the different components of a view can be combines in various ways while still be identified as the same protein. This is one of the reasons why that algorithm is robust against partial view and viewpoint. Nevertheless, this approach provides a good level of discrimination.
3.2 Shape-based 3D Indexing
This section describes the 3D indexing component of the CAPRI system. For the 3D structures, the signatures are shape-based, and the proteins with a shape-based distance closest to each other are considered similar.
Figure 3 shows the Calculate3DIndexDescriptor algorithm, which is used to create an index for each protein structure in the Protein Data Bank. Our objective is to define an index that describes an object from a three-dimensional shape point of view and that is translation, scale and rotation invariant. The later invariants are essential because the object can have an arbitrary location and pose into space.
The algorithm can be described as follows. Firstly, the protein structure is triangulated into a mesh. Next, the centre of mass of the object is calculated and the coordinates of its vertices are normalised relatively to the position of its centre of mass. A translation invariant representation is then achieved. Translation invariance is important since a priori we do not know the location of the object.
Then, the tensor of inertia of the object is calculated, using the following formula
[ ]
[
(
) (
)
]
⎥ ⎦ ⎤ ⎢ ⎣ ⎡ − − = =∑
= n i CM i CM i qr S q q r r n I I i 1 1(1)
where Si is the area of the ith triangle; qi is the coordinates x, y
or z of the ith triangle and ri is the coordinate x, y or z of the ith
triangle; and qCM and rCM are the coordinates x, y or z of the
barycentre .
This tensor results in a 3 x 3 matrix. In order to take into account the tessellation in the computation of these quantities, we do not utilise the vertices per se but the centres of mass of the corresponding triangles; the so-called tri-centres. In all subsequent calculations, the coordinates of each tri-centre are weighted with the area of their corresponding triangle. The latter is being normalised by the total area of the object, i.e. with the sum of the area of all triangles. In this way, the calculation can be made robust against tessellation, which means that the index is not dependent on the method by which the object was virtualised: a “sine qua non” condition for real world applications. Under certain assumptions, the area of the triangles is related to the local curvature: the smaller the area, the higher the curvature. Such a hypothesis is valid if the number of acquired points is related to
the complexity of the local structure and constitutes a sine qua non condition for any realistic shape acquisition.
In order to achieve rotation invariance, the Eigen vectors of the tensor of inertia are calculated. The Jacobi method, which has been proven successful for real symmetric matrices, as found in the CAPRI system, is used. It consists of a sequence of orthogonal similarity transactions using the following formula,
[
=
]
=1,2,3 i iI
a
iλ
a
i(2)
where λi is an Eigen value, ai represents the corresponding Eigen
vector and I refers to the tensor of inertia - a 3 x 3 symmetric matrix.
Once normalised, the unit vectors define a unique reference frame, which is independent on the pose and the scale of the corresponding object: the so-called Eigen frame. The unit vectors are identified by their corresponding Eigen values. It is very common to encounter axes which are orientated along the shortest and the longest dimensions of the object. For instance, let us suppose we have an ellipsoidal protein: in that particular case, one axis would correspond to the revolution symmetry of the protein and the other two axes would correspond to the minor and major axis of the protein.
Algorithm Calculate3DIndexDescriptor
Input: A proteinFile from the ProteinDataBankDatabases Output: The 3DIndexDescriptor of proteinFile
1. read(proteinFile);
2. triangulatedProtein=triangulate(proteinFile); 3. for each triangle in triangulatedProtein do
triCentres.add(computeTriCentre(triangle)); weights.add(computeWeight(triangle)); 4. barycentre=computeBarycentre(triCentres); 5. tensorInertia=computeTensorInertia(barycentre, triCentres, weights); 6. principalComponents=jacobi(tensorInertia); 7. sortByPrincipalValues(principalComponents); 8. for each triCentre in triCentres do
cords.add(computeCord(barycentre, triCentre,
principalComponents));
9. for each cord in cords do
angles.add(computeAngles(cord, principalComponents)); radii.add(computeRadii(cord)); 10. histogramsAngles=computeHistogramsAngles(angles); 11. histogramRadii=computeHistogramsRadii(radii); 12. normalisedAnglesHistograms(histogramsAngles); 13. normalisedRadiiHistogram(histogramRadii); 14. write(histogramsAngles); 15. write(histogramRadii); 16. Return 3DIndexDescriptor End Calculate3DIndexDescriptor
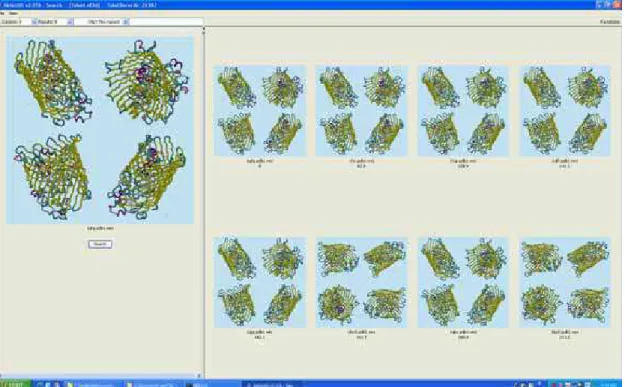
Figure 4: The CAPRI Query Retrieval System.
The descriptor is based on the concept of a cord. A cord is a vector that originates from the centre of mass of the object and that terminates on a given tri-centre. The coordinates of the cords are calculated in the Eigen reference frame in cosine coordinates. The cosine coordinates consist of two cosine directions and a spherical radius. The cosine directions are defined in relation with the two unit vectors associated with the smallest Eigen values i.e. the direction along witch the object presents the maximum spatial extension. In other words, the cosine directions are the angles between the cords and the unit vectors. The radius of the cords are normalised relatively to the median distance in between the tri-centres and the centre of mass in order to be scale invariant. It should be noticed that the normalisation is not performed relatively to the maximum distance in between the tri-centres and the centre of mass in order to achieve robustness against outliers or extraordinary tri-centres. From that point of view, the median is more efficient that the average. The cords are also weighted in terms of the area of the corresponding triangles; the later being normalised in terms of the total area of the object. The statistical distribution of the cords is described in terms of three histograms: one histogram for the radial distribution and two for the angular distribution of the cords. That is, the first histogram describes the distribution of the cosine directions associated to the unit vector associated with the smallest Eigen value. The second histogram described the distribution of the cosine directions associated with the unit vector associated with the second smallest Eigen value. The third histogram described the distribution of the normalised spherical radius as defined in the previous paragraph. The ensemble of the three histograms constitutes the shape index of the corresponding protein structure, which is placed in database PB3D to be used when querying the
Protein Data Bank.
3.3 Retrieval of Protein Structures
The CAPRI system is able to find, in a multimedia database, similar 2D images and 3D objects. In particular, it is able to find similar protein structures, based on either the 2D image of the four (4) views therefore, and/or based on the 3D shape. This is illustrated in Figure 4, which shows the retrieval of various members of the Ferric hydroxamate uptake receptor FhuA protein out of a database of 26,000 proteins.
We have seen that by following an iterative or spiral approach, the user can converge to the item of his interest. Let us review this process from a more fundamental point of view. An index can be visualised as a point in an N- dimensional space where N depends on the number of channels. When the user chooses a prototype, he chooses a point or a seed in this space. Then, the similarity search engine determines the closest points to the seed, with the proximity being defined according to the Euclidian distance.
For example, consider the 2D similarity search engine. Let P2D
denote the query protein. We calculate the similarity measure between P2D and each other protein structure in PB2D. This
distance is calculated using the Euclidian distance, given by
1
(
)
N i i id
x
y
==
∑
−
(3) where i and j denote the various dimensions, x is the index associated with the unknown structure and y is the target structure.
The 3D similarity search method employs the same standard Euclidian distance measure.
It should be remembered that a point corresponds to an object, or protein structure, in the database. Recall that the proteins within the Protein Data Bank are classified into (from large to small) folds, super-families and families. A major task is therefore to find the family that a structure belongs too, and those family members that it is closest too.
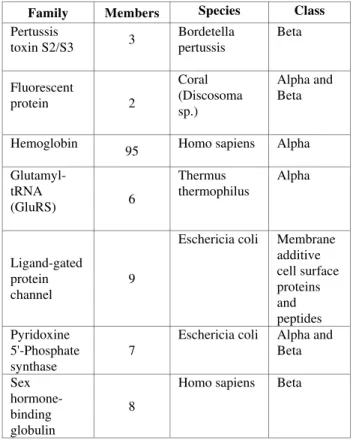
Table 1. Protein Families used in Experiments.
Family Members Species Class Pertussis toxin S2/S3 3 Bordetella pertussis Beta Fluorescent protein 2 Coral (Discosoma sp.) Alpha and Beta Hemoglobin
95 Homo sapiens Alpha Glutamyl-tRNA (GluRS) 6 Thermus thermophilus Alpha Ligand-gated protein channel 9
Eschericia coli Membrane additive cell surface proteins and peptides Pyridoxine 5'-Phosphate synthase 7
Eschericia coli Alpha and Beta Sex hormone-binding globulin 8
Homo sapiens Beta
In our method, the nearest-neighbourhood approach is used to identify such families (or “clusters”) of similar protein structures. We are employing a “query by prototype” approach, which guides the domain expert through his search. If the outcome of the query corresponds to the foreseen results, it means that the seed point is approximately located near the centre of the grouping. If it is not the case, it means that the seed point is situated on the outskirt of the cluster. In that case, the user selects the best candidate from the closest M points obtained from the previous iteration and reiterates the process. After a few iterations, the process converges to a point near the centre of the cluster. This point and its neighbourhood constitute the cluster and the corresponding objects form the class.
The next section discusses the application of the CAPRI system to the Protein Data Bank and shows its effectiveness to obtain families of proteins within this vast database.
4. Experimental Evaluation
This section describes our experimental evaluation of the CAPRI system. We implemented the system using Java and ran the experiments on workstations with two 3.4 GHz CPUs and 2.8 GB of RAM. We used a total of 26,000 protein structures in our experiments. These protein structures were taken from the Brookhaven Protein Data Bank [1] and we used the family
classification information as contained in SCOP database to verify our findings [1].
0 50 100 150 200 250 300 350 1bcp ( 2) 1bc p (1 ) 1prt ( 2) 1prt (1) 1pto(1) 1pto (2) 1gof ( 1) 1gog (1) 1goh (1)
Figure 5: Similarity Ranking for Pertussis Toxin S2/S3 family. In order to illustrate the effectiveness of the CAPRI system, we identified a number of families with different sizes, folds and classes, as depicted in Table 1. The table shows the family name, size, species and class information. As can be seen from the table, the selected families varied in size, species of origin and class, thus providing us with an ideal test bed to evaluate our system.
4.1 3D Retrieval of Protein Structures
In our first set of experiments, our objective was to determine the effectiveness of our system when aiming to obtain all protein structures within a particular family. In Figures 5 and 6, we show the results, when considering the retrieval of Pertussis toxin S2/S3 and Fluorescent protein families, using the 3D querying component. 0 50 100 150 200 250 300 350 400 450
1ggx 1g7k 1rul 1qht 1cpt 1i7n 1o8o Figure 6: Similarity ranking for Fluorescent Protein family.
The results indicate that the CAPRI system is able to correctly identify the members of known families, when compare to more than 26,000 other protein structures. The three (3) member of the Pertussis toxin family ranked on the top six (6) positions amongst the 26,000 molecules in the database, with a large gap being observed in between the family and the first false result; lgof
being the first one. In this particular case, we have two versions of the PDB file format (PDB1 and PDB2) for each member of the family, which means that each protein appears twice in the results, denoted by labels (1) and (2), e.g. 1bcp (1) and 1bcp (2), respectively. There were no outliers in the sequence. That means that the precision and the recall were both 100 %. From Figure 6, similar results can be inferred. The two members of the Fluorescent protein family were retrieved out of the 26,000 proteins in the database without any outlier. That means that the precision and the recall were both 100 %. Once more, there is a large gap in between the last member of the family and the first false results; 1rul being the first one. This result and the previous one are both confirmed by visual inspection of our results against these data sets, as shown in Figures 7 and 8, confirms this observation.
Figure 7: Retrieval results for the Pertussis Toxin S2/S3 family- the first six (6) structures are the two views of this
three-member family.
We next focus our attention on the Homo Sapiens Hemoglobin protein structure family. This family contains 162 members of which 95 are present in our database
When employing our 3D indexing and retrieval system with the lrly protein as the query structure, the first 55 similar structures retrieved belong to the Homo Sapiens Hemoglobin protein structure family. This result is shown in Figure 9. Our results query results are highly precise, with 86 of the first 100 structures retrieved belong to this family, i.e. an accuracy of 86% was obtained. Further analysis of our results indicates that those protein structures which are not of the Homo Sapiens family, are also Hemoglobin protein structures. Namely, the structure located at position 56 from the query structure is a Hemoglobin structure of a cow, the next incorrectly retrieved structure is the Hemoglobin of a rookcod (position 69), a chicken (position 71) and so on. This result convinces that we were able to retrieves similar protein structures within families, and that our system succeeds in finding the relevant groupings within the data.
Figure 8: Retrieval results for the Fluorescent Protein family- the first two structures belong to this two (2) member family. In general, Hemoglobin protein structures may be grouped, by visual inspection, into two distinct formats, as can be seen from Figures 9 and 10. Our second query thus used the 1lfg protein structure and subsequently located all 16 members of this sub-structure of the Homo Sapiens Hemoglobin, again against more than 26,000 protein structures.
Figure 9: Retrieval of the first 70 similar members of the Homo Sapiens Hemoglobin family within 77 protein structures, using the lrly structure as query, with precision
93% of and recall 89%.
The precision-recall curves for these two queries are shown in Figures 11 and 12. Here, the precision refers to the number of structures retrieved that is relevant, divided by the total number of images that are retrieved. The recall denotes the number of protein structures retrieved that is relevant, divided by the total number of structures that are relevant.
Figure 10: Retrieval of all 16 members of the Homo Sapiens Hemoglobin family within 27 protein structures, using the
1flg structure as query, with precision 59% and recall 100%.
For example, for the lrly protein, our database of 26,000 tuples contains 79 members of this “sub-family”. These first 44 structures retrieved by CAPRI all belonged to the Homo Sapiens Hemoglobin protein structure family, with a precision of 100% (44/44) and a recall of 56% (44/79). Furthermore, all family members were retrieved within the first 147 structures, giving us a precision of 54% (79/147) and recall of 100% (79/79). That is, we were able to retrieve all family members by considering less than twice the number of structures, from a database containing 26,000 members. 0 10 20 30 40 50 60 70 80 90 100 1 13 25 38 56 85 87 89 90 100 Recall Prec ision
Figure 11: Precision-recall curve (in percentage) for the Homo Sapiens Hemoglobin family, for the 1rly structure as
query.
We obtain similar results for the 16 member “sub-family” when using the 1lfg protein structures as query. The first ten (10) protein structures retrieved all belonged to this subfamily, with a precision of 100% and a recall of 63% (10/10). Here, we are able to obtain the 16 relevant structures within the first 27 query
results, giving up as recall of 59% (16/27) and precision of 100% (16/16). 0 10 20 30 40 50 60 70 80 90 100 6 19 38 50 63 81 88 94 100 Recall Prec ision
Figure 12: Precision-recall curve (in percentage) for the Homo Sapiens He`moglobin family, for the 1lfg structure as
query.
As it is clearly showed by the two figures, CAPRI not only presents a high precision, but also finds the most pertinent results with a minimum of outliers. This implies that the most pertinent results can be obtained with a minimum number of queries; for the results presented in this paper, the number queries is in between one (1) and two (2).
4.2 2D versus 3D Retrieval
The aim of the next set of experiments was to further explore the applicability of both our 2D and 3D indexing and similarity search components. Recall that the 2D indexing approach utilizes the colour and texture of the images, whilst the 3D indexing method is based on shape. The colours of protein structures provide us with a semantic key to the functionality thereof: therefore, the 2D image retrieval should provide us with a complementary view, in contrast to when we apply a shape-based description. 0 20 40 60 80 100 120 1n78(1) 1n77(1) 1g59(1) 1g59(2) 1n78(2) 1n77(2) Other 3D Rankings 2D Rankings
Figure 13: Ranking of Glutamyl-tRNA (GluRS) family members, based on 2D and 3D, respectively.
To evaluate this hypothesis, we compared the results of our 2D and 3D algorithms when retrieving the members of four (4) protein families, namely the Glutamyl-tRNA (GluRS), Ligand-gated Protein Channel, Pyridoxine 5'-Phosphate Synthase and Sex Hormone-Binding Globulinand, as listed in Table 1.
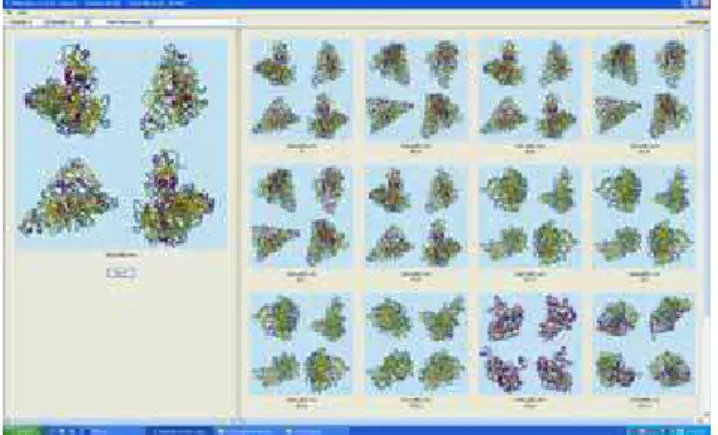
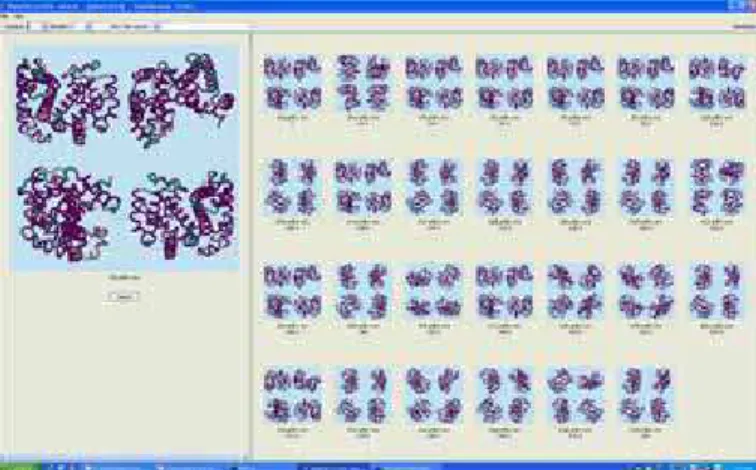
Figure 14: 3D Query results for Glutamyl-tRNA (GluRS) family members.
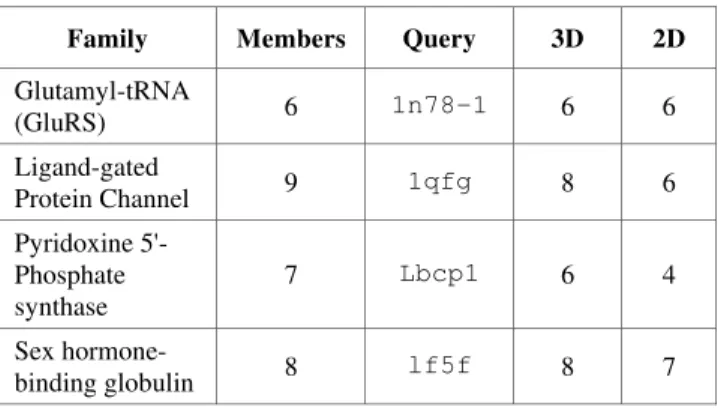
Table 2 summarizes our findings. The table indicates the number of family members, the query protein structure, as well as the number of family members the 3D and 2D similarity search algorithms retrieved as nearest neighbours, respectively. The table shows that, on the average, both the 2D and 3D methods were able to correctly identify the family members, when searching a database containing 26,000 members. However, the 3D component outperforms the 2D approach, when aiming to locate the family members. Interestingly, the two methods yield complimentary results, in that they do not rank the nearest neighbours in the same way. (This is, of course, due to the different indexing methods we employ.) This is illustrates in Figures 13 to 15, which shows the results for the Glutamyl-tRNA (GluRS) family.
Figure 15: 2D Query results for Glutamyl-tRNA (GluRS) family members.
These results can be explained as follows. Recall from Section 2 that, for the 2D images, these features are based on the colour,
texture and composition of the protein structure. For the 3D indexing, the features are described using the 3D shape.
Table 2. Results for 2D and 3D Retrieval (Number of Nearest Neighbours in Family)
Family Members Query 3D 2D
Glutamyl-tRNA (GluRS) 6 1n78-1 6 6 Ligand-gated Protein Channel 9 1qfg 8 6 Pyridoxine 5'-Phosphate synthase 7 Lbcp1 6 4 Sex hormone-binding globulin 8 lf5f 8 7
4.3 Discussion
The number of known protein structures is estimated to increase linearly [1]. There is an urgent need for data mining systems to aid the domain expert to group such new structures and to, prior to performing actual synthesis and biological studies, computationally screen candidate structures. The fast and accurate retrieval of similar protein structures from such very large databases in pertinent to unlock this potentially rich source of information, for applications such as drug design, studying protein-protein interaction, the prediction of protein function, and so on.
This section described our experimental evaluation of the CAPRI system, when applied to seven (7) diverse protein families, as obtained from the Protein Data Bank. Our results are very promising. Both visual inspection and the experimental evaluation of our results, as shown in this paper, show that the CAPRI data mining system is able to retrieve family members accurately, and effectively.
Namely, we were able to retrieve structure belonging to the same family within a database containing 26,000 structures, using only one (1) or two (2) queries at most. Also note that all of the queries were completes in less than one (1) second, which clearly illustrates the high performance of our system, considering that each comparison involved the analysis of 26,000 protein structures. Furthermore, our results indicate that the 2D and 3D components of our system are complementary, providing complementary information utilizing the 2D appearance versus the 3D shape.
Not only were we able to find most members of a family, but we were also able to locate members of other families that are very similar. This means that, in addition to locating the family members, we were also able to discover inter-family similarities. This result may prove itself to be very useful. For example, it may aid domain experts when attempting to replace a toxic or expensive protein by another one presenting the same functionality, but without the associated drawbacks.
Furthermore, it was possible to divide, for example, the Homo Sapiens Hemoglobin family into two subgroups which, despite the fact that they belong to the same family, are dissimilar enough in order to be grouped in two distinct sub-families. This result has
implication when exploring the current classification of families, classifying new families and when addressing the docking problem.
CONCLUSIONS
Similarity search of protein structures, as contained in vast multimedia databases, offers a novel way to enable molecular biologists and other role players to obtain fast, relevant information regarding the family a structure possibly belongs to. In this way, domain experts can verify whether a structure is new, a mutation, an unexpected evolution or harmful. They can also find relevant information regarding the functionality and general properties of the family it belongs too.
The paper presented the CAPRI data mining system, which indexing protein structure based on the 2D colour and texture information, as well as the 3D structure. Our experimental results show that CAPRI is able to accurately find families of proteins from a very large database. Also, these families are found very fast, making our system applicable for wide-spread use.
5. ACKNOWLEDGMENTS
Herna L Viktor wishes to acknowledge financial support by the Canadian Foundation for Innovation (CFI) and National Science and Engineering Research Council (NSERC) of Canada.
6. REFERENCES
[1] Murzin, A.G., Brenner, S.E., Hubbard, T. and Chothia, C., SCOP: A Structural Classification of Proteins Database of the Investigation of Sequences and Structures, Journal of Molecular Biology, Volume 247, 1995, 536-540.
[2] Ohkawa, T., Hirayama, S. and Nakamura, H. A Method of Comparing Protein Structures Based on Matrix Representation of Secondary Structure Pairwise Topology, In Proceedings of the International Conference on
Information Intelligence and Systems ( Bethesda, MD, USA),
1999, 10-15.
[3] Ankers, M., Kastenmuller, G., Kriegel, H-P and Siedi, T. Nearest Neighbor Classification in 3D Protein Databases. In
Proceedings of the Seventh International Conference on Intelligent Systems for Molecular Biology (ISMB99)
(Heidelberg, Germany), AAAI Press, 1999, 34-43.
[4] Park, S.-H., Park, S.-J. and Park, S.H., A Protein Structure Retrieval System Using 3D Edge Histogram, Key Engineering Materials, Vols. 277-279, 2005, 324-330. [5] Yeh, J.-S., Chen, D.-Y. and Ouhyoung, M., A Web-based
Protein Retrieval System by Matching Visual Similarity, Bioinformatics, Vol. 21, no 13, 2005, 3056-3057.
[6] Han, J. and Kamber, M., Data Mining: Concepts and Techniques, 2nd Edition, Morgan Kaufman Publisher, USA, 2006.
[7] Tung, A.K.H,, Zhang, R., Koudas, N. and Ooi, B.C., Similarity Search: A Matching Based Approach, In Very
Large Data Bases (VLDB’06) (Seoul, Korea), 2006,
642.
[8] Ohkawa, T., Nonomura, Y. and Inoue, K., Logical Cluster Construction in a Grid Environment for Similar Protein Retrieval, In Proceeding of the 2004 International Symposium on Applications and the Internet Workshops (SAINTW’04) (Tokyo, Japan), 2004, 5-16.
[9] Chi, P.H., Scott, G. and Shyu, C.-R., A Fast Protein Structure System Using Image-Based Distance Matrices and Multidimensional Index, In Proceeding of the Fourth IEEE
Symposium on Bioinformatics and Bioengineering (BIBE’04) (Taichung, Taiwan), 2004, 522-532.
[10] Akbar, S., Kung, J. and Wagner, R., Exploiting Geometrical Properties of Protein Similarity Search, In Proceeding of the
17th International Conference on Database and Expert Systems Applications (DEXA’06) (Krakow, Poland), 2006,
228-234.
[11] Bratley, P. and Fox, B. L., ALGORITHM 659: implementing Sobol's quasirandom sequence generator,ACM Transactions on Mathematical Software,