Publisher’s version / Version de l'éditeur:
Vous avez des questions? Nous pouvons vous aider. Pour communiquer directement avec un auteur, consultez la première page de la revue dans laquelle son article a été publié afin de trouver ses coordonnées. Si vous n’arrivez pas à les repérer, communiquez avec nous à PublicationsArchive-ArchivesPublications@nrc-cnrc.gc.ca.
Questions? Contact the NRC Publications Archive team at
PublicationsArchive-ArchivesPublications@nrc-cnrc.gc.ca. If you wish to email the authors directly, please see the first page of the publication for their contact information.
https://publications-cnrc.canada.ca/fra/droits
L’accès à ce site Web et l’utilisation de son contenu sont assujettis aux conditions présentées dans le site LISEZ CES CONDITIONS ATTENTIVEMENT AVANT D’UTILISER CE SITE WEB.
12th Canadian Conference on Building Science and Technology [Proceedings],
pp. 1-12, 2009-05-06
READ THESE TERMS AND CONDITIONS CAREFULLY BEFORE USING THIS WEBSITE.
https://nrc-publications.canada.ca/eng/copyright
NRC Publications Archive Record / Notice des Archives des publications du CNRC :
https://nrc-publications.canada.ca/eng/view/object/?id=92df0a5b-ec02-4052-be3a-23799af742c2 https://publications-cnrc.canada.ca/fra/voir/objet/?id=92df0a5b-ec02-4052-be3a-23799af742c2
NRC Publications Archive
Archives des publications du CNRC
This publication could be one of several versions: author’s original, accepted manuscript or the publisher’s version. / La version de cette publication peut être l’une des suivantes : la version prépublication de l’auteur, la version acceptée du manuscrit ou la version de l’éditeur.
Access and use of this website and the material on it are subject to the Terms and Conditions set forth at
A field monitoring study of interstitial condensation in wood-frame
walls in cold climate
http://irc.nrc-cnrc.gc.ca
A fie ld m onit oring st udy of int e rst it ia l
c onde nsat ion in w ood-fra m e w a lls in c old
clim at e
N R C C - 5 1 2 7 3
A r m s t r o n g , M . ; M a r e f , W . ; R o u s s e a u , M . Z . ; L e i ,
W . ; N i c h o l l s , M .
J u l y 2 0 0 9
A version of this document is published in / Une version de ce document se trouve dans:
12th Canadian Conference of Building Science and Technology, Montreal, QC,
May 6-8, 2009, pp. 1-12.
The material in this document is covered by the provisions of the Copyright Act, by Canadian laws, policies, regulations and international agreements. Such provisions serve to identify the information source and, in specific instances, to prohibit reproduction of materials without written permission. For more information visit http://laws.justice.gc.ca/en/showtdm/cs/C-42
Les renseignements dans ce document sont protégés par la Loi sur le droit d'auteur, par les lois, les politiques et les règlements du Canada et des accords internationaux. Ces dispositions permettent d'identifier la source de l'information et, dans certains cas, d'interdire la copie de documents sans permission écrite. Pour obtenir de plus amples renseignements : http://lois.justice.gc.ca/fr/showtdm/cs/C-42
A FIELD MONITORING STUDY OF INTERSTITIAL CONDENSATION
IN WOOD-FRAME WALLS IN COLD CLIMATE / ÉTUDE DE SUIVI SUR
LE TERRAIN PORTANT SUR LA CONDENSATION INTERSTICIELLE
DANS LES MURS À OSSATURE DE BOIS SOUS LES CLIMATS FROIDS
M.M. Armstrong, W. Maref, M. Rousseau, W. Lei and M. Nicholls National Research Council Canada
Ottawa, Ontario, Canada ABSTRACT / RÉSUMÉ
At NRC-IRC’s new Field Exposure of Wall Facility (FEWF), experiments with three identical test specimens of traditional 38 x 140 mm (2x6) wood-frame wall construction were conducted in Fall 2006 and continued until spring 2007 to benchmark the facility and commission the data acquisition system. From Jan to April 2007, two of the three test specimens were subjected to different levels of indoor relative humidity and air leakage to examine the condensation potential in different layers of the wall assemblies and to yield valuable information on the systems’ characteristics and performance. Testing was conducted with and without specific “deficiencies” (i.e., an opening) in the air/vapour barriers of two of the three specimens, to characterize the response of the walls to air leakage in terms of condensation potential and moisture content of moisture-sensitive materials. This paper focuses on the hygrothermal response of the test specimens and gives highlights of experimental results and analysis for the first year of operation.
A l’automne 2006 des expériences ont été menées à la nouvelle installation d’exposition in-situ des murs de l’IRC avec trois (3) échantillons d’essai identiques d’une construction de mur à ossature de bois traditionnelle de 38 mm x 140 mm (2x6) et se sont poursuivies jusqu’au printemps 2007, aux fins de mise en service de ladite installation et du système d’acquisition de données. De janvier à avril 2007, on a soumis deux (2) des trois échantillons d’essai à différents taux d’humidité relative et de fuite d’air à l’intérieur dans le but d’examiner le potentiel de condensation en diverses couches des ensembles muraux et de produire une information précieuse sur les caractéristiques et la performance des systèmes. Les essais se sont poursuivis avec et sans « défauts » particuliers (soit des ouvertures) dans le pare-air/vapeur de deux (2) des trois échantillons afin de caractériser la réponse des murs à l’écoulement d’air en termes de potentiel de condensation et de teneur en humidité des matériaux sensibles à l’humidité. Cet article est centré sur la réponse hygrothermique des échantillons d’essai; on y expose les points saillants des résultats expérimentaux et de l’analyse qui en est faite pour la première année d’exploitation.
INTRODUCTION
In 2006, a field monitoring facility was built at the National Research Council - Institute for Research in Construction to examine the effects of different envelope characteristics on interstitial moisture
accumulation. During the first winter of research, three identical test specimens of traditional 38x140 mm (2x6) wood-frame wall construction were assembled and tested as part of a study to commission the facility. These specimens were exposed to different levels of indoor relative humidity and air leakage to examine the condensation potential in different layers of the assemblies. This paper focuses on the hygrothermal response of these test specimens and gives highlights of experimental results and analysis for the first year of operation.
FIELD EXPOSURE OF WALLS FACILITY
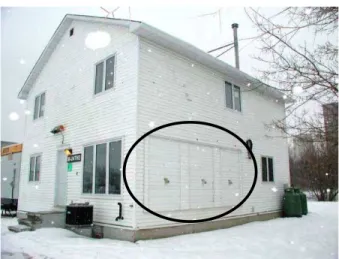
NRC-IRC’s new Field Exposure of Walls Facility (FEWF), a field monitoring facility, complements other NRC-IRC laboratory and numerical modeling capabilities (hygIRC 1D and 2D) to investigate heat, air and moisture transfer across the building envelope to assist the building industry in developing integrated solutions. The wall testing capability of the upgraded research house is used to assess innovative wall assemblies relative to variable indoor conditions over multiple seasons. The FEWF is part of the recently upgraded Ventilation and Walls research house, located on the NRC campus in Ottawa, Canada (Figure 1). A description of the house and research program can be found in Maref et al. 2007.
FIGURE 1: THE VENTILATION AND WALLS RESEARCH HOUSE SHOWING THE LOCATION OF THE FEWF ON THE WEST FAÇADE
RESEARCHMETHODOLOGY
OBJECTIVES
The first year of operation of the FEWF was a commissioning year. There were three main objectives for this season: 1) To validate the premise that side-by-side hygrothermal comparison of test specimens could be conducted without creating different conditions of exposure for each test specimen based on its
location on the research house façade; 2) To ensure that the experimental research set up and the instrumentation deployed in strategic locations for investigating the hygrothermal response of wall assemblies was effective and could reliably characterize the test specimen response; 3) To collect data to aid in characterizing the response of exterior walls to heat, air and moisture (HAM) transfer and the benchmarking of numerical HAM models.
TEST SPECIMENS
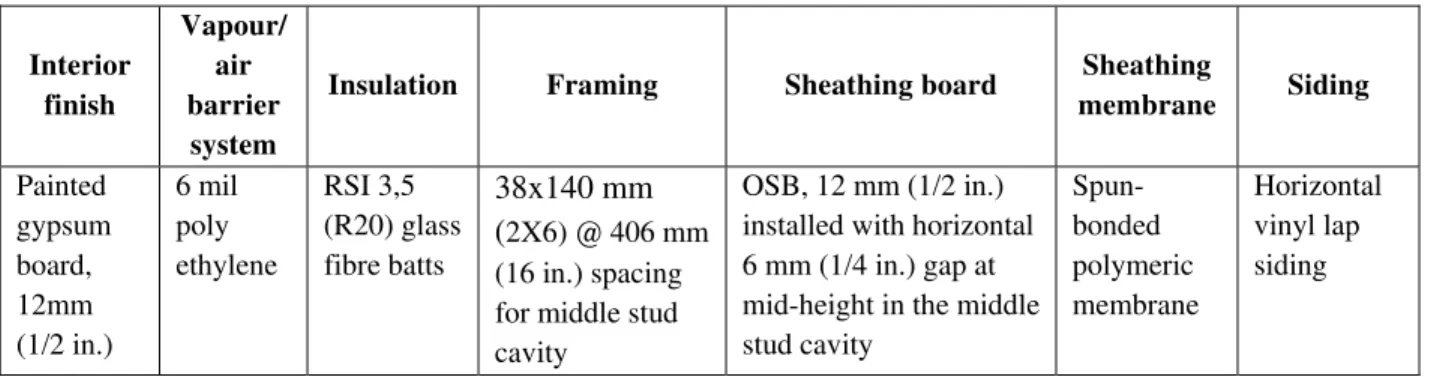
To commission the test facility, three identical test specimens were built side by side at the FEWF in fall 2006. The test walls were of traditional 38 x 140 mm (2x6) wood frame construction (see Table 1). As shown in Figure 3, the specimens were 1780 mm (70 in.) high and included three stud cavities with an on centre spacing of 381 mm (15 in.), 406 mm (16 in.) and 381 mm (15 in.). At mid-height of the middle stud cavity of the test specimens, a 6 mm (1/4 in.) horizontal gap was introduced in the exterior sheathing to replicate an open horizontal joint between horizontal sheathing boards. Extruded polystyrene insulation (76 mm [3 in.]), and self-adhered air barrier/vapour barrier membranes were used to minimize lateral heat, air and moisture exchange between specimens as well as between specimens and the surrounding walls of the research house.
TABLE 1: DESCRIPTION OF THE SPECIMENS – YEAR 1 (2006/07) Interior finish Vapour/ air barrier system
Insulation Framing Sheathing board Sheathing
membrane Siding Painted gypsum board, 12mm (1/2 in.) 6 mil poly ethylene RSI 3,5 (R20) glass fibre batts 38x140 mm (2X6) @ 406 mm (16 in.) spacing for middle stud cavity
OSB, 12 mm (1/2 in.) installed with horizontal 6 mm (1/4 in.) gap at mid-height in the middle stud cavity Spun-bonded polymeric membrane Horizontal vinyl lap siding
INDOOR CLIMATIC CHAMBER
To investigate the effects of an increase of indoor humidity levels on moisture content of wood-based materials, an indoor climatic chamber was constructed to introduce high humidity and increased air pressure levels on the interior side of Walls 2 and 3. Wall 1 was kept as a control wall, and exposed to uncontrolled indoor room conditions (i.e. low RH in winter). Pressure, humidity and temperature conditions were regulated and monitored throughout the field trial in the indoor climatic chamber. INSTRUMENTATION
Several monitoring instruments were used to characterize hygrothermal response in the different layers of the wall assembly. The middle stud cavity was designed to be the focus of the study, with the stud cavities on either side acting as a buffer zone. For this reason the majority of instrumentation was located in the middle stud of each wall, as shown in Figure 2. The instrumentation was deployed at four heights (Figure 3), with most sensors concentrated in the large area below the gap in the exterior sheathing - where it was assumed moist air exfiltration would lead to wetting. All sensor data was recorded at a 15-minute time step. Temperatures were measured with an accuracy of +0.1°C, while relative humidity measurements were accurate to +3%.
Pressure sensors installed in the test specimens measured the differential air pressure between the pressure taps, at locations shown in Figure 2, and the ambient room pressure (not the indoor climatic chamber pressure). Pressure taps were located in the top half of the middle stud cavity, 254 mm (10 in.) above the gap in the exterior sheathing.
FIGURE 2: LAYOUT OF THE INSTRUMENTATION FOR ALL TEST SPECIMENS
In addition to the sensors shown in Figure 2, moisture detection tape was included at a number of layers in the assembly to detect both surface liquid and when appropriate, the moisture content of components. The moisture detection tape relies on a straightforward concept: water conducts electricity. The tape was composed of four thin parallel strips of copper on a special non-absorptive polymeric fabric, which was self-adhered to the surface of the material of interest. Two of these strips were dedicated to detecting
Instrumentation - Plan View
Interior
Drywall Air/Vapour Barrier Stud Cavity with Glass Fibre Insulation Vinyl Siding
Sheathing Membrane OSB
Air Pressure sensor
Moisture Pins RH and T sensor
Thermocouple
Exterior
Wireless RH&T Sensor
liquid water. When the fabric between these two strips of copper was wet, the electrical resistance dropped below a set threshold of 100 000 ohm. The second set of copper strips worked on the same principle but were dedicated to measuring the moisture content of building materials, as brad nails were inserted into a building material to measure change in electrical resistance in that location (Vokey et al., 2006). This paper includes only the results obtained from the liquid water detection portion of the moisture detection tape, and not the moisture content results.
The moisture detection tapes were deployed in locations most likely to experience the presence of
moisture, based on the experimental design. These were at different heights along the interior and exterior faces of the sheathing board, on the bottom portions of the lumber making up the stud cavity (i.e. bottom plate and vertical sides of studs), and on the exterior face of the sheathing membrane (Figures 3 and 18). Resistance measurements from the moisture detection tape were recorded every 10 minutes.
This paper primarily presents the results from the relative humidity and temperature (RH and T) sensors (shown as X’s in Figures 2 and 3), the pressure sensors (shown as triangles in Figure 2) and the values of electrical resistance obtained from the moisture detection tape (Figure 3). Additional details on
instrumentation and wall construction can be found in Maref et al. (In Press), Year 1 report.
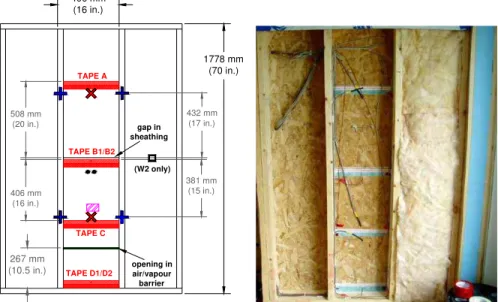
FIGURE 3: LAYOUT OF MOISTURE DETECTION STRIPS AND INSTRUMENTATION ON THE INTERIOR FACE OF THE OSB (REFER TO FIGURE 2 FOR LEGEND)
381 mm (15 in.) 406 mm
(16 in.)
TEST PROTOCOL
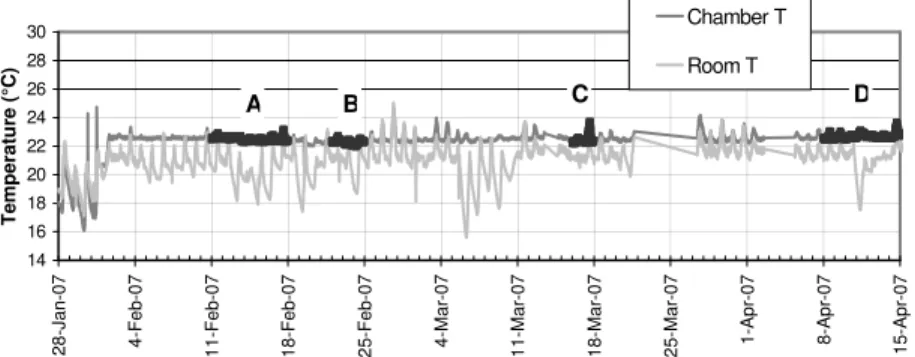
Wall 2 and Wall 3 were subjected to a variety of indoor and exterior environmental conditions during early 2007; these are summarized in the graphs given in Figures 4 through 7. Chamber climate conditions were controlled and thus were very different from room conditions. The room temperature fluctuated throughout the testing period, and was generally cooler than the indoor climatic chamber temperature given that a heater was placed in the indoor climatic chamber to maintain a minimum temperature of 22.5°C. The room was also very dry compared to the indoor climatic chamber, 15% RH for most of January and February, and 20-25% RH for March and April. Thus, the control test wall (Wall 1) was exposed to cooler and much dryer conditions as compared to the other two test walls whose interior face was conditioned to that of the indoor climatic chamber.
Wall 2 and Wall 3 were subjected to varying indoor conditions of relative humidity and pressure from mid-February to mid-April 2007. Four periods were selected for intensive analysis (labeled A to D
TAPE D1/D2 TAPE C 508 mm (20 in.) TAPE B1/B2 TAPE A 432 mm (17 in.) (W2 only) 1778 mm (70 in.) 406 mm (16 in.) opening in air/vapour barrier gap in sheathing 267 mm (10.5 in.)
respectively), as described in Table 2 and highlighted in Figures 4 to 7. To explore the potential for wetting and drying when varying the degree of air leakage across the wall assembly, the specimen air leakage characteristics were modified during testing to represent two levels of increased leakiness as compared to a perfectly airtight assembly. To encourage air leakage, an elongated opening was made in the polyethylene air/vapour barrier and the drywall of Wall 2 and Wall 3, 267 mm (10.5 in.) above the base plate (shown in Figure 3). This opening spanned the width of the centre stud cavity, and was either 3 or 6 mm high depending on the degree of leakiness specified for the test condition.
0 10 20 30 40 50 60 70 80
28-Jan-07 4-Feb-07 11-Feb-07 18-Feb-07 25-Feb-07 4-Mar-07 11-Mar-07 18-Mar-07 25-Mar-07 1-Apr-07 8-Apr-07 15-Apr-07
RH(%) Chamber RH Room RH A B C D
FIGURE 4: ROOM AND INDOOR CLIMATIC CHAMBER AIR RELATIVE HUMIDITY
-6 -4 -2 0 2 4 6 8 10 28- Jan-07 4- Feb-07 11- Feb-07 18- Feb-07 25- Feb-07 4 -Ma r-0 7 11-M ar -07 18-M ar -07 25-M ar -07 1 -A p r-0 7 8 -A p r-0 7 15-Apr -07 Pressure (Pa) A B C D
FIGURE 5: CLIMATIC CHAMBER PRESSURE (RELATIVE TO ROOM PRESSURE)
-30 -20 -10 0 10 20 30 28- Jan-07 4- Feb-07 11- Feb-07 18- Feb-07 25- Feb-07 4 -M a r-0 7 11-Mar -0 7 18-Mar -0 7 25-Mar -0 7 1 -Ap r-0 7 8 -Ap r-0 7 15-Apr -07 Temperature (°C) A B C D
FIGURE 6: HOURLY AVERAGES OF OUTDOOR AIR TEMPERATURE (ENVIRONMENT CANADA RECORDS; OTTAWA INTERNATIONAL AIRPORT)
14 16 18 20 22 24 26 28 30 28- Jan-07 4- Feb-07 11- Feb-07 18- Feb-07 25- Feb-07 4 -M a r-0 7 11-Mar -07 18-Mar -07 25-Mar -07 1 -Ap r-0 7 8 -Ap r-0 7 15-Apr -07 Temperature (°C) Chamber T Room T A B C D
TABLE 2: ANALYSIS PERIODS AND CONDITIONS
Condition
Indoor Climatic Chamber Opening in the air barrier system and drywall Test period (2007) Range of Outdoor T (°C) Pressure (relative to room air) RH
A 0 Pa 70% None 11 Feb – 18 Feb -24.5 to -3.3 B 5 Pa 50% 6 X 400 mm 22 Feb – 24 Feb -14.3 to -4.6 C 5 Pa ~30% 3 X 400 mm 16 Mar – 17 Mar -10.0 to -4.4 D 0 Pa 50% 3 X 400 mm 8 Apr – 15 Apr -6.4 to 6.3 EXPERIMENTAL RESULTS
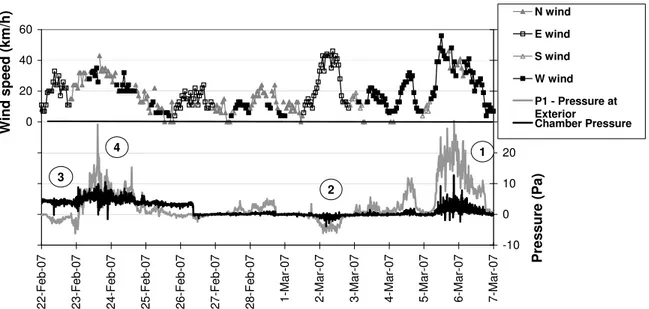
WIND EFFECTS ON INFILTRATION AND EXFILTRATION
-80 -60 -40 -20 0 20 40 60 22-F eb-07 23-F eb-07 24-F eb-07 25-F eb-07 26-F eb-07 27-F eb-07 28-F eb-07
1-Mar-07 2-Mar-07 3-Mar-07 4-Mar-07 5-Mar-07 6-Mar-07 7-Mar-07
Pressure (Pa) -10 0 10 20 30 40 50 60 Wind speed (km/h) N wind E wind S wind W wind P1 - Pressure at Exterior Chamber Pressure 1 2 3 4
FIGURE 8: SAMPLE EFFECT OF WIND SPEED AND DIRECTION ON MEASURED PRESSURE
An important link was observed between wind effects and pressure forces acting on the walls. Figure 8 illustrates the effect of wind speed and direction on air infiltration and exfiltration conditions across Wall 2 and Wall 3. The top of this plot contains wind speed and direction data taken from the Ottawa
International Airport, while exterior pressure and indoor climatic chamber pressure are plotted on the lower portion of the graph. While local wind data would have been preferable, none was available for the duration of the experiment. Whenever exterior pressure exceeded chamber pressure, the test specimens experienced air infiltration – driving dry winter outdoor air into the wall assembly. Whereas indoor air exfiltration occurred whenever exterior pressure was lower than the indoor climatic chamber pressure, thus driving warm humid air from the indoor climatic chamber into the wall assembly. Since the test walls of the FEWF are located on the west side of the test house, strong westerly winds caused a rise in pressure difference across the test walls resulting in air infiltration (Figure 8; #1). A pressurization of the indoor climatic chamber of 5 Pa was not sufficient to overcome the positive wind pressure when a westerly or northerly wind in excess of 20 km/h was experienced (e.g. Figure 8; #4). Conversely, strong
easterly winds caused a negative pressure on the west façade that resulted in conditions suitable for air exfiltration; however, this effect was less pronounced than those evident for westerly prevailing wind conditions (Figure 8; #2 and #3). This is possibly due, in part, to the counterbalancing effect of an inward driving pressure due to the stack effect acting on the house; given the test specimens are located on the first floor of this two-storey research house, below the neutral pressure plane, it is supposed that a negative pressure occurs across the assembly when no wind acts on the test walls.
CONDITION A- RESULTS
In Condition A (8-day period), the three test walls did not include an opening in the drywall or air/vapour barrier; i.e. the air barrier was considered airtight. Both Wall 2 and Wall 3 were exposed to indoor climatic chamber conditions of very high humidity, 70% RH, and no pressurization. Wall 1 remained exposed to the dry room conditions. With a well-sealed interior and no indoor pressurization, the pressure in the stud cavity closely followed the changes in exterior pressure.
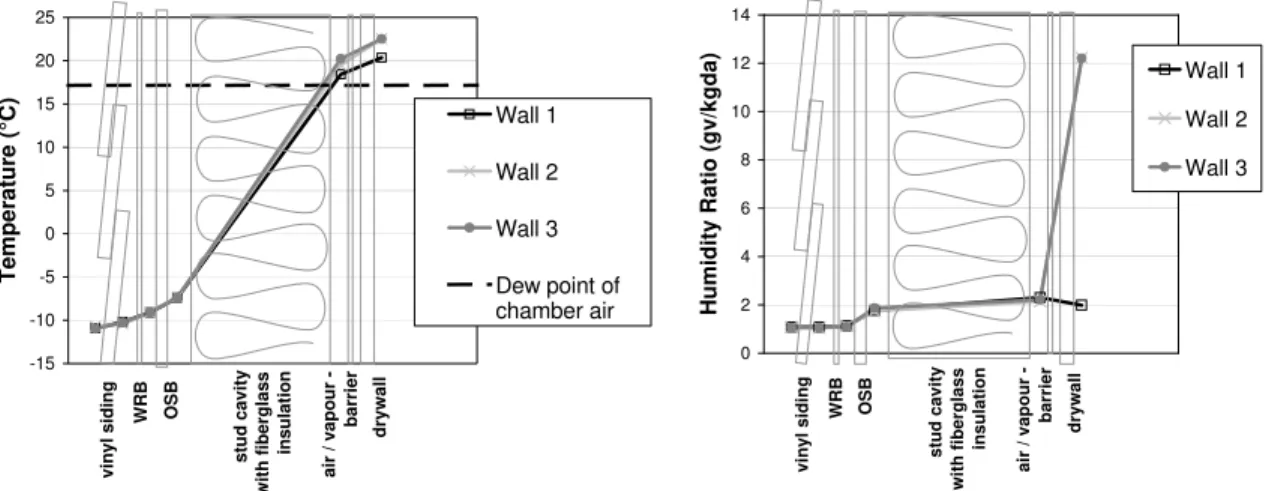
Condition A was the coldest of the four periods analyzed. Outdoor temperatures dropped below -24°C and were on average just below -10°C. The resulting average temperature distribution in the wall for the full 8-day period is displayed in Figure 9A. These temperatures were measured by RH&T sensors located in the bottom section of the test specimen. The average surface temperatures of elements located to the exterior of the air/vapour barrier were below the dewpoint temperature of the indoor chamber air providing favourable conditions for the formation of condensation in the insulation and at the surface of the sheathing board should indoor chamber air (at 70% RH) exfiltrate through the assembly to these locations. However, RH measurements showed that no chamber moisture entered the stud cavity, and the moisture detection tapes did not reveal the presence of any liquid. This can be explained by the
contribution of two factors: the air-vapour barrier was functional and without imperfections so there was little opportunity for moisture exchange between the moist indoor chamber and the building materials in the assembly experiencing below dew point temperature, and wind conditions promoted air infiltration for the majority of this condition. As shown in Figure 9B, despite the chamber air having an average
humidity ratio in excess of 12 gv/kgda (grams of water vapour per kg dry air), the average humidity ratio of the air in the stud cavity was nearly identical to that of the control wall (Wall 1) for this same period, at approximately 2 gv/kgda. -15 -10 -5 0 5 10 15 20 25 T emp er at u re ( °C) Wall 1 Wall 2 Wall 3 Dew point of chamber air vinyl siding WRB OSB stud cavit y with fiberglass insulat ion air / vapour - barrier drywall 0 2 4 6 8 10 12 14 H u mi di ty R ati o (gv/ kgda) Wall 1 Wall 2 Wall 3 vinyl siding WRB OSB stud cavit y with fiberglass insulation air / vapour -barrie r drywall
FIGURE 9: (A) AVERAGE TEMPERATURE DISTRIBUTION THROUGH THE WALLS DURING CONDITION A (B) AVERAGE HUMIDITY LEVEL DISTRIBUTION THROUGH THE WALLS FOR CONDITION A
CONDITION B- RESULTS
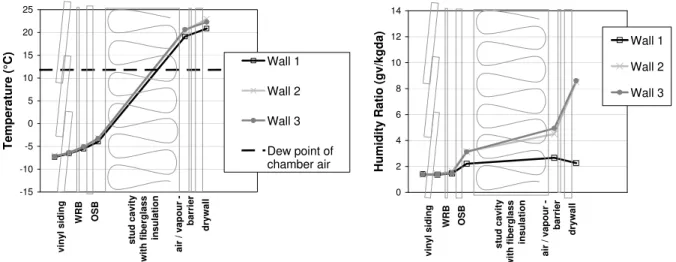
specimens Wall 2 and Wall 3, and a 5 Pa positive pressure and 50% relative humidity were applied to the interior side of these test walls. While outdoor temperatures were warmer on average than that
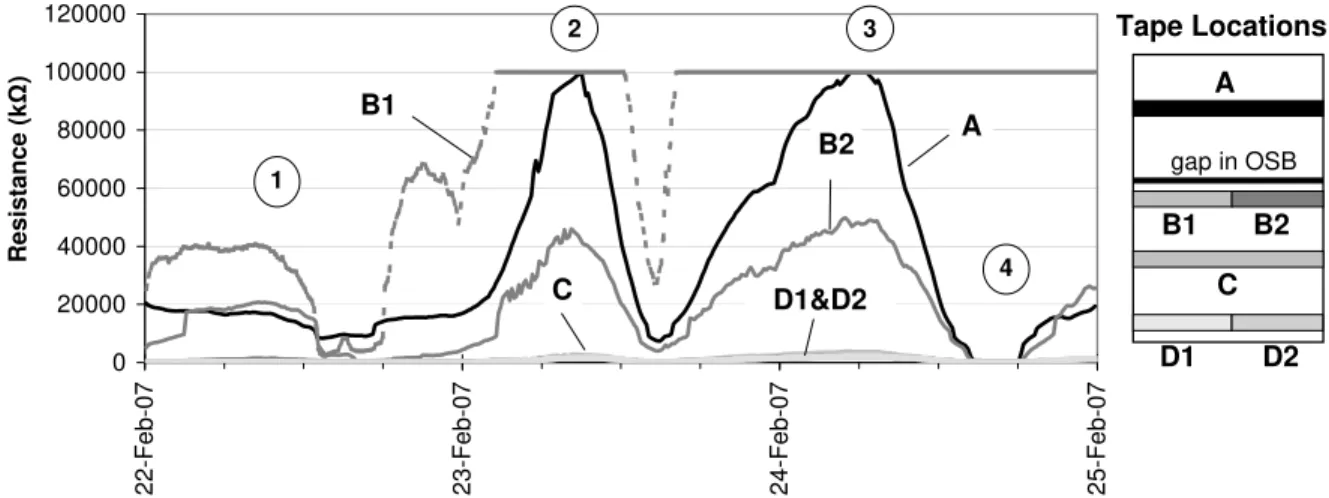
experienced during the 8 days of Condition A, and the indoor chamber RH was 20 percentage points lower, the exterior half of the insulated stud cavity was still below the dewpoint temperature of the chamber air (Figure 10A). Additionally, the 5 Pa pressure created exfiltration conditions across the walls during part of that period (Figure 11), causing humid indoor chamber air to enter the stud cavity through the deficiency in the air/vapour barrier. This resulted in an increase in humidity levels in the stud cavity of Walls 2 and 3 of on average 2 gv/kg da above the level found in a the stud cavity of the control wall (Figure 10B). Under these conditions, condensation was expected in the stud cavity, and readings from the moisture detection tapes located on the interior surface of the sheathing board of Wall 2 confirmed the presence of liquid moisture (Figure 12). As is evident in Figures 11 and 12 (#1 and #4), during periods of exfiltration, there was a reduction in resistance of the detection tape, indicating the presence of liquid. Whereas, during periods of infiltration (Figures 11 and 12; #2 and #3), resistance was seen to increase – indicating drying. Drying was most prominent at the top of the wall (tape A), while the resistance of the tapes at the base of the wall (tape C, D1 and D2) remained low. Similar phenomena were observed in Wall 3. This is in line with the tendency for water to run down the face of the sheathing board, and was also in agreement with liquid detection tape measurements at the bottom plate (Figure 17).
-15 -10 -5 0 5 10 15 20 25 T e mp erat u re ( °C ) Wall 1 Wall 2 Wall 3 Dew point of chamber air vinyl siding WRB OS B stud cavit y with fiberglass insulation air / vapour -barrie r drywall 0 2 4 6 8 10 12 14
Humidity Ratio (gv/kgda)
Wall 1 Wall 2 Wall 3 v iny l s idi ng WRB OSB stu d cavit y with fib er g lass in su latio n a ir / v a pour - barri e r d rywall
FIGURE 10: (A) AVERAGE TEMPERATURE DISTRIBUTION THROUGH THE WALLS DURING CONDITION B (B) AVERAGE HUMIDITY LEVEL DISTRIBUTION THROUGH THE WALLS FOR CONDITION B
-80 -60 -40 -20 0 20 40 60
22-Feb-07 23-Feb-07 24-Feb-07 25-Feb-07
Pressure (Pa) -10 0 10 20 30 40 50 60 Wind speed (km/h) N wind E wind S wind W wind Exterior Pressure (P1) Chamber Pressure 1 2 3 4
0 20000 40000 60000 80000 100000 120000
22-Feb-07 23-Feb-07 24-Feb-07 25-Feb-07
Resistance (k Ω ) A B1 B2 C D1&D2 Tape Locations A B1 B2 C D1 D2 gap in OSB 1 2 3 4
FIGURE 12: LIQUID DETECTION ON THE INTERIOR SURFACE OF WALL 2 OSB DURING CONDITION B
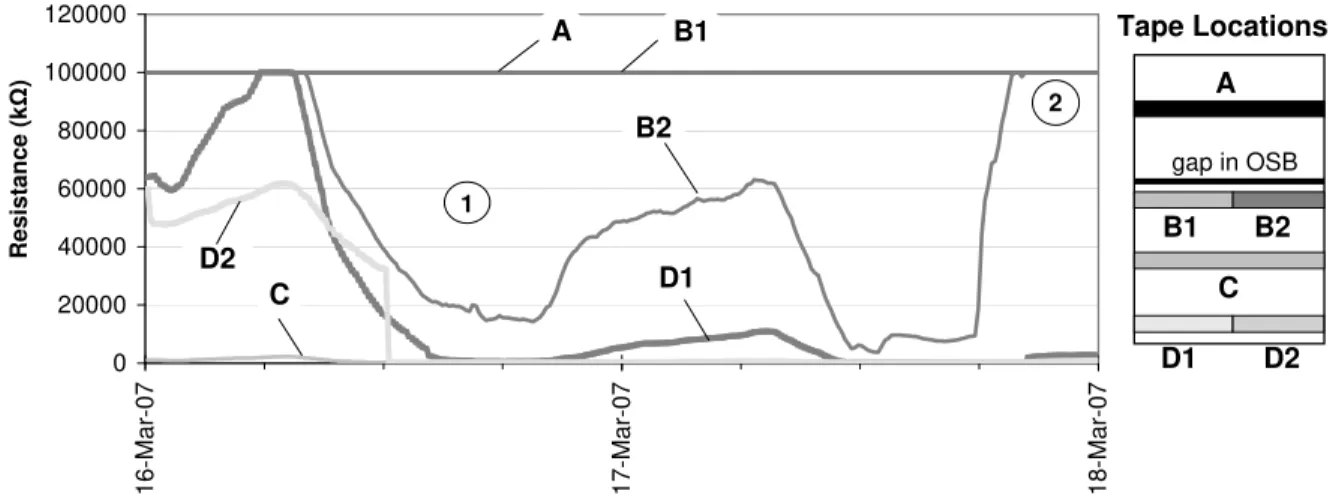
CONDITION C- RESULTS
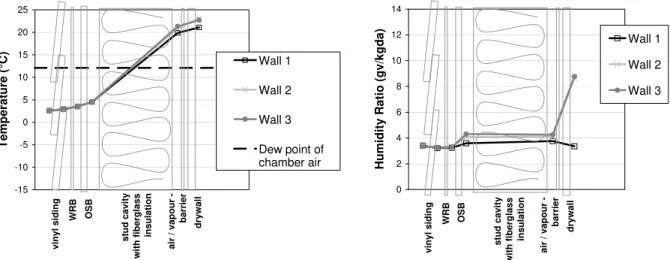
During Condition C (2-day period), 5 Pa of pressure was applied to the interior side of Wall 2 and Wall 3. Chamber humidity was approximately 30% during this period, resulting in a lower dew point temperature than that of Condition B. However, average temperatures at the interior face of the sheathing board were again below the dew point temperature for chamber air (Figure 13A). Condensation would be expected, provided moist chamber air reached the interior face of the sheathing board. In fact, RH and T
measurements indicated that moist indoor air from the climatic chamber entered the stud cavity; as well, the liquid detection tapes confirmed that condensation took place at the bottom portion of the sheathing board. The humidity ratio of air near the interior face of the sheathing board was only slightly lower than the chamber (Figure 13B), and was higher than the control wall (Wall 1) conditions. Pressure
measurements showed that the 5 Pa chamber pressure effectively produced exfiltration conditions for three quarters of the 2-day period (Figure 14, #1). At the end of this period, northerly and westerly winds balanced the 5 Pa chamber pressure (# 2). During condition C, water was detected on the surface of the sheathing board at locations below the horizontal 6 mm gap (Figure 15). The detection tapes with the lowest electrical resistance were again those located at the base of the sheathing board, at the bottom plate (Figure 17). -15 -10 -5 0 5 10 15 20 25 T e mp er atu re (°C) Wall 1 Wall 2 Wall 3 Dew point of chamber air v iny l s iding WRB OSB stu d cavi ty w ith fi b e rg lass ins u la tion a ir / v a pour - barri e r d ryw al l 0 2 4 6 8 10 12 14
Humidity Ratio (gv/kgda)
Wall 1 Wall 2 Wall 3 vi n y l s idin g WRB OSB stud cavi ty wi th fi bergl ass ins u la ti on air / vapour - barrier drywal l
FIGURE 13: (A) AVERAGE TEMPERATURE DISTRIBUTION THROUGH THE WALLS DURING CONDITION C (B) AVERAGE HUMIDITY LEVEL DISTRIBUTION THROUGH THE WALLS FOR CONDITION C
-80 -60 -40 -20 0 20 40 60
16-Mar-07 17-Mar-07 18-Mar-07
P ressure (P a) -10 0 10 20 30 40 50 60 W ind speed (km/h) N wind E wind S wind W wind Exterior Pressure (P1) Chamber Pressure 1 2
FIGURE 14: WIND AND PRESSURE CONDITIONS DURING CONDITION B
0 20000 40000 60000 80000 100000 120000
16-Mar-07 17-Mar-07 18-Mar-07
Resistance (k Ω ) A B1 B2 C D2 Tape Locations A B1 B2 C D1 D2 gap in OSB 1 2 D1
FIGURE 15: LIQUID DETECTION ON THE INTERIOR SURFACE OF WALL 2 OSB DURING CONDITION C
CONDITION D- RESULTS
During Condition D (7-day period), exterior temperatures averaged above 0°C. No chamber pressure was applied and the chamber humidity level was raised to 50% RH. In these conditions, the average surface temperature of the sheathing board was still below the dewpoint temperature of the indoor chamber air (Figure 16A). Without internal pressurization and with westerly winds prevailing during most of this period, the walls were mainly in a state of infiltration. For only 2 out of 7 days an easterly wind prevailed, generating at most a pressure difference of 2 Pa to drive air exfiltration. Humidity
measurements in the stud cavity reflected these infiltration-dominated conditions (Figure 16B). While the humidity ratio of chamber air was above 8 gv/kgda, air in the stud cavity of Walls 2 and 3 contained on average, only 4 gv/kgda – similar to exterior conditions, and only slightly higher than conditions in the control wall. No liquid was detected at any tape located in the walls.
-15 -10 -5 0 5 10 15 20 25 T e mp eratu re (°C) Wall 1 Wall 2 Wall 3 Dew point of chamber air vi nyl si di n g WRB OSB stud cavi ty wi th fi bergl ass ins u la ti on ai r /
vapour - barrier drywal
l 0 2 4 6 8 10 12 14 H umidity R a tio (gv/kgda) Wall 1 Wall 2 Wall 3 vi n y l s idin g WRB OSB stud cavi ty wi th fi bergl ass in sul ati on ai r vapour -barrier drywal l /
FIGURE 16: (A) AVERAGE TEMPERATURE DISTRIBUTION THROUGH THE WALLS DURING CONDITION D (B) AVERAGE HUMIDITY LEVEL DISTRIBUTION THROUGH THE WALLS FOR CONDITION D
VISUAL OBSERVATIONS
The liquid detection tape on the bottom plate of the stud cavity of both Wall 2 and 3 indicated the presence of liquid beginning February 19th – when the opening in the air/vapour barrier was first
introduced and the chamber was first pressurized. to 5 Pa. Although the chamber pressure was removed March 19th, liquid was still detected until March 25th. Wetting was present during both Conditions B and
C, likely due to water that had condensed on the interior surface of the sheathing board, drained down its surface and pooled on the bottom plate. In the spring, the bottom sections of Wall 2 and Wall 3 were exposed and water staining was observed on the bottom plate in the central stud cavity for both Wall 2 (Figure 18) and Wall 3. This confirmed the presence of water as detected by the liquid detection tapes. No water stains were observed on the bottom sections of the sheathing boards.
0 20000 40000 60000 80000 100000 120000
28-Jan-07 4-Feb-07 11-Feb-07 18-Feb-07 25-Feb-07 4-Mar-07 11-Mar-07 18-Mar-07 25-Mar-07 1-A
pr-07 8-A pr-07 15-A pr-07 Resi stance (ohms) A B C D
FIGURE 18. THE BASE OF THE STUD CAVITY OF WALL 2, BEFORE AND AFTER THE FIRST YEAR OF TESTING
CONCLUSIONS
During the early months of 2007, three test walls of typical 38 x 140 mm (2x6) wood frame construction were evaluated in the Field Exposure of Walls facility (FEWF), a new field exposure facility located at the NRCC in Ottawa, Canada. This initial study was primarily used to validate the experimental concept and technical merits of the facility; it also yielded some useful preliminary results. The results showed that the three identical test specimens, not unexpectedly, provided very similar response when exposed to the same climatic conditions. The facility also provided successful tracking of T, RH, Pressure, and the pressure of moisture, such that the response of the wall could be adequately characterized.
The experimental methodology and instrumentation provided substantial insight into the hygrothermal performance of wall assemblies under varying conditions. The deployment of water detection tape proved valuable in confirming the presence of surface water at different layers through the wall when
temperature and humidity conditions were favorable for condensation. The resulting wealth of data will aid in benchmarking numerical models, and in characterizing the response of the exterior walls to heat, air and moisture transfer.
A clear relationship was observed between wind causing pressure effects across the wall and the subsequent wetting and drying of components in the assembly. These findings validated our current understanding of heat air and moisture flow across wall assemblies located in cold climates. For
wintertime interstitial condensation to occur, humid indoor air must necessarily reach locations in the wall assembly that are sufficiently cold to permit the formation of condensation (i.e. below the dew point temperature of indoor air). An opening in the air barrier system, a positive pressure difference acting on this opening, moisture in the indoor air and a sufficient temperature differential are conditions needed to trigger condensation. If one of these factors changes or is eliminated, the entire dynamic changes as was observed when wind pressure overcame indoor chamber pressure. This pressure change in differential across the assembly lead to air infiltration that resulted in drying, rather than the exfiltration of moist air resulting in the wetting of components in the stud cavity.
ACKNOWLEDGEMENTS
Funding from NRC made this project possibly by enabling NRC-IRC to create a state-of-the-art ventilation and wall research house facility.
The authors wish to thank SMT Research Ltd. for their help with instrumentation and monitoring and also wish to acknowledge the precious contribution of colleagues: Mike Swinton, Stacey Nunes, and the following students: Robert Berzins, Édouard Limouse and Madeline Leroux.
REFERENCES
Maref, W.; Ouazia, B.; Reardon, J.; Rousseau, M.Z. 2007. “Ventilation and Wall Research House” Performance of Exterior Envelope of Whole Buildings X Conference, Clearwater Florida December 2007. pp 1-8. (NRCC-49484)
Maref, W. et al. In Press. Commissioning and Benchmarking and Commissioning of the Field Exposure of Wall Facility, Institute for Research in Construction, National Research Council Canada.
Vokey, D.; Nelson, C.; Friesen, C. 2006. “A simple and useful method to detect and pinpoint envelope failures during field testing of a gypsum sheathed wall.” Proceedings of the Third International Building Physics Conference, August 27-31, 2006. Montreal, Canada. pp. 419-424.