by
September 2009 John E. Parsons
Black Gold & Fool’s Gold: Speculation in the Oil Futures Market
Black Gold & Fool’s Gold:
Speculation in the Oil Futures Market
John E. Parsons* March 2009 revised September 2009
Abstract: This paper addresses the question of whether the oil price spike of 2003-2008 was a bubble. We document and discuss what is known about the level of speculation in the paper oil market. We then analyze the dynamics of the term structure of futures prices, both during the earlier period of 1985-2002 and during the spike. The dynamics of the term structure changed in important ways during this latter period, and we explain how this may have contributed to generating a bubble. We also explain how this answers the puzzle of the lack of accumulating above-ground inventories. Finally, we discuss the implications for regulatory reform of the paper oil markets.
INTRODUCTION
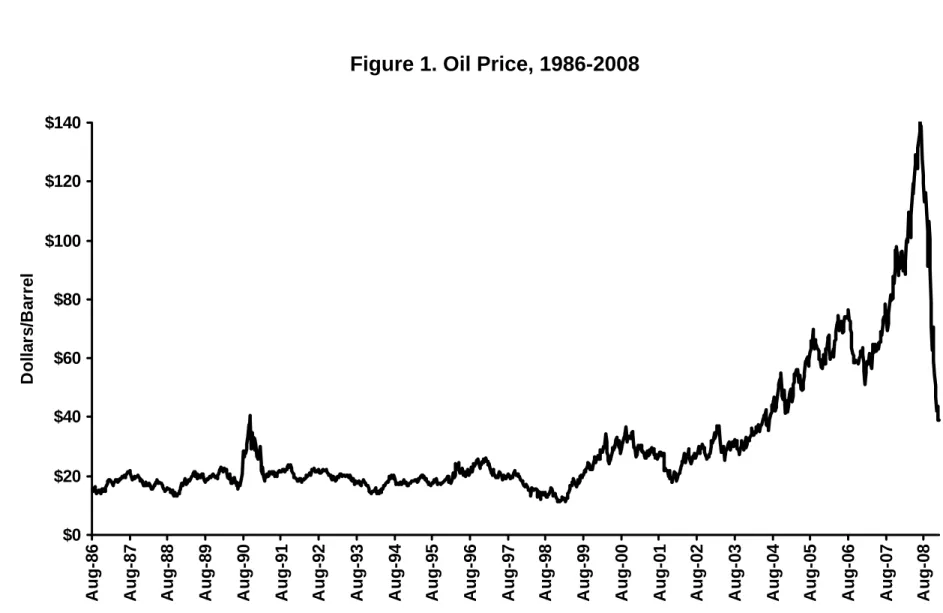
On its face, nothing looks more like a classic bubble than the accelerating inflation of the oil price between 2003 and mid-2008, and its sudden collapse in late 2008. Starting from $30 per barrel, the price climbed erratically but persistently to $100 per barrel at the end of 2007, and then shot up above $140 by July 2008, only to collapse below $40 by the end of 2008—see Figure 1. Clearly the price spiked dramatically, but was it a bubble?
A large number of people have pointed their fingers at the growing flow of money into financial instruments tied to the oil price. These flows, they argue, pushed the oil
* MIT Sloan School of Management, MIT Center for Energy and Environmental Policy Research and MIT
Joint Program on the Science and Policy of Global Change, E19-411, 77 Massachusetts Ave., Cambridge,
MA 02139 USA, E-mail: jparsons@mit.edu
This paper has its origins in a presentation on paper oil markets made to the MIT Central Bank Research
Network Fall Conference in December 2008. A version of this paper was presented at the 19th Economia
panel meeting in Bogota, Colombia in March 2009. Thanks to the Economia discussants for insightful comments and criticisms. Thanks also to colleagues at MIT for their critiques.
price up and away from its fundamental level. The bubble burst after the arrival of the general financial market collapse put an end to this dynamic. Some who make this
argument speak with blanket disapproval of “speculation” and “speculators” because they aren’t a part of the “real” oil business. And some go further still and suspect that
financiers specifically “manipulated” the oil market. But the theory that the oil price spike was a speculative bubble driven by financial flows requires neither disapproval of purely financial investments in oil nor a judgment about motives. The thing about asset bubbles is that they arise naturally, so to speak, in any economy sophisticated enough to develop financial assets.
Among economists there is a prevailing skepticism towards the view that the oil price spike was a bubble.1 They point to the fact that the underlying fundamentals of supply and demand changed significantly during this period of time. Probably most importantly economic growth in several developing countries, like China and India, was unexpectedly rapid and persistant, increasing the demand for oil. Simultaneously, the supply of oil from some key sources fell, despite the rising price, and new sources were slow to appear. The only way to equilibrate this increasing demand and shortfall in supply was with a sharply rising price.
The argument that demand was the fundamental factor driving the price of oil up so sharply is bolstered by the fact that so many other commodity prices were rising dramatically at the very same time. Many of these commodities are not traded on futures exchanges and are not assets that can be the subject of a bubble. These include various
1 Of course, there are several economists who are not skeptical, and who have argued that the oil price
types of iron and steel and fabricated products as well as the price of cement. Indeed, the price of things like engineering services increased dramatically as well.2
Clearly rising global demand was driving many prices sharply upward, and probably this was a major factor for the price of oil. The only question is whether
changes in demand and supply curves for oil account for all of the movement in the price. Of course, there is no widely accepted measure of the global demand and supply curves for oil, and it is difficult for economists to give a clear demonstration that the spike in the oil price is entirely determined by fundamentals.
A related source of skepticism among economists is the question of the missing stockpiles of oil. This is ‘the dog that didn’t bark’ in the mystery of the oil price spike. If the price of oil were to be driven above its fundamental level where supply and demand were matched, then consumers would cut back on use and producers would produce more. Consequently, the quantity supplied would exceed the quantity demanded, and the difference would have to go into a stockpile that someone – the financial speculators – would be holding in hopes of a higher price in the future. Although the actual facts of supply and demand may be difficult to pin down, barrels of oil in storage are easy to count. No such stockpiles arose throughout the 2003-2008 period, ergo financial speculation was not the cause of the oil price spike. It must have been supply and demand.
The economist’s skepticism is a healthy one, I believe. However, in this case I think it is too dismissive. It overlooks how paper oil markets have been transformed. As I
2 Indeed, , I have documented the large inflation in the cost of building nuclear power plants over this
will explain below, successful innovations in the financial industry made it possible for paper oil to be a financial asset in a very complete way. Once that was accomplished, a speculative bubble became possible. Oil is no different from equities or housing in this regard.
Section 2 of this paper documents what is known and what is not known about the growth of financial investments in oil derivatives from the mid-1990s through 2008. Section 3 applies a widely employed model of oil price movements to explain the dynamics of the term structure of oil futures prices. Section 4 extends this model to an analysis of the returns to financial investments in oil derivatives. It then explores the historical relationship between oil price movements and profits from investments oil derivatives. We show how this relationship changed beginning in 2003 and how this may have generated the type of dynamic that is a key feature of speculative bubbles. We also show in this section how the evolution of the term structure since 2003 undermines the argument that a bubble needs to be accompanied by an accumulation of above-ground stockpiles of oil. Section 5 concludes
2. ASSESSING THE SIZE OF FINANCIAL INVESTMENTS IN OIL
How large are the financial investments in oil markets?
Answering this question requires sorting through exactly which type of financial investments are to be covered. By far and away the largest financial investments in oil markets are made through equity and debt ownership of the many, many companies engaged in oil exploration, production, refining and marketing. A good number of these companies are state owned, but many are privately owned and many publicly traded. State claims on oil revenue in the form of royalty rights and tax claims are another major
form of financial investment. But none of these vast forms of investment in oil are what is really meant by the question. Instead, most questioners really want to know the scale of the pure financial bets on the price which are made through the futures market or related channels.
In the sections below, we document the growth in exchange traded futures and options. We explain the off-exchange trading and why we know little about its size. We document the shifting share of trading by hedgers and by speculators, and the size of a particular type of speculative activity, index trades. Finally, we benchmark the scale of this growing financial activity against the size of investments in the physical market for oil.
Open Interest in Exchange Traded Futures
The NYMEX is the major exchange on which oil futures are traded. One metric to consider is the value of the total open interest in its oil futures contracts. The open
interest is the total number of bets in play at a given point of time, with someone being on the long side of the bet and someone else being on the short side of the bet. Since mid-1995, the total open interest has risen from over 350,000 contracts to more than
1,280,000 in mid-2008, i.e. growing at more than 10% per year. A contract is for 1,000 barrels of oil, so this is a rise from 350 million barrels to more than 1.28 billion barrels. Multiplying the open interest measured in barrels by the price of oil per barrel shows that the value of the total open interest rose from $6.2 billion in mid-1995 to $180 billion in mid-2008. The other major futures contracts for crude oil are offered by the
Intercontinental Exchange (ICE). It runs a copycat contract that is pegged off the NYMEX’s own contract on West Texas Intermediate (WTI) crude oil. The ICE also
offers its own futures contract on Brent crude, a type of oil from the North Sea and the main competitor to WTI as a benchmark for oil.3 Combined these contracts have in the neighborhood of 15% of the NYMEX open interest, so that the total open interest in mid-2008 was 1.441 billion barrels or $202 billion. Table 1 and Figure 2 show the combined total of open interest in futures, summed across the three contracts, from 1995 through 2008. The size is shown measured both in terms of barrels and in terms of dollar value. There are a few other oil futures contracts traded on other types of crudes and in other exchanges on the globe, but they would not add any consequential amount to these figures.
In addition to simple futures positions, the exchanges offer options on the oil price. Where a futures contract is a pure linear bet on the price of oil, an option position is a non-linear bet. An options position can be managed to yield a similar exposure to changes in the oil price as a futures position, and for any given open interest in option contracts we can calculate the open interest in futures required to maintain an equivalent exposure. Recognizing the exposure created in the option markets would have added another 40% of open interest to the figure in 2000, another 52% in 2004, and would have
3 The ICE parent corporation is based in Atlanta, and a large portion of its energy trading operations are run
out of Atlanta. Technically, the crude oil futures contracts are a product of the ICE’s nominally London-based ICE Futures Europe subsidiary. Therefore, both of its contracts are subject to regulation by the UK’s Financial Services Authority (FSA) and not to oversight and regulation by the CFTC despite the location of its operations and the US delivery point for the oil on which the WTI contract is traded. The ICE’s copycat WTI futures contract has not been subject to the same speculative position limits that the NYMEX imposes and the FSA did not collect and disseminate the same information about the proportion of commercial and non-commercial traders. Also for a long while the two regulatory authorities did not actively share information about trading and positions, giving traders opportunities to circumvent the tighter US controls. The spike in oil prices and public debate about the role of financial speculation and lax regulation has forced both regulators and both exchanges to revisit the groundrules and practices, although a formal revision to the system has not yet been settled on.
more than doubled total exposure in 2008. We show this combined position in the table and figure for select years. 4
Off-Exchange Derivatives
Many of the financial trades on the oil price never come to the futures markets. Swap dealers can privately enter into positions with customers that look in most regards just like futures or option contracts – or bundles of futures and/or option contracts. The most important difference has to do with counterparty credit risk. The other important difference is that dealers can trade tailored swaps that amount to a bundle of futures and options. It is more convenient to the customer to buy the bundle as a single package, rather than trying to trade the components itself. Although swaps are financial
instruments that create oil price exposure, this trading is not generally subject to reporting to the CFTC, nor is data on the volume and terms of the transactions publicly released.
Therefore, the numbers shown in Table 1 and Figure 2 are an underestimate of the true size of the open interest in crude oil, since it excludes the positions that are
negotiated off the exchange. How much of an underestimate these figures are depends upon the character of the swap dealer’s portfolio. A swap dealer is an intermediary. It profits by enabling the trading of others. The dealer does not seek to take a position in oil on its own account. It tries to match buyers and sellers, or, through the proper
management of its overall book, match the aggregate positions of many buyers and many sellers. A swap dealer will have customers who wish to sell a futures position in oil and other customers who wish to buy a futures position in oil. Insofar as these match, that open interest is never seen by the futures exchange and so is not recorded in the numbers
shown in Table 1 or Figure 2. Only insofar as the dealer has more customers on one side or the other, will the dealer be compelled to bring the net position to the futures exchange in order to keep its book hedged. Therefore, the swap dealer positions that enter into the numbers shown in Table 1 and Figure 2 are only this residual fraction of the dealer’s total book that it has brought to the exchange. Unfortunately, there is no publicly available information on the size of the dealer’s book that is not brought to the exchange, and consequently we don’t have a good estimate of the degree to which Table 1 and Figure 2 underestimate the true open interest including off-exchange positions.
The Bank for International Settlements (BIS) publishes a pair of data series on the notional amounts outstanding and the gross market values of commodity derivative contracts traded over-the-counter, oil among them—see BIS (2009).5 In mid-2008 the notional amounts outstanding stood at over $13 trillion and the market value of the positions stood at $2.2 trillion. Unfortunately, how these figures have been aggregated is undefined and what exactly they mean is obscure. It is clear that these figures cannot be sensibly compared to the open interest figure shown in Table 1.
The recent public concern about speculation driving commodity prices forced the CFTC to produce its special Staff Report on Commodity Swap Dealers and their
positions–see CFTC (2008). The CFTC used its authority to issue a special call to all reporting dealers seeking information about their aggregate positions. Therefore, one would have hoped to have learned something more about dealers’ off-exchange positions
5 The old terminology ‘over-the-counter’ or OTC is sometimes still used as a label for this activity, but its
usage is troublesome. Any number of different ways of executing trades – such as the ICE copycat WTI contract – have been developed to work around the old regulatory structure using different legal strategems, including exempt commercial markets and other excuses. Where in the past one used to think in terms of a dichotomy – exchange or OTC – and this dichotomy corresponded to regulatory treatment as well as public reporting of data and degree of public price discoverr, there is no longer a neat correspondence so that it is unclear what is encompassed by OTC and what the term signifies.
and a better estimate of the total size of the market. Unfortunately, the CFTC chose to delimit the report specifically to a subset of the dealers’ activities—index trading—and did not clarify how that category was defined. In doing so, it dashed hopes of having a complete picture. While the CFTC has the data, the public does not.
Hedgers and Speculators
Open interest reflects the positions of both non-financial and financial traders in oil. Many bets reflect a non-financial on one side of the contract, with a financial on the other side: i.e. the hedger and the speculator. But this is not the only possibility. There may be pure financials on both sides of the bets, or both non-financials. And there is no simple way to decode from the aggregate open interest figure exactly who is doing how much of what.
The CFTC maintains a database called the Large Trader Reporting System
(LTRS) which has a breakdown of the positions held by participants according to various classifications. For example, it includes Manufacturers, companies involved in
Agriculture/Natural Resources, and Producer, all of which are categories that would be thought of as natural hedgers. It also includes Floor Broker/Trader, Futures Commission Merchant, Introducing Broker and Commodities Swaps/ Derivatives Dealer, Commodity Pool Operators, Commodity Trading Advisors, Insurance Company, Pension Fund and so on. A few of these categories clearly describe financial investors or speculators. Others are financial intermediaries that may serve both financial and non-financial clients, and some may clearly be agents of purely financial investors.
The CFTC does not publicly report information at this level of detail however. Instead, it publishes a regular Commitment of Traders (COT) report which aggregates
these various categories into two classes: commercial and non-commercial. Originally, this classification had roughly corresponded to the natural distinction between financial and non-financial participants or speculators and hedgers. However, over time the CFTC, under political pressures asserted through various channels, has allowed the meaning of the two categories to break down so that the report was markedly less informative. The major fault arises because Swap Dealers, who often stand merely as an intermediary to a speculator, became exempted from position limits imposed on speculators and
re-classified for reporting purposes as hedgers or “commercials”.6
Seen from the narrow perspective of the swap dealer’s own book of orders, the dealer is hedging: on the one side they have the position of their ultimate customer, and so they come to the futures market to hedge it by purchasing an offsetting position. But seen from the perspective of their role in the marketplace, the position they are bringing to the exchange is a speculation. This blurring of categories has made the regular COT report relatively uninformative precisely in the time period when financial investment in oil has been exploding.
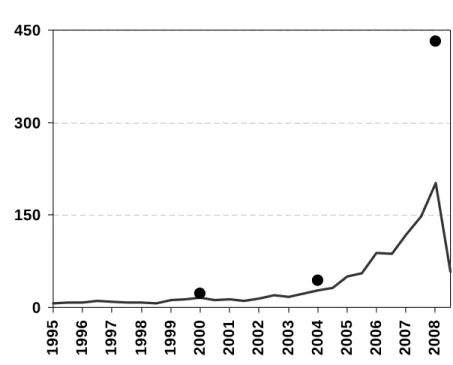
The CFTC sanctioned a small number of academic studies that report some salient statistics from the disaggregated categories of the LTRS and these studies provide some insight into the share of the open interest represented by the different financial players. Figure 3, taken from data provided in Büyükşahin et al. (2008), shows the share of the total open interest accounted for by four categories of traders. This is done for three
6 A brief detail of the “legislative” history behind this appears in CFTC (2008). The issue has effectively
been re-opened, and, indeed, the CFTC has just announced a “Concept Release on Whether To Eliminate the Bona Fide Hedge Exemption for Certain Swap Dealers and Create a New Limited Risk Management Exemption From Speculative Position Limits” March 24, 2009.
snapshots in time: 2000, 2004 and 2008. I have aggregated the various commercials into a single category. I show three categories that may be thought of as non-commercials: Swap Dealer, Hedge Funds and other Non-commercials.7 For commercials, the average open interest (futures + futures-equivalent options) increased 63% over the eight years, while for commercials it increased by nearly 600%. This meant that the
non-commercial category grew from just over 50% of the total open interest to 85% in 2008.8 In 2008, swap dealers represented 35% of the total open interest, while hedge funds represented 23%. Non-registered participants grew from only 6% of open interest to 16%.
Later we will be focusing on the long maturity contracts, so it is interesting to look at the participation shares out at the long end of the curve. For this calculation, the long end is defined as contracts maturing in three or more years. For commercials, the average open interest in these long maturities increased 72% over the eight years, while for non-commercials it increased by more than 1200%, double the rate of growth in all maturities taken together. The non-commercial category grew from just over 50% of the total open interest to more than 90% in 2008. In 2008, swap dealers represented 59% of the total open interest, while hedge funds represented 24%. While the size of the market at these long maturities is small – approximately 6% of total open interest – the growth in the market over these years has meant that the total open interest in these contracts in
7 Following the original source, I have used the category label “Hedge Funds”, which is an aggregation of
several categories that are known by the CFTC to be representing trades of well known hedge funds.
8 I have aggregated the 3 categories of Swap Dealer, Hedge Fund and Other Non-commercial into a
sub-total for Non-commercial. Figure 3 shows the breakdown into the three elements. Some of the Swap Dealer’s business may also represent trades by commercials, so this may overestimate the share of non-commercial trades.
2008 is approximately equal to the total open interest in the shortest month contracts (0-3 months) in 2000.
Index Funds
A major class of financial investment in commodities is index funds or index trading. Index trading is an extension of traditional portfolio management. A major concept in portfolio management is wide diversification of investments across a broad spectrum of assets, maximizing the combined return while minimizing the risk through diversification. An investment in commodity futures is just one more so-called asset class, like government bonds, corporate bonds, large stocks, small stocks, and so on.
The concept of adding commodity futures contracts to a well-diversified portfolio has been around a long time.9 However, a variety of evolutionary changes in various institutions created greater opportunity for this to become a realistic option for a large number of investors holding a large pot of investment dollars. A major turning point came with the creation of the Goldman Sachs Commodity Index (GSCI) in 1991. The GSCI has since been sold to Standard & Poors. The GSCI invests in an array of different commodity futures spanning energy, industrial and precious metals and agricultural and livestock. However, since the energy futures markets are among the deepest and most liquid financial commodity markets in the world, the index has always been heavily weighted towards energy (now more than 67%) and specifically to crude oil (now 48%). Customers can buy into the index much as they would buy into a mutual fund. Several other similar indices were created, although the major alternative in recent years has been the Dow Jones-AIG Commodity Index (DJ-AIGCI).
Index trading may be a form of passive investing: i.e. the investor takes no view of whether the commodity price is too high or too low, but merely seeks to hold exposure bought at the market rate. But as with all vehicles for passive investing, many investors bend the concept by changing the chosen weights on different commodities according to where they think greater or less return is likely to be coming over the near term. And other investors may utilize the channel created by the index to take an active bet on various commodities. Each dealer offers a variety of incarnations of their commodity index, just as mutual fund companies offer a range of different fund types, and dealers compete by structuring their indexes with different weights and along other dimension. The dealers market their particular strategies.
When the popular press reports the volume of money currently invested in commodities, they are usually reporting on index money. Indeed, the reports often specifically conjecture on the amount of money in the GSCI, in the DJ-AIGCI and in funds that attempt to mimic these two funds. These reports are conjecture benchmarked against disparate tidbits of public data. There is no authoritative source where the aggregate of funds invested in index trades have been tallied. The most recently popular benchmark derives from the decision of the CFTC in 2006, to start producing a
supplement to its COT report which purports to specifically identify index trades by swap dealers in a select set of agricultural commodities. With this data in hand, and using the known index weighting used in the standard GSCI and DJ-AIGCI, it is possible to back-out an estimate of the index dollars invested in all of the other commodities. The
methodology is described in Masters and White (2008) where they report that it suggests a January 2006 position for the GSCI of more than $47 billion and for the DJ-AIGCI of
more than $27 billion. Of this, the method suggests that the GSCI held more than $21 billion in crude oil with the DJ-AIGCI at more than $3 billion. Combined, this would have been 43% of the open interest on the combined crude contracts trading on the NYMEX and ICE at the time. Press estimates for mid-2008 put the total index
commodities investment at $400 billion.10 Assuming the same fraction of index money invested in crude oil, this would imply approximately $130 billion or 64% of the combined crude open interest on the NYMEX and ICE. Masters and White (2008) estimate over 880 million barrels of crude in indexes, or more than $120 billion.
In its Staff Report on Commodity Swap Dealers and their positions–see CFTC (2008)—the CFTC purports to have calculated the total index trades held by swap dealers at 3 dates: December 31, 2007, March 31, 2008 and June 30, 2008. Its estimates are markedly lower than those circulating in widely cited press reports. For example, it estimates the total commodity index exposure at $200 billion and the exposure to
NYMEX crude oil at $51 billion. The methodology behind the CFTC’s determination of what to include as an index trade is not explained. The CFTC’s number purports to encompass both on- and off-exchange exposures, so one might have expected the figure to be larger than other calculations based exclusively on exchange positions. Instead, the CFTC number is markedly smaller. The CFTC’s report does not benchmark its result to any of these widely circulated numbers and well documented methodologies based on public data, and so the reason for the discrepancy is left as a puzzle.
Indexes are only one type of product that dealers offer. And other financial investors—such as hedge funds—can create their own customized version of an index.
So without any authoritative public data source, we are left with a very poor description of this element of the oil market. We have some minimal sense of how large it is, and a clear sense that it has grown significantly through time. We also know from index funds own reports of their methodology as well as from the earlier data reported that index trading has moved its exposure out to the longer end of the forward curve through time.
In Comparison to the Physical Oil Market
In 2007 the global production of crude oil was approximately 30.8 billion
barrels.11 The total open interest on the NYMEX and ICE was approximately 1.5 billion barrels, or 5% of total annual production. These figures are shown in Table 1 for
comparison purposes. This is a comparison of the total flow of oil during the calendar year with the total stock of bets on oil in place at the end of the year. This is an increase from the figure of 2% around which this ratio bounced for a number of years until it began to climb in 2002.
Some who have argued that financial investments drove the oil price spike tend to make the argument as if the flow of money into futures were somehow actually in
competition against other, physical demand for the flow of production. The Masters and White (2008) report reads this way, for example, since they compare the flow of money into oil to the increased consumption of oil in China. However, financial investors do not consume the oil and they do not in any direct way divert production away from delivery to satisfy demand. This obvious error has annoyed the inner-pedant in many economists, and taken the focus away from other channels by which this flow of funds might be
impacting price. Some of these other channels are also mentioned in Masters and White (2008), among other popular sources.
While the flow of funds into oil futures and related financial investments is not in competition with demand for the actual consumption of oil, it is a form of ownership of oil. It is analogous to a flow of passive equity capital into other assets: equity in the sense of taking on the exposure to price movements, passive in the sense that the exposure assumed is exogenous and there is no direct management of the underlying asset
required. It would be analogous to a flow of funds buying up rental housing or sharing an equity stake in owner-occupied housing. The financial owner isn’t seeking to evict anyone and hold the house empty and unused. The price of housing won’t be driven up because of competition with renters for scarce homes. Can the price of housing,
however, be driven up by this new flow of equity capital into the market? Can the price of oil and oil-linked assets be driven up, in part, by this new flow of equity capital into oil?
Restating the question this way suggests that we shouldn’t be comparing the flow of financial investments in oil to the annual production of oil, but to the asset base of oil. This is hard to do for a number of reasons. So I will make an oversimplified calculation here, but one that is at least a start towards what is needed. In 2007 the global proved reserves of crude oil totaled approximately 1.2 trillion barrels.12 The total open ended interest on the NYMEX and ICE was approximately 1.5 billion barrels, or slightly more than 1/10th of 1% of total proved reserves. Including options probably doubles this
12 US Energy Information Administration: www.eia.doe.gov/emeu/international/oilreserves.html, citing the
fraction. Of course, the vast majority of these reserves are controlled by nation states or their national oil companies, and the assets are not available for trade. Total US reserves were just over 30 billion barrels, so the total open interest equals just over 5% of the reserves—just over 10% if options are included. These figures have also been placed in Table 1 for convenience of comparison. The 10% ratio represents the total accumulation as of year-end 2007, but half of this was accumulated over the period 2004-2007.
Something like the right thought experiment might be “what would happen if suddenly a new flow of capital came in to purchase an equity stake in 5% of the oil assets?” Would that asset demand (as opposed to consumption demand) in that window of time, move the asset price?13
Masters and White (2008) do argue that order flow in an asset market drives price. That is one possible channel through which this could happen. But they rhetorically exaggerate the size and duration that order flow has in asset markets, and they never attempt to take the theory to the data relevant for the oil market. They quickly revert to comparing financial flows to consumption, which is the wrong thing. On its own, I would doubt that a flow of that size in comparison an asset base of that size could have much of an impact.14
13 Proved reserves are a widely misunderstood concept, among economists as well as the broader populace.
Proved reserves are not comparable to the well defined stock of a non-renewable resources at the heart of Hotelling’s famous rule—Hotelling (1931). Per Adelman, (1993), they are more analogous to an inventory of manufactured goods. The production process involves investment in exploration and other drilling, and the returns to the investment arrive stochastically, as with a Poisson process. Also, the practice of
determining and declaring proved reserves varies widely across countries, so that the data from many countries is a managed figure less tied to underlying facts of geology and economics than to politics.
14 The CFTC, together with other agencies, did make some effort to address the order flow question: see the
Interagency Task Force on Commodity Markets (2008) which, on this topic, summarizes results documented in Büyükşahin et al. (2008). They are skeptical that order flow played a significant role.
Something more would have to occur for this financial flow to matter very significantly. We’ll return to this later.
3. OIL PRICE DYNAMICS
A sound discussion of the returns to an investment in oil futures requires a
digression into the stochastic dynamics of oil prices and some detail on the term structure of futures prices. As we shall see, an important new dynamic that arose during the oil price spike of 2003-2008 is reflected only in an analysis of the full term structure. Discussions that concentrate exclusively on movements in the spot price, miss this key historical fact. I believe this new dynamic is important to how investor beliefs evolved during this time, and relevant to how a bubble might have grown.
Modeling Oil Price Dynamics
The evolution of the oil price is determined by a host of factors. On the supply side there are developments in technology that open up the possibility of drilling in previously inaccessible locations, movements in various factor prices, and the stochastic realization of new resource discoveries. On the demand side there is the growth of global population and general economic level of development, the changing suite of
technologies for fueling transportation, and so on. There are many political factors at work on both the supply and the demand side. For the purpose of this paper, it will be convenient to collapse all these many factors and complicated dynamics into an
oversimplified taxonomy that distinguishes just two sets of factors. The first set of factors are those that are short-term, transitory shocks to either supply or demand. The second set of factors are those that permanently shift our expectation of the long-term equilibrium price. I will speak in reduced form as if the price is directly moved either by a short-term,
transitory factor or by a long-term, permanent factor, without expounding at all on the process of equilibration between the supply curve and the demand curve.
Just such a two-factor model was originally developed by Gibson and Schwartz (1990) and Schwartz (1997), and then reinterpreted by Baker, Mayfield and Parsons (1998) and Schwartz and Smith (2000) with the two-factors represented as a short-term, transient factor and a long-term, lasting factor. Each factor is subject to random shocks. Shocks to the short-term factor do not have a lasting effect on the price of oil at long horizons. The effects dissipate gradually. In contrast, shocks to the long-term factor are lasting and so cumulate.
Despite the oversimplification involved, this two-factor model of the oil price is a convenient tool for narrating at least some of the dynamics observed in the actual history of the spot price of oil. Looking at the graph of the oil price shown in Figure 1, and focusing on the period before 2003, we can readily see occasional swings up or down which are then followed by reversals back towards some central tendency. These swings are a reflection of short-term, transitory disturbances to either supply or demand, or both. Before the recent run-up in the oil price, the most dramatic example of such a swing was the sharp price spike occasioned by the first Gulf War in late 1990. Starting from a level below $18 per barrel in mid-July, the price peaked above $40 per barrel in October, then falling back below $18 per barrel by late-February 1991. A less dramatic example is the drop in prices that occurred in 1993 when conflicts within OPEC resulted in a temporary glut of supplies and prices went from over $18 per barrel in August to below $14 per barrel in December, recovering back to over $18 per barrel again in June 1994. It was this
temporary drop in the spot price that occasioned the brush with bankruptcy by the German company Metallgesellschaft due to its speculation in oil futures.
From December 1998 to November 2000 the price nearly tripled from $11 to $35 per barrel. But this dramatic increase was marked by several reversals down by $10 per barrel before the upward trend recovered. Then within the space of slightly more than a year, the price fell again down to $18 per barrel and recovered as quickly back above $30, continuing its rise marked by swings of as much as $10 per barrel. For each of the swings just mentioned the recovery occurs within less than a year, sometimes within a couple of months. Even the price run-up of 2003 through mid-2008 exhibits some striking swings around the realized trend, such as the drop in price during the latter part of 2006.
Obviously, the largest apparent “swing” in the price is the spike in mid-2008. In this case, reading the data in terms of the two factor model is more difficult, albeit not impossible. The swing is too large to be attributed completely to short-run, transitory shocks whose dissipation should have been anticipated. Instead, believers that the spike was caused by fundamental movements in supply and demand are forced to explain this as one of those peculiar sample paths that arise in any random walk: at least a good portion of the price run-up was expected to have persisted and might have persisted had there not been a global financial collapse and resulting economic recession. The drop, or at least a major portion of it, was unanticipated and reflects an unusually large shock to the long-term factor.
In this two factor model, the observed volatility of the spot price is a function of the volatilities of both factors. Typical estimates put the total raw annualized weekly
volatility of returns on the spot oil price in the neighborhood of 30-35%, with 50-60% of that volatility coming from short-term, transitory shocks that dissipate, leaving the long-term factor with a volatility of close to 14-16%: see Schwartz and Smith (2000) and Herce, Parsons and Ready (2006), among others.
The Term Structure of Futures Prices
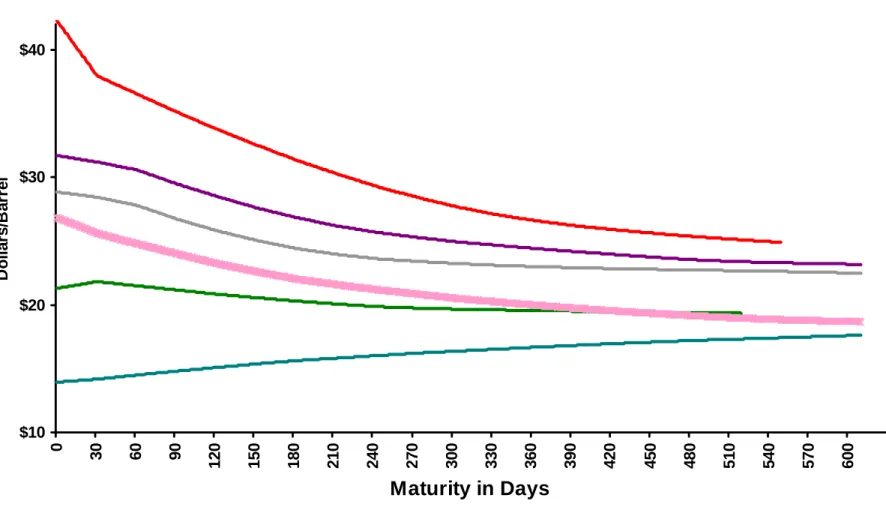
Figure 4 displays the graphs of the term structure of futures prices prevailing at several different dates. The horizontal axis shows the time to maturity for the futures contracts whose prices are graphed. Each solid line reflects the full term structure prevailing on a single date. The points on one line correspond to the prices of contracts maturing at different horizons in the future. Moving from line to line shows how the term structure has moved between dates.
Note that the range of prices at short maturities is much larger than the range of prices at long maturities. If spot prices evolve according to the two-factor model
described above, the volatility of short maturity contracts will be higher than the volatility of long maturity contracts. Volatility in short-term elements of supply and demand will have a large impact on short maturity contracts, but only a small impact on long maturity contracts. This is because the short-term factors are transitory. There is time for the system to adjust back to the equilibrium level governed by the long-term factor. The impact of a shock to the short-term factor on a long-term futures price should asymptote to zero as the maturity of the contract goes to infinity. Of course, if we allow the long-term factor to evolve, there will be volatility in long-long-term futures contracts, too. But volatility in the long-term factor affects both short maturity contracts and long maturity contracts equally. Hence, volatility in short maturity contracts is the product of volatility
in both the short-term and the long-term factors, while volatility in the long maturity contracts is the product solely of volatility in the long-term factor. Short maturity contracts are more volatile.
Figure 4 can also help clarify some classic terminology employed in the futures market. The top curve in the figure displays the shape known as ‘backwardation’. The price is declining with maturity. The bottom curve displays the shape known as ‘contango’. The price is rising with maturity. The oil price curve is sometimes in backwardation and sometimes in contango. One factor determining whether it is in backwardation or contango is the current realization of shocks to the short-term factor. When supplies have been temporarily disrupted and the spot price has risen, the expectation is that the spot price will decline again, reverting to the long-term level. If there is a temporary glut of supply on the market, then the spot price will clear at a temporarily low level, and expectations will be that it will rise again to the long-term level. These expectations about the future spot price at date t+τ are translated as well to the current, date t , futures price for a contract maturing τ periods forward.
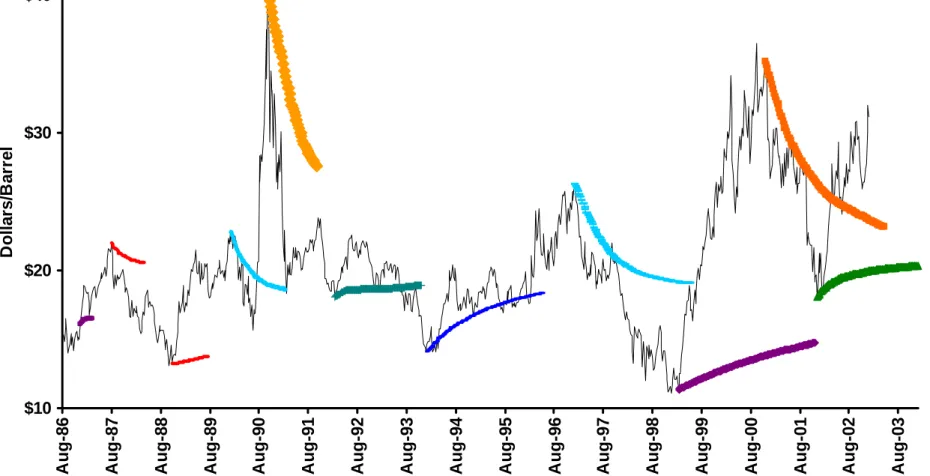
Figure 5 clearly shows this expectation component of the term structure of futures prices. In the background, the figure shows the time series of the spot price during just the early part of our analysis, 1986-2002. Overlayed on top of this background are the futures price term structures at eleven selected dates. Each term structure is placed so that the price of a futures contract of a given maturity is aligned with actual date of maturity. Looking at the time period of the first Gulf War, we see that on October 9, 1990 the spot price was near its peak at just over $40/barrel. On the same day, the price for a futures contract for delivery three months later was $35.80, and the price for a futures contract
maturing 15 months later was $26.03. The declining term structure clearly reflected market expectations that the Gulf War would not disrupt supply for too long and that spot prices would come back down again. In December 1993, when spot prices had fallen to $14.67, the price for a three month futures contract was $15.51 and the price for a 15 month contract was $17.49. This likely reflects market expectations that the glut of supply in December would not last and the spot price would climb back up. Take a look at the period 1993-2002, on which we have marked 5 futures term structures. During this period, the price rose and fell sharply below and sharply above $20/barrel. The five term structures we have charted at the various peaks and troughs of this movement show that the market was forecasting that the price would return back to some more central number, perhaps somewhere in the neighborhood of $20/bbl.
Although oil futures fluctuate between backwardation and contango, on average they have been backwardated: more often than not, the front end contract has been the most expensive contract, and the term structure of futures prices at a given point in time has declined with maturity, at least near the front end of the curve. There is nothing surprising about that. It is consistent with the 2-factor theoretical model described above. That model can be consistent with a curve that is either more often in backwardation or more often in contango. This just depends upon whether the equilibrium risk premium associated with the short-term factor is positive or negative.15 This equilibrium risk-premium reflects equilibrium in the underlying operation of storage for the commodity as well as how capital markets price this risk together with the other portfolio risks. As it
15 The risk premium on the long-term factor, together with the expected drift of the commodity price,
determines whether out at the long end of the term structure the curve is rising or falling. So even if the term structure is falling at the front end, it can turn up again and be rising at the long end. Historically, the slope at the long end has fluctuated tremendously.
happens, the cost of storing oil above ground is very high, and, at least historically, the short-term factor has paid a positive risk premium: i.e. the term structure of oil prices is usually backwardated. For many other commodities, the term structure is more often in contango. Oil is unusual in this regard.
4. THE STRATEGY AND RETURNS TO INVESTMENTS IN OIL FUTURES
How does ownership of oil futures contribute to an investment portfolio? There are two distinct answers to that question. One, is the answer in theory: ‘What should an investor expect to receive from adding oil futures to his or her portfolio?’ Second, is the answer in the practice of the last three plus decades since oil futures contracts have been traded: ‘How did investors fare, and what was the source of the returns?’ The answers to the two questions need not be the same. Indeed the answer to the second question has varied over time: the source of return in recent years has been very different from the source of the return in earlier years. As we know from experience in other asset markets, investors often draw strong, unfounded conclusions from a short history of returns, and the dynamics of these beliefs can be a contributing factor to an asset bubble.
The Returns to an Investment in Oil Futures
We have assumed that the dynamics of the oil price is governed by two factors. Therefore, an investment in oil futures will capture two distinct sources of return: it will capture the short-term risk premium according to how much of the short-term risk is captured by the portfolio of futures in which it is invested, and it will capture the long-term risk premium according to how much of the long-long-term risk is captured by the portfolio. Different portfolios of futures will contain different amounts of the two risks,
and therefore different mixtures of the two returns. Financial engineering or risk management is all about being able to craft any combination of returns that you like.
For example, a simple long position in the one month futures contract will contain both the short-term and the long-term risk in approximately equal measure (based on estimates previously cited). A long position in the two month futures contract will have the same amount of the long-term risk, but a smaller amount of the short-term risk. Constructing a short position in one contract and a long position in another contract produces a linear combination of the two risk factors, and since different maturity contracts contain different amounts of the two risk factors, it is possible to structure this short-long portfolio so as to own exclusively one factor or the other.16
Whatever portfolio of the two factors of risk is chosen, this will then be blended into a larger investment portfolio where risks and returns will be combined according to the Markowitz portfolio theory.
Marketed index funds are long investments in futures, and all of the original articles that advocated adding commodities to an investment portfolio were written at a time when only very short maturity contracts were available. Hence, we are usually talking about a portfolio of long positions in short maturities, and therefore a portfolio that includes returns associated with both the short- and the long-term factor. To see why
16 The German industrial company Metallgesellschaft nearly went bankrupt when a subsidiary got it wrong.
It was short a set of long-maturity physical supply contracts, and therefore had a negative exposure primarily to the long-term factor. It tried to hedge this by buying short-maturity futures contracts. This successfully hedged its exposure to the long-term factor, but added a new exposure to the short-term factor. When the short-term factor moved, this exposure was its undoing—see Mello and Parsons (1995).
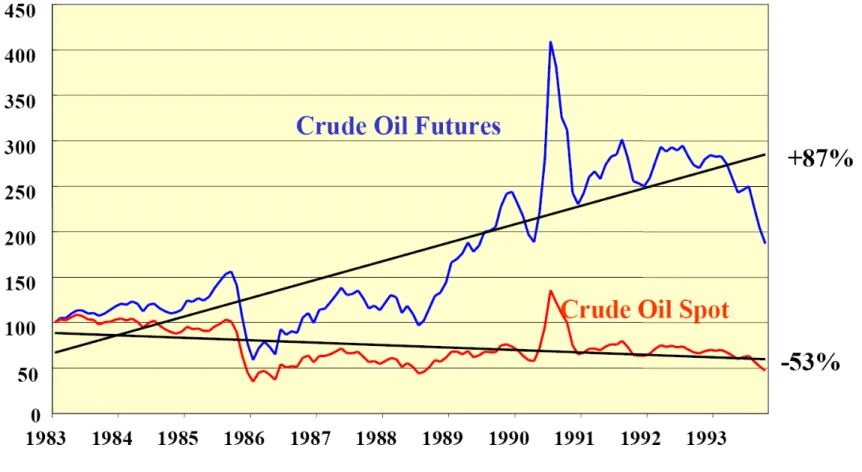
this is important, take a look at Figure 6.17 The figure shows the spot crude oil price from 1983-1993 which, had ups and downs, but overall declined by 53%. The figure also shows the returns earned on a long portfolio of crude oil futures during the same time period. Although the spot price fell, a long portfolio of futures earned a positive return. This demonstrates that an investment in futures is not necessarily the same thing as a bet that spot prices will climb. What’s going on here? The 10-year change in the spot price reflects the realization of the long-term factor, which over this window of time happened to fall. But a long position in short maturity oil futures captures two returns in roughly equal measure: the return on the long-term factor, but also the return on the short-term factor. Over this historical window of time, although the long-term factor earned a negative return, the realized returns on the short-term factor more than compensated for that. As noted earlier, the risk premium on the short-term factor has generally been positive, and a portfolio that was long the short-term factor has generally, but not always, earned a positive return.
The fact that either factor may earn a positive or negative return is not dispositive of whether or not it should be added to an investment portfolio. The key to that decision is its contribution to diversification together with its own return. This, in turn, depends upon the correlation with other securities in the portfolio. The full marketing message for adding commodities to a portfolio clearly recognizes this since many commodities have a modestly negative expected return on the short-term factor—due to the contango—and are nevertheless included in the portfolio in small amounts because the diversification
17 The figure is based on a classic paper advertising the benefits of investing in commodity futures authored
by Wharton and Yale professors Gary Gorton and Geert Rouwenhorst who teamed with AIG on its development of a commodity investment vehicle—Gorton and Rouwenhorst (2006). The figure doesn’t appear in the paper but is taken from a presentation by Rouwenhorst.
benefits are thought to be so high. However, many investors do not carefully consider the full portfolio optimization model and simply chase high realized returns. And many portfolio managers and financial institutions know how to market to that instinct.
In this connection, there are two things to note about the period prior to 2003, when the new investment vehicles for commodity futures were first being successfully developed and an initial population of investors was learning how to participate in this market. First, most commodities were limited to futures contracts with very short maturities. And even those, like oil, that offered contracts out many months, had very little liquidity in those longer maturity contracts.18 The original indexes were marketed using relatively rigid formulas for their investment strategy, and so limited themselves to the most liquid and therefore shortest maturity contracts. Moreover, because of the historic backwardation in the oil futures curve, the shortest maturity contracts had always exhibited the greatest return. This was a critical fact for the marketing. Second, from 1986 onward, the level of the spot oil price did not trend markedly one way or the other. Therefore, during this long window of time, virtually none of the realized return on a long position in oil futures came because the spot price had risen—none was due to the long-term factor. Instead, virtually all of the realized return was due to the short-term factor.
The Changing Expectations Dynamic
Everything flipped around as the price of oil began to rise in 2003. First, the continually rising spot price became a very important and consistent contributor to the
18 Prior to 1989, oil futures contracts did not extend out beyond one year, and liquidity in even these longer
maturities was virtually non-existent. The NYMEX gradually extended the horizon of available maturities, offering contracts out to three years by 1994 and then up to seven years by 1999.
return on a portfolio of oil futures. Second, late in 2004 the term structure for oil switched into a long lasting and deep contango, causing the portfolio to lose money on the short-term factor. These two conditions created a strikingly different dynamic within the financial industry that was selling commodity investments. Whereas in the earlier window of time, being long the short-term factor was the key to turning a large profit, in this window of time, being long the long-term factor became the key. In the earlier window of time, being long a short maturity contract and short a long maturity contract (!) was the way to maximize return. In this window of time, the trick was to avoid the short maturity contracts and be long the long maturity contracts. As documented above, liquidity moved out into the longer maturity contracts, driven primarily by activity from financial investors.
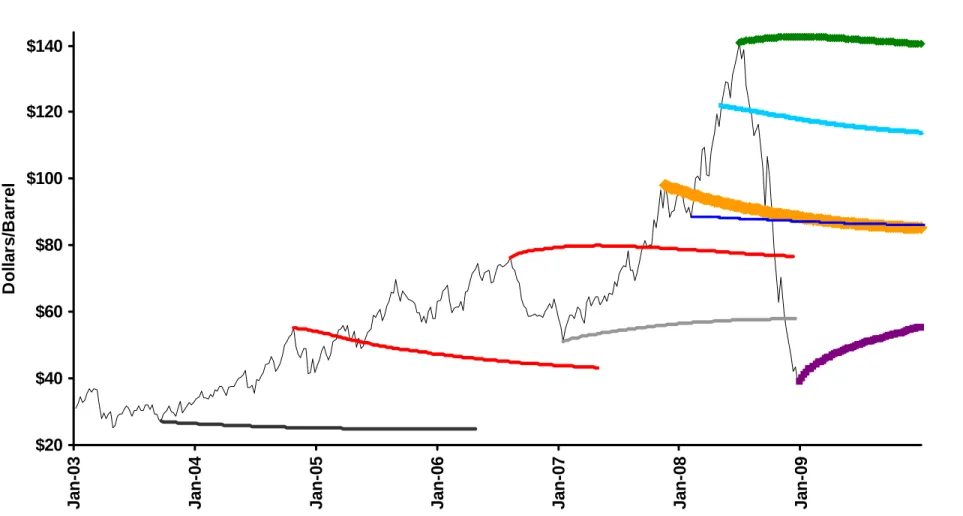
One other thing was markedly different about the period when the price was rising. Figure 7 is a companion to Figure 5. The background of Figure 7 shows the time series of the spot price from 2003-2008. Overlayed on this background are the futures terms structures at nine selected dates. Whereas in Figure 5, the futures prices regularly point down or up according to whether the spot price is in a temporary peak or trough, in Figure 7 as the spot price moves up even long dated futures prices move with it. The same thing generally happens on the way down.19 Throughout this time period,
innovations in the oil price are innovations at the long end of the curve, innovations in the long-term factor. The futures curve is moving up and down in a more or less parallel fashion. It is being driven by changes in the long end of the curve. Volatility at the long
19 Although we note that the December 2008 bottom does show a rising futures curve, suggesting that it
may have been understood that the very low spot price was potentially a temporary phenomenon—at least in part—reflecting the financial crisis and global recession.
end rises dramatically, whereas volatility at the short end stays relatively constant. The volatility on the front month futures contract is 39% from 1995-2002 and 40% from 2003-2008. On the other hand, the volatility on a 2-year futures contract rises from
approximately 15% from 1995-2002 to more than 25% from 2003-2008. The contribution of the short-term factor and the long-term factor in total spot price volatility reverse places: where the short-term factor used to be responsible for 64% of the total volatility and the long-term factor used to be responsible for 36% of the total volatility during 1995-2002, in the later period of 2003-2008, the short-term factor is only responsible for 37% of the total volatility and the long-term factor used to be responsible for 63% of the total volatility.
This changed dynamic at the long end of the futures term structure is an important fact to note if we are going to address the challenge “So what about the missing
stockpiles of oil?” As usually posed, the argument about stockpiles oversimplifies both the physical oil market and the paper oil market. The focus on above-ground stockpiles forgets that in the oil business, the above-ground storage decision is a very short horizon problem. Oil is very expensive to store above-ground, and only a very low level of above-ground inventory is maintained at any given time. The return to above-ground storage is determined primarily by factors related to the short-run volatility in the spot price together with the slope of the forward curve along the first few months’ contracts. If the entire term structure is elevated so that the relative price between the first month contract and the second month contract, then the calculus regarding above-ground storage is unaffected. So long as investors believe that the long-term price of oil is high, it makes no sense for them to change their short-run production decisions to pump an extra barrel
of oil for the purpose of storing the extra unit in tanks to be held to the time of sale. An elevated level of the entire term structure should not produce a growing stockpile of oil stored in above-ground tanks.
Of course, if the level of the entire term structure is too high—i.e. if there is a bubble—it will certainly distort real investment and production decisions in the oil industry, leading to a greater and greater disconnect between the inflated price and the realized returns. That is the nature of a speculative bubble. Sooner or later the disconnect between the inflated price and fundamentals will become apparent: the bubble will burst. But in the new world of oil, the disconnect won’t immediately be evidenced in the form of above-ground stockpiles of oil. The false price signal from the high level of the futures curve will steer excess investment into developing new resources and production
capacity. But these are not as simply tallied as above-ground storage. For example, some have tried to retreat from pressing the case about above-ground storage and sought instead to consider below ground stocks. This is the right idea, but, unfortunately, the data there are abysmal. Only in a select few countries are there standard setting bodies that seriously enforce a meaningfully consistent definition of reserves. The vast majority of global reserves are controlled by nation states that exercise political discretion on what is reported publicly to be reserves. And, on top of this, the actual economic process of developing true reserves is extremely stochastic, which creates significant problems for identifying the accumulation of ‘excess’ reserves over such a short window of time.
So we are left with the conclusion that, for a period of time, there will be no agreement that the investment flows and anticipated capacity are too large. Indeed, this is one key factor that makes oil a candidate for a speculative bubble. If it were easy to
specify an obvious benchmark against which to measure the price, then beliefs about the price could not so easily fly free. Because the gradually inflating bubble affects longer term decisions, and it is only in the playing out of the longer term decisions that the reality of the bubble becomes transparent.
To summarize some key events that came together during the latter period: • oil futures became available at longer and longer maturities; at these
maturities the purchase of the futures became a bet solely on the direction of the spot price and without any of the return from backwardation, and therefore without any direct connection to short-term storage decisions;
• the market switched into a long-lasting and deep contango that compromised return on the traditional index portfolio strategy of being long the short maturity contracts, driving index investors out to longer maturities;
• the oil price level began to rise, with the term structure moving up persistently at all maturities, so that the major returns on a futures portfolio came from the rising spot price;
• investment vehicles for commodities had been growing; the large profits from the rise in the price level fueled a rapidly growing stream of funds in search of these profits; the price level rise continued in a lasting fashion, validating the initial investments and encouraging additional ones.
Obviously, this dynamic in the paper oil market cannot be seen independently of what was going on elsewhere in the economy.20 From a financial point of view, the oil market may have been a sideshow or as much a symptom of the larger euphoria, even though the consequences for things like gasoline prices give it a prominence in the popular media.
5. CONCLUSIONS
The oil price spike of 2003-2008 certainly looks like a bubble. Oil has become a classic financial asset and assets are subject to bubbles. Some of the peculiar historic
20 Indeed, Caballero, Farhi and Gourinchas (2008) argue that the financial collapse in other markets in 2007
sent investors in search of an alternative asset and they found it, at least in part, in oil. Their argument, therefore, focuses on only the final, most spectacular rise in the price of oil, as being caused by this flow of financial capital.
dynamics of the period may have coalesced in a fashion that fueled the type of investor beliefs that drive bubbles.
It isn’t easy to prove that the oil price was experiencing a bubble. The benchmark for the right ‘fundamental’ price is even more elusive for a commodity like oil than it is for stocks or for housing. On the one hand, that means it should be even easier for a bubble to arise. On the other hand, it means we need to be more humble in saying that we know it when we see it.
The argument that the lack of above-ground storage proves the oil price was not a bubble has no merit, and is based on an old mindset about oil prices. The price
movements of 2003-2008 would not have driven an accumulation of above-ground storage, whether the price movements were caused by changing fundamentals or by the foolish beliefs that drive a bubble.
The idea of an asset bubble is sometimes confused with the notion that financial investors are ‘manipulating’ the price. The two need not coincide. The beliefs driving a bubble can gain traction without there being any identifiable individuals behind it. There is no evidence of manipulation on any scale corresponding to the size of the oil price spike. There are specific cases of individual actors seeking to manipulate expectations and mask their activity. The most recent and relevant example concerns the company Vitol. But there are always cases of manipulation and masking in futures markets. They should be prosecuted. And perhaps the CFTC was under-resourced and not up to its task in this regard. But the issue of active manipulation is orthogonal to the question of an oil price bubble, at least during the 2003-2008 period.
The question has been raised whether speculative limits need to be made stricter. On the table in today’s political debate is the bona fide hedge extension that has been granted to swaps dealers. The general purpose of speculative limits is to constrain manipulation as well as to limit the sudden rise of order flow that would disrupt an orderly market. Speculative limits will not be very effective against an asset bubble driven by the type of widespread and gradually evolving beliefs that may have been at work in the 2003-2008 oil price. The type of asset bubble that I am speaking about here is really more of a macroeconomic problem, and not readily managed with micro-levers at the individual exchange level.
Just because an asset bubble is a bad thing that is driven by speculative activity and investor beliefs, doesn’t mean that we should ban speculation. It is not a bad thing that oil became a financial asset. This facilitates many types of real investments, lowering the cost of production. The possibility of an asset bubble is an unfortunate liability that comes with the territory. We should learn to be cautious about the possibility, and the polity needs to be ready to take measures to avoid development of bubbles. But stopping speculation wouldn’t be a useful step along the way.
A final issue that should be addressed is the question of transparency in the paper oil market. There has been an enormous political debate over the last few years as this price spike developed, and a spotlight was placed on things like the Enron loophole that allow financial traders to evade oversight and regulation. Does the conclusion that the oil price was, in part, a bubble argue in favor of closing down the off-exchange and other trading that is beyond the purview of the regulators? If the lack of transparency made any contribution to a bubble in the oil price, it was probably marginal. These two issues, too,
are mostly orthogonal. However, as the saying goes, “Just because you’re paranoid, doesn’t mean they aren’t after you.” Whether the lack of transparency contributed to the bubble or not, there is no good reason for it. And the lack of transparency is a dangerous thing, for all the reasons that the current financial crisis is now putting into bold relief. The oil and other energy markets have been far, far too opaque over the last two decades, and there have been bad actors lurking in the shadows. It would be wise, and terribly, terribly easy to fix it. Transparency is necessary to making the market function more effectively as a real market. It is a good that everyone but a few special interests ought to agree on.
References
Adelman, M.A., 1993, The Economics of Petroleum Supply, Cambridge: MIT Press. Baker, Malcolm P., E. Scott Mayfield and John E. Parsons, 1998, Alternative Models Of
Uncertain Commodity Prices For Use With Modern Asset Pricing Methods,
Energy Journal 19, 115-148.
Bank for International Settlements, 2009, Semiannual OTC Derivatives Statistics At
End-June 2008, Table 19, www.bis.org/statistics/derstats.htm.
Bodie, Zvi, and Victor Rosansky, 1980, Risk and Return in Commodity Futures,
Financial Analysts Journal, 36(3):27-39.
Caballero, Ricardo J., Emmanual Farhi and Pierre-Olivier Gourinchas, 2008, Financial Crash, Commodity Prices and Global Imbalances, forthcoming in the Brookings
Papers on Economic Activity.
Commodities Futures Trading Commission, 2008, Staff Report on Commodity Swap
Dealers and Index Traders with Commission Recommendations, Washington
D.C., September.
Du, Yangbo and John E. Parsons, 2009, Update on the Cost of Nuclear Power, MIT
Center for Energy and Environmental Policy Research Working Paper #09-003
forthcoming.
Eckaus, Richard, 2008, The Oil Price Really Is A Speculative Bubble, MIT Center for
Energy and Environmental Policy Research Working Paper #08-007.
Gibson, Rajna and Eduardo S. Schwartz, 1990, Stochastic Convenience Yield And The Pricing Of Oil Contingent Claims, Journal of Finance 45, 959–976.
Gorton, Gary, and K. Geert Rouwenhorst, 2006, Facts and Fantasies About Commodity Futures, Financial Analysts Journal, 62:47-68.
Greer, Robert J., 1978 , Conservative Commodities: A Key Inflation Hedge, Journal of
Portfolio Management (Summer):26-29.
Herce, Miguel, John E. Parsons and Robert C. Ready, 2006, Using Futures Prices to Filter Short-term Volatility and Recover a Latent, Long-term Price Series for Oil,
MIT Center for Energy and Environmental Policy Research Working Paper
#06-005.
Hotelling, H. (1931), The Economics of Exhaustible Resources, Journal of Political
Interagency Task Force on Commodity Markets, 2008, Interim Report on Crude Oil, Washington D.C., July.
Master, Michael W. and Adam K. White, 2008, The Accidental Hunt Brothers—How
Institutional Investors Are Driving Up Food And Energy Prices, at
www.accidentalhuntbrothers.com.
Mello, Antonio S., and John E. Parsons, 1995, “The Maturity Structure of a Hedge Matters: Lessons from the Metallgesellschaft Debacle,” Journal of Applied
Corporate Finance 8, No. 1: 106–120.
Neuberger, A., 1999, Hedging Long-Term Exposures With Multiple Short-Term Futures Contracts, Review of Financial Studies, 12:429-459.
Schwartz, Eduardo S., 1997, The Stochastic Behavior Of Commodity Prices: Implications For Valuation And Hedging, Journal of Finance 52, 923-973. Schwartz, Eduardo S. and James E. Smith, 2000, Short-Term Variations And Long-Term
Dynamics In Commodity Prices, Management Science 46, 893-911.
Williams, Jeffrey C. and Brian D. Wright, 1991, Storage and Commodity Markets, Cambridge UK: Cambridge University Press.
Table 1
Exchange Traded Open Interest in Crude Oil
compared to… Futures + Options Global Production Global Reserves US Reserves million barrels billion $ million barrels billion $ million barrels million barrels million barrels Jun 1995 398 6.8 Dec 1995 419 7.9 25,649 Jun 1996 415 8.3 Dec 1996 416 10.2 26,250 Jun 1997 466 9.1 Dec 1997 478 8.4 27,068 Jun 1998 546 7.9 Dec 1998 549 6.4 27,614 Jun 1999 653 12.5 Dec 1999 555 13.8 27,316 Jun 2000 517 16.0 724 22.5 Dec 2000 477 12.2 28,383 Jun 2001 516 13.5 Dec 2001 517 10.6 28,355 Jun 2002 530 14.1 Dec 2002 660 20.2 28,101 Jun 2003 583 17.2 Dec 2003 678 21.8 29,055 Jun 2004 761 28.1 1,163 42.9 Dec 2004 733 31.8 30,333 Jun 2005 866 49.8 Dec 2005 895 55.2 30,871 Jun 2006 1,180 88.2 Dec 2006 1,400 87.2 30,858 Jun 2007 1,669 118.5 Dec 2007 1,549 148.2 30,821 1,239 30 Jun 2008 1,441 202.5 3,068 431.2 Dec 2008 1,374 58.5 Source:
Open interest figures from NYMEX and ICE via Bloomberg. Global production figures are from the US EIA.
Reserves are from the BP Statistical Review of World Energy.
$0 $20 $40 $60 $80 $100 $120 $140 Au g -8 6 Au g -8 7 Au g -8 8 Au g -8 9 Au g -9 0 Au g -9 1 Au g -9 2 Au g -9 3 Au g -9 4 Au g -9 5 Au g -9 6 Au g -9 7 Au g -9 8 Au g -9 9 Au g -0 0 Au g -0 1 Au g -0 2 Au g -0 3 Au g -0 4 Au g -0 5 Au g -0 6 Au g -0 7 Au g -0 8 D o lla rs /B a rr e l
Figure 1. Oil Price, 1986-2008
Figure 2. Exchange Traded Open Interest in Crude Oil
million barrels 0 500 1,000 1,500 2,000 2,500 3,000 3,500 1995 1996 1997 1998 1999 2000 2001 2002 2003 2004 2005 2006 2007 2008Source: Bloomberg. Open Interest is the sum of contracts for all months for the NYMEX WTI, ICE WTI and ICE Brent crude contracts. billion $ 0 150 300 450 1995 1996 1997 1998 1999 2000 2001 2002 2003 2004 2005 2006 2007 2008
Figure 3. Shares of Open Interest by Type of Trader
(all contracts)
billion barrels 0 1 2 3 2000 2004 2008Source: Büyükşahin et al. (2008), based on Table 5. “Hedge Fund” category aggregates several finer categories in the CFTC LTRS database. See original source for breakdown. Percent Share 0% 25% 50% 75% 100% 2000 2004 2008