EUROPEAN ORGANISATION FOR NUCLEAR RESEARCH (CERN)
Nucl. Phys. B 918 (2017) 257
DOI:doi:10.1016/j.nuclphysb.2017.03.006 8th May 2017
High-E
T
isolated-photon plus jets production in pp
collisions at
√
s
= 8 TeV with the ATLAS detector
The ATLAS Collaboration
The dynamics of isolated-photon plus one-, two- and three-jet production in pp collisions at a centre-of-mass energy of 8 TeV are studied with the ATLAS detector at the LHC using a data set with an integrated luminosity of 20.2 fb−1. Measurements of isolated-photon plus jets cross sections are presented as functions of the photon and jet transverse momenta. The cross sections as functions of the azimuthal angle between the photon and the jets, the azimuthal angle between the jets, the photon–jet invariant mass and the scattering angle in the photon– jet centre-of-mass system are presented. The pattern of QCD radiation around the photon and the leading jet is investigated by measuring jet production in an annular region centred on each object; enhancements are observed around the leading jet with respect to the photon in the directions towards the beams. The experimental measurements are compared to several different theoretical calculations, and overall a good description of the data is found.
Contents
1 Introduction 3
2 The ATLAS detector 4
3 Data selection 5
3.1 Photon selection 6
3.2 Jet selection 7
3.3 Event categorisation 7
4 Monte Carlo simulations 9
5 Signal extraction 12
5.1 Backgrounds 12
5.2 Signal yield 13
6 Cross-section measurement procedure 13
7 Systematic uncertainties 14
7.1 Photon energy scale and resolution 15
7.2 Jet energy scale and resolution 15
7.3 Parton-shower and hadronisation model dependence 16
7.4 Photon identification efficiency 16
7.5 Choice of background control regions 16
7.6 Signal modelling 16
7.7 Identification and isolation correlation in the background 17
7.8 Total systematic uncertainty 17
8 Fixed-order QCD calculations 17
8.1 Calculations for photon plus one-jet final state 17
8.2 Calculations for photon plus two-jet and photon plus three-jet final states 18
8.3 Hadronisation and underlying-event corrections to the NLO QCD calculations 18
8.4 Theoretical uncertainties 19
9 Results 19
9.1 Fiducial regions and integrated cross sections 19
9.2 Cross sections for isolated-photon plus one-jet production 20
9.3 Cross sections for isolated-photon plus two-jet production 27
9.4 Comparison of jet production around the photon and jet1 32
9.5 Cross sections for isolated-photon plus three-jet production 33
1 Introduction
The production of prompt photons in association with jets in proton–proton collisions, pp → γ+ jets + X, provides a testing ground for perturbative QCD (pQCD) with a hard colourless probe less affected by hadronisation effects than jet production. The measurements of the angular correlations between the photon and the jets can be used to probe the dynamics of the hard-scattering process. Since the dominant production mechanism in pp collisions at the Large Hadron Collider (LHC) proceeds via the qg → qγ process, measurements of prompt-photon plus jet production are useful in constraining the gluon density in the proton [1,2]. These measurements can also be used to tune the Monte Carlo (MC) models and to test t-channel quark exchange [3].
At leading order (LO) in pQCD, the reaction pp → γ+ jet + X is understood to proceed via two separate production mechanisms: direct photons (D), which originate from the hard process, and fragmentation photons (F), which arise from the fragmentation of a coloured, high transverse momentum (pT) par-ton [4,5]. The direct and fragmentation contributions are only well defined at LO; at higher orders such distinction is no longer possible. Measurements of prompt-photon production in a final state with accom-panying hadrons require isolation of photons to avoid the large contribution from neutral-hadron decays into photons. The production of inclusive isolated photons in pp collisions was studied by the ATLAS [6–
9] and CMS [10,11] collaborations. The cross section for isolated photons in association with jets as a function of the photon transverse energy1 (EγT) in different regions of rapidity of the highest-pT jet was measured by ATLAS [12]. The production of isolated photons in association with jets was also measured by CMS [13–15].
The dynamics of the underlying processes in 2 → 2 hard scattering can be investigated using the variable θ∗, where cos θ∗ ≡ tanh(∆y/2) and ∆y is the difference between the rapidities of the two final-state particles. The variable θ∗ coincides with the scattering angle in the centre-of-mass frame for collinear scattering of massless particles, and its distribution is sensitive to the spin of the exchanged particle. For processes dominated by t-channel gluon exchange, such as dijet production in pp collisions, the cross section behaves as (1−| cos θ∗|)−2when | cos θ∗| → 1. In contrast, processes dominated by t-channel quark exchange, such as W/Z+ jet production, are expected to have an asymptotic (1 − | cos θ∗|)−1behaviour. This prediction from QCD can be tested in photon plus jet production in high-energy hadron–hadron collisions. The direct-photon contribution, as shown in Figure1(a), is expected to exhibit a (1−| cos θ∗|)−1 dependence when | cos θ∗| → 1, whereas that of fragmentation processes, as shown in Figure 1(b), is predicted to be the same as in dijet production, namely (1 − | cos θ∗|)−2. For both processes, there are also s-channel contributions which are, however, non-singular when | cos θ∗| → 1. At higher orders, direct processes such as qq → qqγ are dominated by t-channel gluon exchange and contribute to the distribution in | cos θ∗| with a component similar to that of fragmentation. However, a measurement of the cross section for prompt-photon plus jet production as a function of | cos θ∗| is still sensitive to the relative contributions of the direct and fragmentation components and allows a test of the dominance of the t-channel quark exchange, such as that shown in Figure1(a).
1 ATLAS uses a right-handed coordinate system with its origin at the nominal interaction point (IP) in the centre of the
detector and the z-axis along the beam pipe. The x-axis points from the IP to the centre of the LHC ring, and the y-axis points upwards. Cylindrical coordinates (r, φ) are used in the transverse plane, φ being the azimuthal angle around the
q
γ
q g q q q g q qγ
(a) (b)Figure 1: Examples of diagrams for (a) γ+jet production through direct-photon processes and (b) γ+jet production through fragmentation processes.
Colour connection between the partons in the initial and final states modifies the pattern of QCD radiation around the final-state partons. Colour-coherence effects were studied at the Tevatron [16,17] using dijet events by comparing the measurements with predictions with and without such effects. Photon plus two-jet events are optimal for investigating two-jet production around the photon and the highest-pTjet: the partons are colour-connected while the photon is colourless.
The results presented in this paper include measurements of cross sections for isolated-photon plus one-, two- and three-jet final states as functions of ETγ and the transverse momentum of the leading jet (jet1, pjet1T ), the second-highest-pT jet (jet2, pjet2T ) and the third-highest-pT jet (jet3, pjet3T ) [5, 18–20]. The analysis is performed using a dataset with an integrated luminosity of 20.2 fb−1of pp collisions at √s= 8 TeV. The dynamics of the photon plus one-jet system are studied by measuring the photon–jet invariant mass (mγ−jet1) and cos θ∗[5]. In addition, the azimuthal angles between the photon and each jet (∆φγ−jet2, ∆φγ−jet3) and between the jets (∆φjet1−jet2,∆φjet1−jet3,∆φjet2−jet3) are measured for photon plus two- and three-jet events [19, 20]. The production of jet2 around the photon and jet1 is measured separately to investigate the differences between the two configurations. The scale evolution of the photon plus one-jet system is studied by measuring the cross sections as functions of cos θ∗ in different regions of mγ−jet1. For photon plus two- and three-jet events, the scale evolution is investigated by measuring the angular correlations in different regions of EγT.
The predictions from the event generators Pythia [21] and Sherpa [22] are compared with the measure-ments. The next-to-leading-order (NLO) QCD predictions from Jetphox [23,24] are compared with the photon plus one-jet measurements, whereas those from Blackhat [25,26] are compared with the photon plus two-jet and photon plus three-jet measurements.
2 The ATLAS detector
The ATLAS detector [27] at the LHC covers nearly the entire solid angle around the collision point. It consists of an inner tracking detector surrounded by a thin superconducting solenoid, electromagnetic and hadronic calorimeters, and a muon spectrometer incorporating three large superconducting toroidal magnets.
The inner-detector system (ID) is immersed in a 2 T axial magnetic field and provides charged-particle tracking in the range |η| < 2.5. A high-granularity silicon pixel detector covers the interaction region and typically provides three measurements per track. It is followed by a silicon microstrip tracker, which provides eight two-dimensional measurement points per track. These silicon detectors are complemented by a transition radiation tracker, which enables radially extended track reconstruction up to |η| = 2.0. The transition radiation tracker also provides electron identification information based on the fraction of the typically 30 total hits which are above a higher energy-deposit threshold corresponding to transition radiation.
The calorimeter system covers the pseudorapidity range |η| < 4.9. Within the region |η| < 3.2, magnetic calorimetry is provided by barrel and endcap high-granularity lead/liquid-argon (LAr) electro-magnetic calorimeters, with an additional thin LAr presampler covering |η| < 1.8 to correct for energy loss in material upstream of the calorimeters; for |η| < 2.5 the LAr calorimeter is divided into three layers in depth, which are finely segmented in η and φ. Hadronic calorimetry is provided by a steel/scintillator-tile calorimeter, segmented into three barrel structures within |η| < 1.7, and two copper/LAr hadronic endcap calorimeters, which cover 1.5 < |η| < 3.2. The solid angle coverage is completed with forward copper/LAr and tungsten/LAr calorimeter modules optimised for electromagnetic and hadronic measure-ments, respectively.
The muon spectrometer (MS) comprises separate trigger and high-precision tracking chambers measuring the deflection of muons in a magnetic field generated by superconducting air-core toroids. The tracking chamber system covers the region |η| < 2.7 with three layers of monitored drift tubes, complemented by cathode-strip chambers in the forward region. The muon trigger system covers the range |η| < 2.4 with resistive-plate chambers in the barrel and thin-gap chambers in the endcap regions.
A three-level trigger system is used to select interesting events [28]. The level-1 trigger is implemented in hardware and uses a subset of detector information to reduce the event rate to at most 75 kHz. This is followed by two software-based trigger levels which together reduce the event rate to about 400 Hz.
3 Data selection
The data used in this analysis were collected during the proton–proton collision running period of 2012, when the LHC operated at a centre-of-mass energy of √s = 8 TeV. Only events taken in stable beam conditions and passing detector and data-quality requirements are considered. Events were recorded using a single-photon trigger, with a nominal transverse energy threshold of 120 GeV; this trigger is used offline to select events in which the photon transverse energy, after reconstruction and calibration, is greater than 130 GeV. For isolated photons with ETγ > 130 GeV and pseudorapidity |ηγ| < 2.37 the trigger efficiency is higher than 99.8%. The integrated luminosity of the collected sample is 20.2 ± 0.4 fb−1[29].
The sample of isolated-photon plus jets events is selected using offline criteria similar to those reported in previous publications [3,9]. Events are required to have a reconstructed primary vertex consistent with the average beam-spot position, with at least two associated charged-particle tracks with pT > 400 MeV. If more than one such vertex is present in the event, the one with the highest sum of the p2Tof the associated tracks is selected as the primary vertex.
During the 2012 data-taking period there were on average 19 proton–proton interactions per bunch cross-ing. The methods used to mitigate the effects of the additional pp interactions (pile-up) on the photon
3.1 Photon selection
The selection of photon candidates is based on energy clusters reconstructed in the electromagnetic calor-imeter with transverse energies exceeding 2.5 GeV. The clusters matched to charged-particle tracks, based on the distance in (η, φ) between the cluster barycentre and the track impact point extrapolated to the second layer of the LAr calorimeter, are classified as electron candidates. Those clusters without matching tracks are classified as unconverted photon candidates, and clusters matched to pairs of tracks originating from reconstructed conversion vertices in the inner detector or to single tracks with no hit in the innermost layer of the pixel detector are classified as converted photon candidates [30]. From MC simulations, 96% of prompt photons with EγT > 25 GeV are expected to be reconstructed as photon candidates, while the remaining 4% are incorrectly reconstructed as electrons but not as photons. The efficiency to reconstruct photon conversions decreases at high ETγ (> 150 GeV), where it becomes more difficult to separate the two tracks from the conversions. Such conversions with very nearby tracks are often not recovered as single-track conversions because of the tighter selections applied to single-track conversion candidates. The overall photon reconstruction efficiency is thus reduced to about 90% for ETγ ∼ 1 TeV [30].
The energy measurement is performed using calorimeter and tracking information. A dedicated energy calibration [31] is applied separately for converted and unconverted photon candidates to account for upstream energy loss and both lateral and longitudinal leakage.
The direction of the photon is determined from the barycentre of the energy cluster in the electromag-netic calorimeter and the position of the primary vertex. Events with at least one photon candidate with calibrated EγT > 130 GeV and |ηγ| < 2.37 are selected; candidates in the region 1.37 < |ηγ| < 1.56, which includes the transition region between the barrel and endcap calorimeters, are not considered. The same shower-shape and isolation requirements as described in previous publications [6,7,9,12,30] are applied to the candidates; these requirements are referred to as “tight” identification criteria. The photon identification efficiency for EγT > 130 GeV varies in the range (94–100)% depending on ηγ and whether the candidate is classified as an unconverted or converted photon [30].
The photon candidate is required to be isolated based on the amount of transverse energy in a cone of size∆R = 0.4 around the photon. The isolation transverse energy is computed from three-dimensional topological clusters of calorimeter cells (see Section 3.3) [32] and is denoted by EisoT,det. The measured value of ET,detiso is corrected for leakage of the photon’s energy into the isolation cone and the estimated contributions from the underlying event and pile-up. The latter correction is performed using the jet-area method [33] to estimate the ambient transverse energy density on an event-by-event basis; this estimate is used to subtract the joint contribution of the underlying event and pile-up to EisoT,det and amounts to 1.5–2 GeV in the 2012 data-taking period. After these corrections, EisoT,det is required to be lower than 4.8 GeV+ 4.2 · 10−3· EγT[GeV] [9]; the requirement is ETγ-dependent so that in simulation the fraction of identified photons which are isolated stays high as ETγ increases. The isolation requirement significantly reduces the main background, which consists of multi-jet events where one jet typically contains a π0or η meson that carries most of the jet energy and is misidentified as a prompt photon.
A small fraction of the events contain more than one photon candidate satisfying the selection criteria. In such events, the highest-EγTphoton is considered for further study.
3.2 Jet selection
Jets are reconstructed using the anti-kt algorithm [34] with radius parameter R = 0.6. The inputs to the jet reconstruction are three-dimensional topological clusters of calorimeter cells. This method first clusters topologically connected calorimeter cells and classifies these clusters as either electromagnetic or hadronic. The classification uses a local cluster weighting (LCW) calibration scheme based on cell-energy density and longitudinal depth within the calorimeter [35]. Based on this classification, energy corrections derived from single-pion MC simulations are applied. Dedicated corrections are derived for the effects of the non-compensating response of the calorimeter, signal losses due to noise-suppression threshold effects, and energy lost in non-instrumented regions. The jet four-momenta are computed from the sum of the topological cluster four-momenta, treating each as a four-vector with zero mass. These jets are referred to as detector-level jets. The direction of the jet is then corrected such that the jet originates from the selected primary vertex of the event. Prior to the final calibration, the contribution from the underlying event and pile-up is subtracted on a jet-by-jet basis using the jet-area method. An additional jet-energy calibration is derived from MC simulations as a correction relating the calorimeter response to the true jet energy. To determine these corrections, the jet reconstruction procedure applied to the topological clusters is also applied to the generated stable particles, which are defined as those with a lifetime τ longer than 10 ps, including muons and neutrinos; these jets are referred to as particle-level jets. In addition, sequential jet corrections, derived from MC simulated events and using global properties of the jet such as tracking information, calorimeter energy deposits and muon spectrometer information, are applied [36]. Finally, the detector-level jets are further calibrated with additional correction factors derived in situ from a combination of γ+ jet, Z + jet and dijet balance methods [35,37].
Jets reconstructed from calorimeter signals not originating from a pp collision are rejected by applying jet-quality criteria [35,38]. These criteria suppress spurious jets from electronic noise in the calorimeter, cosmic rays and beam-related backgrounds. Remaining jets are required to have calibrated transverse momenta greater than 50 GeV and rapidity |yjet|< 4.4. Jets overlapping with the candidate photon are not considered if the jet axis lies within a cone of size∆R = 1.0 around the photon candidate; this requirement prevents any overlap between the photon isolation cone (∆R = 0.4) and the jet cone (∆R = 0.6).
3.3 Event categorisation
To investigate the production of jets in association with a photon, six samples are selected; the require-ments are listed in Table1:
• “Photon plus one-jet sample” (P1J): it is used to study the major features of an inclusive sample of events with a photon and at least one jet. In this sample, jet1 is required to have pjet1T > 100 GeV; asymmetric requirements on ETγ and pjet1T are applied to reduce the infrared sensitivity of the NLO QCD calculations [39].
• “Photon plus one-jet mγ−jet1and cos θ∗sample” (P1JM): for the measurements of the cross sections as functions of mγ−jet1 and | cos θ∗| additional constraints are needed to remove biases due to the rapidity and transverse momentum requirements on the photon and jet1 [3]. To perform unbiased measurements, the requirements |ηγ + yjet1| < 2.37, | cos θ∗| < 0.83 and mγ−jet1 > 467 GeV are
applied.2 These selections define a kinematic region where the acceptance is independent of the variables being studied.
• “Photon plus two-jet sample” (P2J): it is used to study the major features of an inclusive sample of events with a photon and at least two jets and the azimuthal correlations between the photon and jet2 as well as between jet1 and jet2. Due to the resolution in pTthe highest- and next-to-highest-pT particle-level jets can end up being reconstructed as jet2 and jet1, respectively. To suppress such migrations, asymmetric requirements are applied: pjet1T > 100 GeV and pjet2T > 65 GeV.
• “Photon plus three-jet sample” (P3J): it is used to investigate the major characteristics of an in-clusive sample of events with a photon and at least three jets; in addition, measurements of the azimuthal correlations between the photon and jet3, jet1 and jet3, as well as between jet2 and jet3 are performed. Asymmetric requirements are applied to suppress the migrations in pTbetween the three highest-pT jets: pjet1T > 100 GeV, pjet2T > 65 GeV and pjet3T > 50 GeV.
To compare the pattern of QCD radiation around the photon and jet1, two additional samples of photon plus two-jet events are selected. The phase-space regions are defined to avoid biases due to different pT and η requirements on the final-state objects as well as to have no overlap between the two samples. The following requirements are common to the two samples:
• The jets must satisfy pjet1T > 130 GeV, |ηjet1|< 2.37 and pjet2T > 50 GeV. The first two requirements are imposed to be the same as for the photon so as to compare additional jet production in similar regions of phase space. The third requirement is chosen to select jets with the lowest pT threshold, while suppressing the contribution from the underlying event and pile-up.
• The angular distance between the photon and jet1,∆Rγ−jet1, is restricted to∆Rγ−jet1> 3 to avoid any overlap between the two samples and any bias within the regions that are used to study additional jet production.
The requirements specific to each of the two samples are listed below:
• “Photon plus two-jet βγselection” (P2JBP): it is used to measure the production of jet2 around the photon. The cross section is measured as a function of the observable βγ[16,17], which is defined as3
βγ = tan−1 |φjet2−φγ|
sign(ηγ) · (ηjet2−ηγ). (1)
The phase space is restricted to 1 <∆Rγ−jet2< 1.5; the lower requirement avoids the overlap with the photon isolation cone while the upper requirement is the largest value which makes this sample and the next one non-overlapping. In addition, pjet2T < ETγis imposed for comparison with the other sample.
• “Photon plus two-jet βjet1 selection” (P2JBJ): it is used to measure the production of jet2 around jet1 using the observable βjet1, defined as
βjet1= tan−1 |φjet2−φjet1|
sign(ηjet1) · (ηjet2−ηjet1). (2)
2The maximal (minimal) value of | cos θ∗| (mγ−jet1) for which the measurement is unbiased corresponds to tanh(2.37/2) (2 ·
EγT/ sin θ∗
) with ETγ= 130 GeV and cos θ∗= 0.83.
To compare on equal footing with the measurement of the previous sample, the restriction 1 <∆Rjet1−jet2<1.5 is applied.
Schematic diagrams for the definitions of βγ and βjet1are shown in Figure 2. The variable βγ (βjet1) is defined in such a way that βγ = 0 or π (βjet1= 0 or π) corresponds to a plane in space containing jet2, the beam axis and the photon (jet1); β= 0 (π) always points to the beam which is closer to (farther from) the photon or jet1 in the η–φ plane.
The number of selected events in data for each of the six samples is included in Table1. The overlap between the different samples is as follows: (a) P3J is contained within P2J, which in turn is a subset of P1J; (b) P1JM is contained within P1J; (c) P2JBP and P2JBJ have no overlap.
Sample
P1J P1JM P2J P2JBP P2JBJ P3J
Common EγT> 130 GeV and |ηγ|< 2.37, excluding 1.37 < |ηγ|< 1.56
requirements |yjet|< 4.4 and ∆Rγ−jet> 1
pjet1T [GeV] > 100 > 100 > 100 > 130 > 130 > 100 pjet2T [GeV] − − > 65 > 50 > 50 > 65 pjet3T [GeV] − − − − − > 50 |ηγ+ yjet1| − < 2.37 − − − − | cos θ∗| − < 0.83 − − − − mγ−jet1[GeV] − > 467 − − − − ∆Rγ−jet1 − − − > 3 > 3 − ∆Rγ−jet2 − − − 1 <∆Rγ−jet2<1.5 − − ∆Rjet1−jet2 − − − − 1 <∆Rjet1−jet2<1.5 − |ηjet1| − − − < 2.37 < 2.37 − pjet2T , EγT − − − pjet2T < ETγ − − Number of Events 2 451 236 344 572 567 796 40 537 37 429 164 062 Normalisation factor Sherpa (Pythia) 1.0 (1.1) 1.0 (1.2) 1.1 (1.2) 1.0 (1.2) 1.0 (1.2) 1.1 (1.1)
Table 1: Characteristics of the six samples of γ+ jet(s) events: kinematic requirements, number of selected events in data and normalisation factors applied to the MC predictions.
4 Monte Carlo simulations
Samples of MC events were generated to study the characteristics of signal events. The MC samples were also used to determine the response of the detector and the correction factors necessary to obtain the particle-level cross sections. In addition, these samples were used to estimate hadronisation corrections to the NLO QCD calculations.
η 0.0 4.4 -4.4 -2.37 2.37 φ π -π 0.0 β=0 β=π/2 β=π R=1.5 Photon jet1 R=1.0 jet2 η 0.0 4.4 -4.4 -2.37 2.37 φ π -π 0.0 β=0 β=π/2 R=1.5 β=π Photon jet1 R=1.0 jet2 (a) (b)
The MC programs Pythia 8.165 [21] and Sherpa 1.4.0 [22] were used to generate the simulated events (see Table2). In both generators, the partonic processes were simulated using LO matrix elements, with the inclusion of initial- and final-state parton showers. Fragmentation into hadrons was performed using the Lund string model [40] in the case of Pythia, and a modified version of the cluster model [41] in the case of Sherpa, for which it is the default treatment. The LO CTEQ6L1 [42] (NLO CT10 [43]) parton distribution functions (PDF) were used to parameterise the proton structure in Pythia (Sherpa). Both samples included a simulation of the underlying event. The event generator parameters were set according to the “AU2 CTEQ6L1” [44] tune for Pythia and the “CT10” tune for Sherpa. All samples of generated events were passed through the Geant4-based [45] ATLAS detector- and trigger-simulation programs [46]. They were reconstructed and analysed by the same program chain as the data.
The Pythia simulation of the signal included LO photon plus jet events from both direct processes (the hard subprocesses qg → qγ and q ¯q → gγ, called “hard component”) and photon bremsstrahlung in QCD dijet events (called “brem component”). The Sherpa samples were generated with LO matrix elements for photon plus jet final states with up to three additional partons, supplemented with parton showers. While the brem component was modelled in Pythia by final-state QED radiation arising from calculations of all 2 → 2 QCD processes, it was accounted for in Sherpa through the matrix elements of 2 → n processes with n ≥ 3; in the evaluation of the matrix elements the photon was required to be farther than∆R = 0.3 from any parton.
All samples were simulated taking into account the effects of the pile-up appropriate for 2012 data. The additional interactions were modelled by overlaying simulated hits from events with exactly one high momentum-transfer (signal) collision per bunch crossing with hits from minimum-bias events that were produced with the Pythia 8.160 program [21] using the A2M tune [44] and the MSTW2008 LO [47] PDF set.
Dedicated Pythia and Sherpa samples of events were generated at particle and parton levels, switching off the mechanisms that account for the underlying event to correct the NLO calculations for hadronisation and underlying-event effects.
The particle-level isolation variable on the photon was built from the transverse energy of all stable particles, except for muons and neutrinos, in a cone of size∆R = 0.4 around the photon direction after the contribution from the underlying event was subtracted; in this case, the same underlying-event subtraction procedure used on data was applied at the particle level. The isolation transverse energy at particle level is denoted by EisoT,part. The particle-level requirement on EisoT,partwas determined using the Pythia and Sherpa MC samples, by comparing the calorimeter isolation transverse energy with the particle-level isolation on an event-by-event basis. The effect of the experimental isolation requirement used in the data is close to a particle-level requirement of ET,partiso < 10 GeV over the measured ETγ range. The measured cross sections refer to particle-level jets and photons that are isolated by requiring EisoT,part< 10 GeV.
The MC predictions at particle level are normalised to the measured integrated cross sections. The norm-alisation factors are applied globally for each sample defined in Section3.3and are listed in Table1.
Name Matrix elements PDF Tune
Pythia 8.165 2 → 2 LO CTEQ6L1 AU2 CTEQ6L1
Sherpa 1.4.0 2 → n, n= 2, ..., 5 NLO CT10 CT10
Table 2: The generators used for correcting the data are listed, together with their matrix elements, the PDF and the tunes.
5 Signal extraction
5.1 Backgrounds
A non-negligible background contribution from jets remains in the selected sample, even after the ap-plication of the tight identification and isolation requirements on the photon. The background subtraction uses a data-driven method based on signal-suppressed control regions. The background contamination in the selected sample is estimated using the same two-dimensional sideband technique as in the previous analyses [3,6,7,9,12] and then subtracted bin-by-bin from the observed yield. In the two-dimensional plane formed by EisoT,detand the photon identification variable, four regions are defined:
• A: the “signal” region, containing tight isolated photon candidates.
• B: the “non-isolated” background control region, containing tight non-isolated photon candidates. A candidate photon is considered to be non-isolated if EisoT,det> (4.8+2) GeV+4.2·10−3· ETγ[GeV]; the threshold is 2 GeV higher than the isolation requirement for the signal region.
• C: the “non-tight” background control region, containing isolated non-tight photon candidates. A candidate photon is labelled as “non-tight” if it fails at least one among four of the tight re-quirements on the shower-shape variables computed from the energy deposits in the first layer of the electromagnetic calorimeter, but satisfies the tight requirement on the total lateral shower width [30] in the first layer and all the other tight identification criteria in other layers.
• D: the background control region containing non-isolated non-tight photon candidates.
The signal yield in region A, NsigA , is estimated from the numbers of events in regions A, B, C and D and takes into account the expected number of signal events in the three background control regions via signal leakage fractions, which are extracted from MC simulations of the signal. The only hypothesis is that the isolation and identification variables are uncorrelated in background events, thus Rbg = (NAbg· NDbg)/(NbgB · NCbg) = 1, where NKbg with K = A, B, C, D is the number of background events in each region. This assumption is verified [9] both in simulated background samples and in data in a background-dominated region. Deviations from unity are taken as systematic uncertainties (see Section7). In addition, a systematic uncertainty is assigned to the modelling of the signal leakage fractions. Since the simulation does not accurately describe the electromagnetic shower profiles, a correction factor for each simulated shape variable is applied to better match the data [6,7].
There is an additional background from electrons misidentified as photons, mainly produced in Z → e+e− and W → eν processes. Such misidentified electrons are largely suppressed by the photon selection. The remaining electron background is estimated using MC simulations and found to be negligible in the phase-space region of the analysis presented here.
5.2 Signal yield
The signal purity, defined as NsigA /NA, is typically above 0.9 and is similar whether Pythia or Sherpa is used to extract the signal leakage fractions. The signal purity increases as EγT, pjet1T and mγ−jet1increase and decreases as | cos θ∗| increases.
For most of the distributions studied, the shapes of the hard and brem components in the signal MC sim-ulated by Pythia are somewhat different. Therefore, in each case, the shape of the total MC distribution depends on the relative fraction of the two contributions. To improve the description of the data by the Pythia MC samples, a fit [3] to each data distribution is performed with the weight of the hard contribu-tion, α, as the free parameter; the weight of the brem contribution is given by 1 − α. The fitted values of α are in the range 0.26–0.86. After these fits, a good description of the data is obtained from the Pythia MC simulations for all the observables, except for the distributions in the azimuthal angle between the jets. The simulations of Sherpa give a good description of the data, except for the tail of the distributions in ETγ.
The integrated efficiency, including the effects of trigger, reconstruction, particle identification and event selection, is evaluated from the simulated signal samples described in Section4. The integrated efficiency
is computed as ε = Ndet,part/Npart, where Ndet,part is the number of MC events that pass all the selection requirements at both the detector and particle levels and Npartis the number of MC events that pass the selection requirements at the particle level. The integrated efficiency using Sherpa (Pythia) is found to be 81.3% (81.5%) for the photon plus one-jet, 74.6% (75.3%) for the photon plus two-jet and 70.2% (70.6%) for the photon plus three-jet sample.
The bin-to-bin efficiency is computed as εi = Nidet,part/Nipart, where Nidet,part is the number of MC events that pass all the selection requirements at both the detector and particle levels and are generated and reconstructed in bin i, and Nipartis the number of MC events that pass the selection requirements at the particle level and are generated in bin i. The bin-to-bin efficiencies are typically above 50%, except for the pjetT observables (& 40%) due to the resolution in these steeply falling distributions, and are similar for Sherpa and Pythia.
The bin-to-bin reconstruction purity is computed as κi = Nidet,part/Nidet, where Nidetis the number of MC events that pass the selection requirements at the detector level and are reconstructed in bin i. The bin-to-bin reconstruction purities are typically above 55%, except for pjetT (& 40%) for the same reason as the bin-to-bin efficiency, and are similar for Sherpa and Pythia.
6 Cross-section measurement procedure
The cross sections, after background subtraction, are corrected to the particle level using a bin-by-bin correction procedure. The bin-by-bin correction factors are determined using the MC samples; these correction factors take into account the efficiency of the selection criteria and the jet and photon recon-struction, as well as migration effects. The Sherpa samples are used to compute the nominal correction factors to the cross sections and the Pythia samples are used to estimate systematic uncertainties due to the modelling of the parton shower, hadronisation and signal (see Section7).
The cross sections are corrected to the particle level via the formula dσ
dA(i)=
NAsig(i) CMC(i)
L∆A(i) , (3)
where (dσ/dA)(i) is the cross section as a function of observable A, NsigA (i) is the signal yield in bin i, CMC(i) is the correction factor in bin i, L is the integrated luminosity and∆A(i) is the width of bin i. The correction factors are computed as
CMC(i)=
NpartSherpa(i)
NdetSherpa(i), (4)
where Ndet (part)Sherpa (i) is the number of events in the Sherpa samples at detector (particle) level in bin i. For the systematic uncertainties estimated with the Pythia samples, the acceptance correction factors are computed as
CMC(i)= α N Pythia,H
part (i)+ (1−α) NpartPythia,B(i) α NPythia,H
det (i)+ (1−α) N Pythia,B
det (i)
, (5)
where α is the value obtained from the fit to the data distribution of each observable and Ndet (part)Pythia (i) is the number of events in the Pythia samples at detector (particle) level in bin i. The indices H and B correspond to the hard and brem Pythia components, respectively. The correction factors from Pythia and Sherpa are very similar and differ from unity by typically . 20%. The average correction factor for each distribution is listed in Table3. The results of the bin-by-bin unfolding procedure are checked with a Bayesian unfolding method [48], giving consistent results.
Sample Distribution: CMCusing Sherpa (Pythia) P1J EγT: 1.18 (1.17) pjet1T : 1.20 (1.17)
P1JM mγ−jet1: 1.21 (1.18) | cos θ∗|: 1.16 (1.14)
P2J EγT: 1.17 (1.15) pjet2T : 1.22 (1.15) ∆φγ−jet2: 1.13 (1.11) ∆φjet1−jet2: 1.13 (1.11)
P3J EγT: 1.15 (1.13) pjet3T : 1.19 (1.18) ∆φγ−jet3: 1.11 (1.09) ∆φjet1−jet3: 1.11 (1.09) ∆φjet2−jet3: 1.12 (1.10)
Table 3: Overview of the average correction factor CMCfor each distribution using the Sherpa and Pythia samples.
7 Systematic uncertainties
Several sources of systematic uncertainty are investigated. These sources include the photon energy scale and resolution, the jet energy scale and resolution, the parton-shower and hadronisation model dependence, the photon identification efficiency, the choice of background control regions, the signal modelling and the identification and isolation correlation in the background. Each source is discussed below. An overview of the systematic uncertainties in the cross sections is given in Table4.
7.1 Photon energy scale and resolution
Differences between the photon energy scale and resolution in data and the simulations lead to systematic uncertainties. A total of 20 individual components [31] influencing the energy measurement of the photon are identified and varied within their uncertainties to assess the overall uncertainty in the energy measure-ment. These uncertainties are propagated through the analysis separately to maintain the full information about the correlations. The total relative photon energy-scale uncertainty is in the range (0.3–0.9)% for |ηγ| < 1.37, (1.3–2.4)% for 1.56 < |ηγ| < 1.81 and (0.3–0.7)% for 1.81 < |ηγ| < 2.37 depending on the photon transverse energy and whether the candidate is classified as an unconverted or converted photon. Similarly to the energy scale uncertainty, the energy resolution is also influenced by different contribu-tions (seven components), which are also propagated through the analysis separately to maintain the full information about the correlations.
The systematic uncertainties in the measured cross sections due to the effects mentioned above are estim-ated by varying each individual source of uncertainty separately in the MC simulations and then added in quadrature. The largest contribution arises from the uncertainty in the gain of the second layer of the electromagnetic calorimeter. The photon energy scale contributes an uncertainty in the cross section measured as a function of EγTof ±1% (±4%) at low (high) ETγ, and typically less than ±2% when meas-ured with the jet observables. The photon energy resolution contributes an uncertainty in the measmeas-ured cross sections of less than ±1% for all observables.
7.2 Jet energy scale and resolution
The jet energy scale (JES) uncertainty contains a full treatment of bin-to-bin correlations for systematic uncertainties. A total of 67 individual components [37] influencing the energy measurement of the jets are identified and varied within their uncertainties to assess the overall uncertainty in the jet energy measure-ment. These parameters are propagated through the analysis separately to maintain the full information about the correlations. The total relative jet energy-scale uncertainty is. ±3% in the phase-space region of the measurements.
The jet energy resolution (JER) uncertainty accounts for the differences between data and simulated events. The impact of the JER uncertainty is estimated by smearing the MC simulated distributions and comparing the smeared and non-smeared results.
The systematic uncertainties in the measured cross sections due to the effects mentioned above are estim-ated by varying each individual source of uncertainty separately in the MC simulations and then added in quadrature. The major contributions arise from uncertainties in (a) the electron and photon energy scale, which affect the in situ corrections obtained from γ + jet and Z + jet events, (b) the modelling of the am-bient transverse energy used in the subtraction of the underlying event and pile-up, and (c) the modelling of the quark and gluon composition of the jets. The resulting uncertainty due to the JES is the dominant effect on the measured cross sections, except for those as functions of EγT. As an example, the effect on the measured cross section as a function of pjet1T is below ±6% for pjet1T < 600 GeV and grows to ≈ ±15% for pjet1T ∼ 1 TeV. The JER contributes an uncertainty in the measured cross sections which is smaller than ±1% for the photon plus one-jet observables; for the photon plus two-jet and photon plus three-jet observables it is below ±4%.
7.3 Parton-shower and hadronisation model dependence
The difference between the signal purities and the correction factors estimated in Sherpa and Pythia is taken as an estimate of the systematic uncertainty due to the parton-shower and hadronisation models. The resulting uncertainty in the measured cross sections is below ±3% for the photon plus one-jet meas-urements, except for pjet1T (for which the uncertainty increases to ±9% for pjet1T ∼ 1 TeV), below ±6% for the photon plus two-jet measurements, except for pjet2T (for which the uncertainty increases to ±13% for pjet2T ∼ 1 TeV), and below ±7% for the photon plus three-jet measurements.
7.4 Photon identification efficiency
Scale factors are applied to the MC events to match the “tight” identification efficiency between data and simulation [30]. The uncertainty in the photon identification is estimated by propagating the uncertainty in these scale factors through the analysis. These effects result in an uncertainty in the measured cross sections which is smaller than ±0.4% for all observables.
7.5 Choice of background control regions
The estimation of the background contamination in the signal region is affected by the choice of back-ground control regions. The latter are defined by the lower limit on EisoT,det in regions B and D and the choice of inverted photon identification variables used in the selection of non-tight photons. To study the dependence on the specific choices these definitions are varied over a wide range. The lower limit on EisoT,detin regions B and D is varied by ±1 GeV, which is larger than any difference between data and simulations and still provides enough events to perform the data-driven subtraction. Likewise, the choice of inverted photon identification variables is varied. The analysis is repeated using different sets of vari-ables: tighter (looser) identification criteria are defined by applying tight requirements to an extended (restricted) set of shower-shape variables in the first calorimeter layer [9]. The effects of these variations on the measured cross sections are typically smaller than ±1% for all observables.
7.6 Signal modelling
The simulation of the signal from the Pythia MC samples is used to estimate the systematic uncertainties arising from the modelling of the hard and bremsstrahlung components, which affect the signal leakage fractions in the two-dimensional sideband method for background subtraction and the bin-by-bin correc-tion factors.
To estimate the effect of the signal modelling on the signal leakage fractions, the Pythia components are first mixed according to the default value given by the MC cross section to determine the signal yield. The uncertainty related to the simulation of the hard and brem components in the signal leakage fractions is estimated by performing the background subtraction using the admixture derived from the fit. For this estimation, the bin-by-bin correction factors are computed using Eq. (5).
To estimate the effect of the signal modelling on the bin-by-bin correction factors, the components in Pythia are mixed according to Eq. (5) but using α ±∆α, where ∆α is the error from the fit (see Sec-tion5.2).
These effects result in an uncertainty in the measured cross sections which is typically smaller than ±1% for all observables.
7.7 Identification and isolation correlation in the background
The isolation and identification photon variables used to define the plane in the two-dimensional sideband method to subtract the background (see Section5.1) are assumed to be uncorrelated for background events (Rbg= 1). Any correlation between these variables would affect the estimation of the purity of the signal and lead to systematic uncertainties in the background-subtraction procedure. It was shown that Rbg is consistent with unity within ±10% [9]. Therefore, ±10% is taken as the uncertainty in Rbg related to the identification and isolation correlation in the background. These effects result in an uncertainty in the measured cross sections which is typically smaller than ±1% for all observables.
7.8 Total systematic uncertainty
The total systematic uncertainty is computed by adding in quadrature the sources of uncertainty listed in the previous sections and the statistical uncertainty of the MC samples. The uncertainty in the integrated luminosity is ±1.9% [29]; this uncertainty is fully correlated in all bins of all the measured cross sections and is added in quadrature to the other uncertainties.
8 Fixed-order QCD calculations
The measurements are compared to the highest fixed-order pQCD prediction available for each final state. The details of the calculations are given below.
8.1 Calculations for photon plus one-jet final state
The LO and NLO QCD calculations used in the photon plus one-jet analysis presented here are performed using the program Jetphox 1.3.2 [23,24]. This program includes a full NLO calculation of both the direct and fragmentation QCD contributions to the cross section for the pp → γ+ jet + X reaction.
The calculation assumes five massless quark flavours. The renormalisation (µR), factorisation (µF) and fragmentation (µf) scales are chosen to be µR= µF = µf = ETγ. The calculations are performed using the CT10 parameterisations of the proton PDF and the NLO BFG set II photon fragmentation function [49]. The strong coupling constant is calculated at two loops with αs(mZ)= 0.118.
The calculations are performed using a parton-level isolation criterion which requires the total transverse energy from the partons inside a cone of∆R = 0.4 around the photon direction, called cone isolation henceforth, to be below 10 GeV. The anti-kt algorithm with radius parameter R = 0.6 is applied to the partons in the events generated by this program to compute the cross-section predictions.
Variable
Source of Photon plus one-jet Photon plus two-jet Photon plus three-jet uncertainty EγT pjet1T | cos θ∗| pjet2T ∆φ pjet3T ∆φ Photon energy scale and (1–4)% (0–3.5)% (1–1.4)% (0–2.5)% (0–2.4)% (0–1.9)% (0–1.7)% resolution Jet energy scale (0–1.7)% (2.4–15)% (1.8–2.3)% (3.6–10)% (1.8–9)% (5.5–14)% (4.5–11)% Jet energy resolution (0–0.3)% (0.1–1.0)% (0.1–0.4)% (0.1–1.5)% (0.2–2.0)% (1.1–4.0)% (0.1–2.5)% Parton shower and hadronisation (0–0.8)% (1.1–9)% (0.6–1.3)% (1–13)% (0.8–4.6)% (2.3–5.6)% (2.1–7)% models Photon identification (0–0.4)% (0–0.4)% (0–0.4)% (0–0.4)% (0–0.4)% (0–0.4)% (0–0.4)% Background control (0–1)% (0–1.1)% (0–0.6)% (0–1.2)% (0–0.5)% (0–1.9)% (0–1)% regions Signal modelling (0–0.1)% (0–0.14)% (0–0.4)% (0–0.6)% (0–0.7)% (0–0.5)% (0–1.2)% Correlation in background (0–0.8)% (0–0.7)% (0–0.9)% (0–0.6)% (0–0.6)% (0–0.6)% (0–0.5)%
Table 4: Overview of the relative systematic uncertainties in the cross sections.
8.2 Calculations for photon plus two-jet and photon plus three-jet final states
NLO QCD calculations are performed separately for photon plus two-jet and photon plus three-jet final states using the program Blackhat+Sherpa [25,26]. This program includes a full NLO QCD calculation of only the direct contribution to the cross section for the pp → γ+ 2 jets + X and pp → γ + 3 jets + X reactions. Therefore, the highest-order calculation used in this paper corresponds to that of photon plus three-jet production and it is up to O(αemα4s). The µRand µFscales are chosen to be µR= µF= ETγ. The settings for the number of flavours, αs(mZ) and proton PDF are the same as for Jetphox. The calculations are performed using a parton-level isolation on the photon based on the Frixione method [50], called Frixione isolation henceforth. As with Jetphox, the anti-kt algorithm with radius parameter R = 0.6 is applied to the final-state partons.
8.3 Hadronisation and underlying-event corrections to the NLO QCD calculations
Since the measurements refer to jets of hadrons and include underlying-event (UE) effects, whereas the NLO QCD calculations refer to jets of partons without such effects, the cross-section predictions are cor-rected to include UE effects at particle level using the MC models. The correction factor, CNLO, is defined as the ratio of the cross section for jets of hadrons with UE to that for jets of partons. The correction factors
for the photon plus one-jet predictions are estimated using the Pythia samples (using cone isolation) and those for the photon plus two/three-jet predictions are estimated using the Sherpa samples; in the latter case, the cone (Frixione) isolation is used at the particle (parton) level to match the measurements (pre-dictions). The MC samples of Pythia (Sherpa) are suited for estimating the correction factors for Jetphox (Blackhat) since these NLO QCD calculations include (do not include) the fragmentation contribution. These factors are close to unity for the photon plus one-jet observables, except for pjet1T & 500 GeV, where they can differ by up to 30% from unity due to the dominance of the bremsstrahlung component in that region. For photon plus two-jet (three-jet) observables the average correction factor is 1.10 (1.14).
8.4 Theoretical uncertainties
The following sources of uncertainty in the theoretical predictions are considered:
• The uncertainty due to the scales is estimated by repeating the calculations using values of µRand µFscaled by factors 0.5 and 2. The two scales are varied individually. In the case of photon plus one-jet calculations, the µf scale is also varied.
• The uncertainty due to the proton PDF is estimated by repeating the calculations using the 52 additional sets from the CT10 error analysis and taking the sum in quadrature of all the uncertainty components. The scaling factor of 1/1.645 is applied to convert the 90% confidence-level (CL) interval as provided in Ref. [43] to a 68% CL interval.
• The uncertainty due to the value of αs(mZ) is estimated by repeating the calculations using two additional sets of proton PDFs, for which different values of αs(mZ) are assumed in the fits, namely αs(mZ)= 0.116 and 0.120. In addition, the same scaling factor mentioned above is also applied to obtain the uncertainty for the 68% CL interval.
• The uncertainty on the hadronisation and underlying-event corrections is negligible compared to the other uncertainties on the theoretical predictions [3].
The dominant theoretical uncertainty is that arising from the scale variations. The total theoretical uncer-tainty is obtained by adding in quadrature the individual uncertainties listed above.
9 Results
9.1 Fiducial regions and integrated cross sections
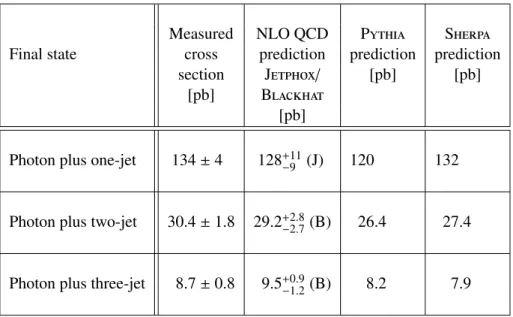
The measurements presented here refer to isolated prompt photons with ET,partiso < 10 GeV (see Section4) and jets of hadrons (see Section3.2). The details of the phase-space regions are given in Table1. The integrated cross sections for the photon plus one-jet, photon plus two-jet and photon plus three-jet final states are shown in Table5. The measured and predicted integrated cross sections are consistent within the experimental and theoretical uncertainties.
Measured NLO QCD Pythia Sherpa
Final state cross prediction prediction prediction
section Jetphox/ [pb] [pb]
[pb] Blackhat
[pb]
Photon plus one-jet 134 ± 4 128+11−9 (J) 120 132
Photon plus two-jet 30.4 ± 1.8 29.2+2.8−2.7(B) 26.4 27.4
Photon plus three-jet 8.7 ± 0.8 9.5+0.9−1.2(B) 8.2 7.9
Table 5: Measured and predicted integrated cross sections.
9.2 Cross sections for isolated-photon plus one-jet production
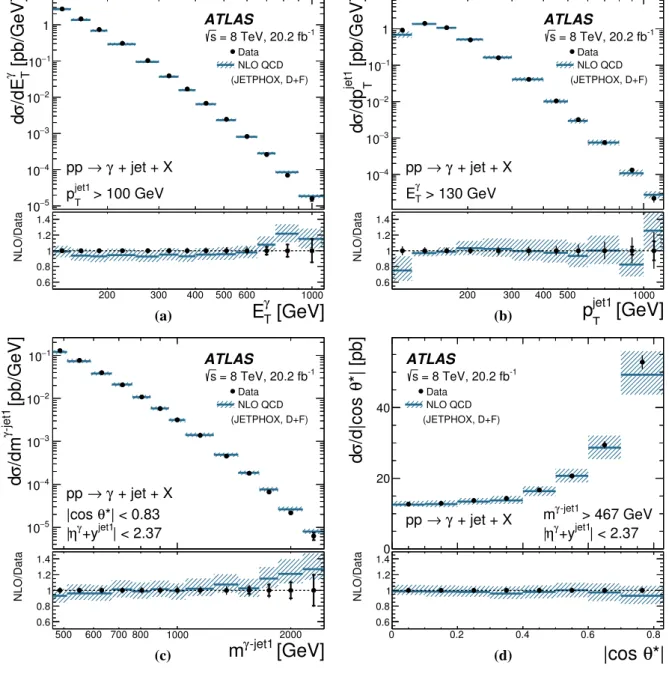
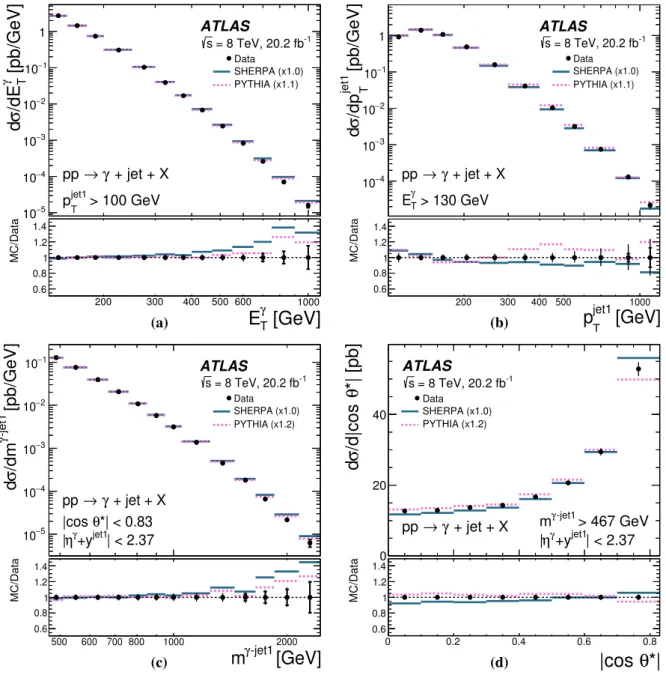
The measured cross-section dσ/dEγT, shown in Figure 3(a), decreases by five orders of magnitude as ETγ increases over the measured range. Values of EγT up to 1.1 TeV are measured. The experimental uncertainty is below 5% for ETγ . 650 GeV, dominated by the photon energy scale uncertainty, and grows to 15% at EγT ∼ 1 TeV, dominated by the statistical uncertainty in this region. The NLO QCD prediction from Jetphox is compared with the measurement in Figure3(a). The NLO QCD prediction gives a good description of the data within the experimental and theoretical uncertainties. The theoretical uncertainty varies from ≈ 7% for EγT ∼ 130 GeV to ≈ 10% for ETγ ∼ 1 TeV; it is dominated by the contribution arising from scale uncertainties, in particular from the variation of µR (7% (5%) at low (high) ETγ), although for ETγ & 750 GeV the uncertainty from the PDF grows to be of the same order and dominates for higher EγT values (≈ 8% for ETγ ∼ 1 TeV). The predictions from Sherpa and Pythia are compared with the measurements in Figure4(a). Both predictions give an adequate description of the shape of the data distribution within the experimental and theoretical uncertainties; the theoretical uncertainties are necessarily at least as large as for the NLO QCD calculations.
The measured cross-section dσ/dpjet1T , shown in Figure3(b), decreases by five orders of magnitude from pjet1T ∼ 120 GeV to the highest transverse momentum available, pjet1T ≈ 1.2 TeV; for pjet1T < 120 GeV the cross section decreases due to the kinematic analysis requirements. The total experimental uncertainty is below 6% for pjet1T < 500 GeV and grows to ≈ 25% for pjet1T ∼ 1.1 TeV. It is dominated by the uncertainty in the jet energy scale. The NLO QCD prediction gives a good description of the data except for pjet1T < 120 GeV, where in the calculation of A · αemαs+ B · αemα2s [23,24] the Born term is zero, i.e. A = 0. The theoretical uncertainty grows from < 5% at pjet1T ∼ 135 GeV to ≈ 25% for pjet1T ∼ 1.1 TeV and is dominated by the variation of µR in the whole measured range. The predictions from Sherpa and Pythia give an adequate description of the data (see Figure4(b)).
Figure3(c) shows dσ/dmγ−jet1; the measured cross section decreases by four orders of magnitude as mγ−jet1 increases from about 0.5 TeV to the highest measured value, ≈ 2.45 TeV. The experimental
uncertainty ranges from ≈ 3% to ≈ 22% and is dominated by the jet energy scale uncertainty in most of the measured range; for mγ−jet1 > 1.5 TeV the statistical uncertainty dominates. The NLO QCD calculation gives a good description of the data and no significant deviation from the prediction from pQCD is observed. The theoretical uncertainty is ≈ 10% (15%) at mγ−jet1 ≈ 490 (2450) GeV; it is dominated by the contribution arising from scale uncertainties, in particular from the variation of µR (≈ 10%), although for mγ−jet1 & 2.15 TeV the uncertainty from the PDF grows to be of the same order and dominates for higher mγ−jet1values. The predictions from Pythia and Sherpa give a good description of the data (see Figure4(c)), except for mγ−jet1 > 1.8 TeV where, nevertheless, the differences are covered by the theoretical uncertainties.
The measured cross-section dσ/d| cos θ∗|, shown in Figure 3(d), increases as | cos θ∗| increases. The experimental uncertainty is ≈ 3%; the only significant contributions arise from the photon and jet energy scale uncertainties and the model dependence. The NLO QCD prediction gives a good description of the data. The theoretical uncertainty is ≈ 10%, dominated by the contribution arising from scale uncertainties, in particular from the variation of µR. The predictions from Pythia and Sherpa give a good description of the data (see Figure4(d)).
To gain further insight into the dynamics of the photon–jet system, cross sections are measured as func-tions of | cos θ∗| in different regions of mγ−jet1. Figure5 shows the measured cross sections and NLO QCD predictions in nine regions of mγ−jet1. The NLO QCD predictions describe well the scale evolution of the measured cross sections. The LO QCD predictions of the direct and fragmentation contributions to the cross section are compared with the measurements in Figure6. Even though at NLO the two com-ponents are no longer distinguishable, the LO calculations are useful in illustrating the basic differences in the dynamics of the two processes. The contribution from fragmentation shows a steeper increase as | cos θ∗| → 1 than that from direct processes. This different behaviour is due to the different spin of the exchanged particle dominating each of the processes: a quark in the case of direct processes and a gluon in the case of fragmentation processes. The shape of the measured cross-section dσ/d| cos θ∗| is much closer to that of the direct-photon processes than that of fragmentation in all mγ−jet1 regions. This is consistent with the dominance of processes in which the exchanged particle is a quark. The predictions4 from Pythia and Sherpa are compared with the data in Figure7and also give an adequate description of the measurements.
[pb/GeV] γ T /dE σd 5 − 10 4 − 10 3 − 10 2 − 10 1 − 10 1 ATLAS -1 = 8 TeV, 20.2 fb s Data NLO QCD (JETPHOX, D+F) > 100 GeV jet1 T p + jet + X γ → pp
[GeV]
γ TE
200 300 400 500 600 1000 NLO/Data 0.6 0.8 1 1.2 1.4 [pb/GeV] jet1 T /dp σd 4 − 10 3 − 10 2 − 10 1 − 10 1 ATLAS -1 = 8 TeV, 20.2 fb s Data NLO QCD (JETPHOX, D+F) > 130 GeV γ T E + jet + X γ → pp[GeV]
jet1 Tp
200 300 400 500 1000 NLO/Data 0.6 0.8 1 1.2 1.4 [pb/GeV] -jet1 γ /dm σd 5 − 10 4 − 10 3 − 10 2 − 10 1 − 10 ATLAS -1 = 8 TeV, 20.2 fb s Data NLO QCD (JETPHOX, D+F) *| < 0.83 θ |cos + jet + X γ → pp | < 2.37 jet1 +y γ η |[GeV]
-jet1 γm
500 600 700 800 1000 2000 NLO/Data 0.6 0.8 1 1.2 1.4 *| [pb] θ /d|cos σd 0 20 40 ATLAS -1 = 8 TeV, 20.2 fb s Data NLO QCD (JETPHOX, D+F) > 467 GeV -jet1 γ m + jet + X γ → pp | < 2.37 jet1 +y γ η |*|
θ
|cos
0 0.2 0.4 0.6 0.8 NLO/Data 0.6 0.8 1 1.2 1.4 (a) (b) (c) (d)Figure 3: Measured cross sections for isolated-photon plus one-jet production (dots) as functions of (a) EγT, (b) pjet1T , (c) mγ−jet1and (d) | cos θ∗|. The NLO QCD predictions from Jetphox corrected for hadronisation and underlying-event effects and using the CT10 PDF set (solid lines) are also shown. These predictions include direct and frag-mentation contributions (D+F). The bottom part of each figure shows the ratio of the NLO QCD prediction to the measured cross section. The inner (outer) error bars represent the statistical uncertainties (the statistical and sys-tematic uncertainties added in quadrature) and the shaded band represents the theoretical uncertainty. For most of the points, the inner error bars are smaller than the marker size and, thus, not visible. The cross sections in (c) and (d) include additional requirements on |ηγ+ yjet1|, | cos θ∗| and mγ−jet1(see Table1).
[pb/GeV] γ T /dE σd 5 − 10 4 − 10 3 − 10 2 − 10 1 − 10 1 ATLAS -1 = 8 TeV, 20.2 fb s Data SHERPA (x1.0) PYTHIA (x1.1) > 100 GeV jet1 T p + jet + X γ → pp
[GeV]
γ TE
200 300 400 500 600 1000 MC/Data 0.6 0.8 1 1.2 1.4 [pb/GeV] jet1 T /dp σd 4 − 10 3 − 10 2 − 10 1 − 10 1 ATLAS -1 = 8 TeV, 20.2 fb s Data SHERPA (x1.0) PYTHIA (x1.1) > 130 GeV γ T E + jet + X γ → pp[GeV]
jet1 Tp
200 300 400 500 1000 MC/Data 0.6 0.8 1 1.2 1.4 [pb/GeV] -jet1 γ /dm σ d 5 − 10 4 − 10 3 − 10 2 − 10 1 − 10 ATLAS -1 = 8 TeV, 20.2 fb s Data SHERPA (x1.0) PYTHIA (x1.2) *| < 0.83 θ |cos + jet + X γ → pp | < 2.37 jet1 +y γ η |[GeV]
-jet1 γm
500 600 700 800 1000 2000 MC/Data 0.6 0.8 1 1.2 1.4 *| [pb] θ /d|cos σd 0 20 40 ATLAS -1 = 8 TeV, 20.2 fb s Data SHERPA (x1.0) PYTHIA (x1.2) > 467 GeV -jet1 γ m + jet + X γ → pp | < 2.37 jet1 +y γ η |*|
θ
|cos
0 0.2 0.4 0.6 0.8 MC/Data 0.6 0.8 1 1.2 1.4 (a) (b) (c) (d)Figure 4: Measured cross sections for isolated-photon plus one-jet production (dots) as functions of (a) EγT, (b) pjet1T , (c) mγ−jet1and (d) | cos θ∗|, presented in Figure3. For comparison, the predictions from Sherpa (solid lines) and Py-thia (dashed lines) normalised to the integrated measured cross sections (using the factors indicated in parentheses) are also shown. The bottom part of each figure shows the ratios of the MC predictions to the measured cross section. The inner (outer) error bars represent the statistical uncertainties (the statistical and systematic uncertainties added in quadrature). For most of the points, the inner error bars are smaller than the marker size and, thus, not visible. The cross sections in (c) and (d) include additional requirements on |ηγ+ yjet1|, | cos θ∗| and mγ−jet1(see Table1).
*| θ |cos 0 0.2 0.4 0.6 0.8 Data (x2.5) NLO QCD (x2.5) < 2.45 TeV -jet1 γ 1.25 < m *| θ |cos 0 0.2 0.4 0.6 0.8 Data (x1.25) NLO QCD (x1.25) < 1.25 TeV -jet1 γ 1.05 < m *| θ |cos 0 0.2 0.4 0.6 0.8 *| [pb] θ /d|cos σ d 0 0.5 1 Data (x1) NLO QCD (x1) < 1.05 TeV -jet1 γ 0.95 < m Data (x3) NLO QCD (x3) < 950 GeV -jet1 γ 850 < m Data (x2) NLO QCD (x2) < 850 GeV -jet1 γ 760 < m *| [pb] θ /d|cos σ d 0 2 4 6 8 Data (x1) NLO QCD (x1) < 760 GeV -jet1 γ 670 < m Data (x2) NLO QCD (x2) < 670 GeV -jet1 γ 590 < m Data (x1) NLO QCD (x1) < 590 GeV -jet1 γ 510 < m + jet + X γ → pp *| [pb] θ /d|cos σ d 0 10 20 ATLAS -1 = 8 TeV, 20.2 fb s (JETPHOX, D+F) | < 2.37 jet1 +y γ η | Data (x1) NLO QCD (x1) < 510 GeV -jet1 γ 467 < m
Figure 5: Measured cross sections for isolated-photon plus one-jet production (dots) as functions of | cos θ∗| in dif-ferent regions of mγ−jet1. The NLO QCD predictions from Jetphox corrected for hadronisation and underlying-event effects and using the CT10 PDF set (solid lines) are also shown. These predictions include direct and fragmentation contributions (D+F). The inner (outer) error bars represent the statistical uncertainties (the statistical and system-atic uncertainties added in quadrature) and the shaded band represents the theoretical uncertainty. For most of the points, the inner error bars are smaller than the marker size and, thus, not visible. For visibility, the measured and predicted cross sections are scaled by the factors indicated in parentheses.
*| θ |cos 0 0.2 0.4 0.6 0.8 Data (x2.5) LO QCD D (x4) LO QCD F (x210) < 2.45 TeV -jet1 γ 1.25 < m *| θ |cos 0 0.2 0.4 0.6 0.8 Data (x1.25) LO QCD D (x2) LO QCD F (x77) < 1.25 TeV -jet1 γ 1.05 < m *| θ |cos 0 0.2 0.4 0.6 0.8 *| [pb] θ /d|cos σ d 1 − 10 1 Data (x1) LO QCD D (x2) LO QCD F (x57) < 1.05 TeV -jet1 γ 0.95 < m Data (x3) LO QCD D (x6) LO QCD F (x140) < 950 GeV -jet1 γ 850 < m Data (x2) LO QCD D (x4) LO QCD F (x85) < 850 GeV -jet1 γ 760 < m *| [pb] θ /d|cos σ d 1 10 Data (x1) LO QCD D (x2) LO QCD F (x36) < 760 GeV -jet1 γ 670 < m Data (x2) LO QCD D (x4) LO QCD F (x66) < 670 GeV -jet1 γ 590 < m Data (x1) LO QCD D (x2) LO QCD F (x27) < 590 GeV -jet1 γ 510 < m + jet + X γ → pp *| [pb] θ /d|cos σ d 1 10 ATLAS -1 = 8 TeV, 20.2 fb s | < 2.37 jet1 +y γ η | Data (x1) LO QCD D (x2) LO QCD F (x24) < 510 GeV -jet1 γ 467 < m
Figure 6: Measured cross sections for isolated-photon plus one-jet production (dots) as functions of | cos θ∗| in different regions of mγ−jet1, presented in Figure5. For visibility, the measured cross sections are scaled by the factors indicated in parentheses. For comparison, the LO QCD predictions from Jetphox corrected for hadronisation and underlying-event effects and using the CT10 PDF set for direct (solid lines) and fragmentation (dashed lines) processes are shown separately. In each region of mγ−jet1, the predictions are normalised to the integrated measured cross section by the factors shown in parentheses, which include the visibility factor. The inner (outer) error bars represent the statistical uncertainties (the statistical and systematic uncertainties added in quadrature). For most of the points, the inner error bars are smaller than the marker size and, thus, not visible.
*| θ |cos 0 0.2 0.4 0.6 0.8 Data (x2.5) SHERPA (x2.5, x1) PYTHIA (x2.5, x1.2) < 2.45 TeV -jet1 γ 1.25 < m *| θ |cos 0 0.2 0.4 0.6 0.8 Data (x1.25) SHERPA (x1.25, x1) PYTHIA (x1.25, x1.2) < 1.25 TeV -jet1 γ 1.05 < m *| θ |cos 0 0.2 0.4 0.6 0.8 *| [pb] θ /d|cos σ d 0 0.5 1 Data (x1) SHERPA (x1, x1) PYTHIA (x1, x1.2) < 1.05 TeV -jet1 γ 0.95 < m Data (x3) SHERPA (x3, x1) PYTHIA (x3, x1.2) < 950 GeV -jet1 γ 850 < m Data (x2) SHERPA (x2, x1) PYTHIA (x2, x1.2) < 850 GeV -jet1 γ 760 < m *| [pb] θ /d|cos σ d 0 2 4 6 8 Data (x1) SHERPA (x1, x1) PYTHIA (x1, x1.2) < 760 GeV -jet1 γ 670 < m Data (x2) SHERPA (x2, x1) PYTHIA (x2, x1.2) < 670 GeV -jet1 γ 590 < m Data (x1) SHERPA (x1, x1) PYTHIA (x1, x1.2) < 590 GeV -jet1 γ 510 < m + jet + X γ → pp *| [pb] θ /d|cos σ d 0 10 20 ATLAS -1 = 8 TeV, 20.2 fb s | < 2.37 jet1 +y γ η | Data (x1) SHERPA (x1, x1) PYTHIA (x1, x1.2) < 510 GeV -jet1 γ 467 < m
Figure 7: Measured cross sections for isolated-photon plus one-jet production (dots) as functions of | cos θ∗| in different regions of mγ−jet1, presented in Figure5
. For comparison, the predictions from Sherpa (solid lines) and Pythia (dashed lines) are also shown; the predictions are normalised to the data by a global factor, which is shown as the second factor in parentheses. In addition, for visibility, the measured and predicted cross sections are scaled by the first factor indicated in parentheses. The inner (outer) error bars represent the statistical uncertainties (the statistical and systematic uncertainties added in quadrature). For most of the points, the inner error bars are smaller than the marker size and, thus, not visible.
9.3 Cross sections for isolated-photon plus two-jet production
The measured cross-section dσ/dEγT (Figure 8(a)) decreases by almost five orders of magnitude as ETγ increases over the measured range. Values of EγT up to 1.1 TeV are measured. The experimental uncer-tainty ranges from 7% to 23%, dominated at low EγTby the jet energy scale uncertainty and at high ETγby the statistical uncertainty. The NLO QCD prediction from Blackhat is compared with the measurement in Figure8(a). The NLO QCD prediction gives a good description of the data within the experimental and theoretical uncertainties for EγT < 750 GeV. The theoretical uncertainty amounts to ≈ 10%; it is dominated by the contribution arising from scale uncertainties, in particular from the variation of µRfor ETγ . 500 GeV, and by the uncertainty from the PDF for higher EγTvalues.
The measured cross-section dσ/dpjet2T (Figure8(b)) decreases by almost five orders of magnitude within the measured range. The experimental uncertainty varies from 6% to 46% and is dominated by the jet energy scale uncertainty at low pjet2T and by the statistical uncertainty at high pjet2T . The NLO QCD prediction gives a good description of the data. No significant deviation from the prediction from NLO QCD is observed up to the highest value measured of pjet2T ≈ 1 TeV. The theoretical uncertainty grows from 10% at pjet2T ∼ 70 GeV to ≈ 26% for pjet2T ∼ 1 TeV and is dominated by the variation of µR for pjet2T . 250 GeV and by the uncertainty from the PDF for higher ETγvalues.
The dσ/d∆φγ−jet2and dσ/d∆φjet1−jet2cross sections are shown in Figures8(c) and8(d), respectively. The measured cross sections display a maximum at 2–2.5 radians. The NLO QCD predictions give a good description of the data.
The prediction from Pythia gives a good description of the measured cross-section dσ/dETγ up to ETγ ∼ 750 GeV (see Figure9(a)), whereas the prediction from Sherpa describes well the measured cross-section dσ/dpjet2T (see Figure9(b)). The predictions from Sherpa give a good description of the measured cross-section dσ/d∆φγ−jet2and dσ/d∆φjet1−jet2, while the predictions from Pythia do not. In the predictions from Pythia a second jet can arise only from the parton shower, whereas in Sherpa, 2 → n (with n ≥ 3) matrix-element contributions are included as well, with a higher probability of producing a second hard jet.
The scale evolution of photon plus two-jet production is tested by measuring the azimuthal angle between jet2 and the photon or between jet2 and jet1 for EγT below/above 300 GeV. Figure10 shows the cross sections as functions of∆φγ−jet2and∆φjet1−jet2for the two EγTranges: both cross-section distributions have different shapes for EγT below/above 300 GeV. The dσ/d∆φγ−jet2cross section is more peaked towards large values of∆φγ−jet2for EγT > 300 GeV than that for ETγ < 300 GeV; the dσ/d∆φjet1−jet2cross section peaks at∆φjet1−jet2 ∼ 0.8 rad (2.2 rad) for ETγ > 300 GeV (EγT < 300 GeV). The NLO QCD predictions give a good description of the data and, in particular, reproduce the scale evolution of the measured cross sections. Figure11shows the comparison of the data and the predictions from Pythia and Sherpa. The predictions from Pythia fail to describe the data whereas those from Sherpa describe well the shape of the measured cross-section distributions and their evolution with the scale.