Publisher’s version / Version de l'éditeur:
Vous avez des questions? Nous pouvons vous aider. Pour communiquer directement avec un auteur, consultez la première page de la revue dans laquelle son article a été publié afin de trouver ses coordonnées. Si vous n’arrivez pas à les repérer, communiquez avec nous à PublicationsArchive-ArchivesPublications@nrc-cnrc.gc.ca.
Questions? Contact the NRC Publications Archive team at
PublicationsArchive-ArchivesPublications@nrc-cnrc.gc.ca. If you wish to email the authors directly, please see the first page of the publication for their contact information.
https://publications-cnrc.canada.ca/fra/droits
L’accès à ce site Web et l’utilisation de son contenu sont assujettis aux conditions présentées dans le site LISEZ CES CONDITIONS ATTENTIVEMENT AVANT D’UTILISER CE SITE WEB.
Langmuir, 29, 1, pp. 221-227, 2012-12-07
READ THESE TERMS AND CONDITIONS CAREFULLY BEFORE USING THIS WEBSITE.
https://nrc-publications.canada.ca/eng/copyright
NRC Publications Archive Record / Notice des Archives des publications du CNRC :
https://nrc-publications.canada.ca/eng/view/object/?id=04c91300-11c2-4777-a6b6-5e96bb9dd9f2 https://publications-cnrc.canada.ca/fra/voir/objet/?id=04c91300-11c2-4777-a6b6-5e96bb9dd9f2
NRC Publications Archive
Archives des publications du CNRC
This publication could be one of several versions: author’s original, accepted manuscript or the publisher’s version. / La version de cette publication peut être l’une des suivantes : la version prépublication de l’auteur, la version acceptée du manuscrit ou la version de l’éditeur.
For the publisher’s version, please access the DOI link below./ Pour consulter la version de l’éditeur, utilisez le lien DOI ci-dessous.
https://doi.org/10.1021/la3040424
Access and use of this website and the material on it are subject to the Terms and Conditions set forth at
Lipid reassembly in asymmetric Langmuir-Blodgett/Langmuir-Schaeffer
bilayers
Lipid Reassembly in Asymmetric Langmuir−Blodgett/Langmuir−
Schaeffer Bilayers
Jie Yuan,
†,‡Changchun Hao,
†,⊥Maohui Chen,
†Pierre Berini,
§,∥and Shan Zou*
,††
National Research Council of Canada, 100 Sussex Drive, Ottawa, Ontario, K1A 0R6, Canada ‡
Department of Chemical and Biological Engineering,§
Department of Physics, and∥School of Electrical Engineering and Computer Science, University of Ottawa, Ottawa, Ontario, K1N 6N5, Canada
⊥
College of Physics and Information Technology, ShaanXi Normal University, Xi’an, China
*
S Supporting InformationABSTRACT: Molecular-reorganization-induced morphology alteration in asymmetric substrate-supported lipid bilayers (SLBs) was directly visualized by means of atomic force microscopy (AFM) and total internal reflection fluorescence (TIRF) microscopy. SLB samples were fabricated on
mica-on-glass and mica-on-glass substrates by Langmuir−Blodgett (LB)/Langmuir−Schaeffer (LS) using binary lipid mixtures, namely, 1,2-dioleoyl-sn-glycero-3-phosphocholine (DOPC)/1,2-dipalmitoyl-sn-glycero-3-phosphocholine (DPPC) and ternary mixtures DOPC/DPPC/1,2-dioleoyl-sn-glycero-3-phospho-L-serine (DOPS), labeled with 0.2 mol % Texas Red 1,2-dihexadecanoyl-sn-glycero-3-phosphoethanolamine triethylammonium salt (TR-DHPE) dye. Phase segregations were characterized by TIRF imaging, and DPPC-enriched domain structures were also observed. Interestingly for ∼40% (n = 6) of the samples with binary mixtures in the LB leaflet and a single component in the LS leaflet, that is, (DOPC/DPPC)LB+DOPCLS, the contrast of the DPPC domains changed from the original dark (without dye) to bright (more TR dye partitioning) on TIRF images, returning to dark again. This contrast reverse was also correlated to AFM height images, where a DPPC−DPPC gel phase was spotted after the TIRF image contrast returned to dark. The rupture force mapping results measured on these binary mixture samples also confirmed unambiguously the formation of DPPC−DPPC gel domain components during the contrast change. The samples were tracked over 48 h to investigate the lipid molecule movements in both the DPPC domains and the DOPC fluid phase. The fluorescence contrast changes from bright to dark in SLBs indicate that the movement of dye molecules was independent of the movement of lipid molecules. In addition, correlated multimodal imaging using AFM, force mapping, and fluorescence provides a novel route to uncover the reorganization of lipid molecules at the solid−liquid interface, suggesting that the dynamics of dye molecules is highly structure dependent.
■
INTRODUCTIONThe asymmetric distribution of phospholipid among the two leaflets of membrane bilayers is an important feature of cell membranes that represents the heterogeneity of the intra-cellular membrane and its life span.1,2It is the major premise of cell membrane functions, such as signaling and cargo traffic.3−5 However, it is still not well understood how cell membranes control the environmental conditions in their neighborhood, such as charge density, ionic strength, and so forth, to maintain the asymmetric structures and microdomain shape transition.6 As a model system, two-component (or more) lipid mixtures have often been selected to mimic the formation of cell membranes in order to understand the membrane restructur-ing. Although cell membrane structures are highly simplified in model lipid bilayers, the model system mimics the cell membrane behavior subject to tunable environment conditions. For example, using a series of lipid bilayer systems, Kornberg and McConnel have evaluated the phospholipid flip-flop rate, which was considered as the key motion required to transport ions and molecules through cell membranes.2 Carafoli has reported intracellular calcium homeostasis, which influences one of the important functions of cell membranes: singaling.7
Denicourt and co-workers have demonstrated the phase transition of a single phospholipid monolayer on air and sodium chloride interfaces and measured the influence of ionic strength.8 Transferring the monolayer of binary mixture from air/aqueous interfaces to mica, Hollars and Dunn have characterized the convolution of phase structure in solid-supported lipid bilayers (SLBs) by using atomic force microscopy (AFM).9 Since then, modular membrane systems such as SLBs have been extensively used in understanding the fundamental properties of heterogeneity in biological mem-branes.10,11 These model systems have successfully demon-strated the coexistence of ordered and disordered phases for a variety of different lipid compositions on mica. In addition, free-standing membranes such as giant unilamellar vesicles (GUVs) were used to reveal the correlation between the phase transition behavior and the binary phospholipid mixture composition, experimentally and theoritically.12−14 Bagatolli and Gratton have successfully captured the formation of
Received: October 11, 2012
Revised: November 30, 2012
Published: December 7, 2012
pubs.acs.org/Langmuir
Published 2012 by the American Chemical Downloaded via NATL RESEARCH COUNCIL CANADA on March 13, 2019 at 14:45:05 (UTC). See https://pubs.acs.org/sharingguidelines for options on how to legitimately share published articles.
microdomains by using fluorescence probes.12Bernchou et al. have reported on microdomain shape and the spatial position of coexisting phases in lipid bilayers with binary mixtures using combined AFM and correlated fluorescence imaging.15 Most recently, Lin et al. have reported phase transitions in asymmetric SLBs on mica.10 The microdomain structure convolution in both the longitudinal and transverse directions was evidenced by AFM topographies and correlated fluorescence images.10 There were some reports on the mechanism of transmembrane symmetry in ordered phases in SLBs;16,17 however, as of yet, no direct evidence has been reported on the mechanical stability of asymmetric lipid bilayers evolving to symmetric ones.18
In this work, we study the molecular motion of the phases that coexist in lipid bilayers by integrating AFM with fluorescence imaging and force mapping. Binary mixtures (DOPC/DPPC) and ternary mixtures (DOPC/DPPC/DOPS) with a series of compositions have been studied, from complete DOPC−DPPC asymmetric structures to complete DOPC− DOPC and DPPC−DPPC symmetric structures and further to complex structures in ternary lipid mixture systems. Consider-ing the influence of surface charge density, mica (charged surface) and glass (less or noncharged surface) have been used as supporting substrates in our experiments. The movement of lipid molecules on lower and upper leaflets has been extensively investigated to understand the organization and reorganization of the lipid structure. Mechanical properties, molecule− molecule interactions, and molecule−substrate interactions were also investigated by means of force mapping and correlation with other imaging results. We also discuss changes in the distribution of fluorescence probes during microdomain structure transitions.
■
EXPERIMENTAL SECTIONMaterials. 1,2-Dioleoyl-sn-glycero-3-phosphocholine (DOPC), 1,2-dioleoyl-sn-glycero-3-phospho-L-serine (DOPS), and
1,2-dipalmi-toyl-sn-glycero-3-phosphocholine (DPPC) were purchased from Avanti Polar Lipids (Alabaster, AL) and used as received. Texas Red 1,2-dihexadecanoyl-sn-glycero-3-phosphoethanolamine triethylammo-nium salt (TR-DHPE) was bought from Invitrogen Canada (Burlington, ON, Canada). HPLC-grade chloroform from ACP Chemicals Inc. (Montreal, QC), ACS grade methanol from Fisher Scientific (Ottawa, ON), and Milli-Q water deionized to a resistivity of 18 MΩ·cm were used in all of the experiments.
LB/LS Bilayer Preparation.Langmuir−Blodgett (LB) layers were prepared on a trough (NIMA 611, Coventry, UK) using Milli-Q water as the subphase. Lipids or lipid mixtures with certain components were dissolved in chloroform to make a 1 mg/mL lipid solution. The solutions were spread on the subphase surface, and the solvent was allowed to evaporate for 15 min. The monolayers were compressed at a 20 cm2/min rate to the required surface pressure. The surface
pressure was measured with a precision of 0.1 mN/m by using a Wilhelmy balance. Monolayers were expanded and recompressed twice before transferring to substrates by vertical deposition at a dipping speed of 5 mm/min. In the experiments, all the monolayers were deposited at a pressure of 30 mN/m. The monolayer (LB layer) was dried in air.
The second layer was deposited by the Langmuir−Schaeffer (LS) technique. Lipid solutions for the second monolayer were spread and compressed in the same fashion as the ones for LB layers. The LB-coated substrate was then rotated to the horizontal position, attached to a suction head, and lowered through the interface.
Freshly cleaved mica substrates (20−30 μm thick) glued on glass coverslips (noted as mica-on-glass, in short mica) or piranha cleaned glass coverslips (in short, glass) were used in our experiments. These
substrates could be affixed to a liquid cell, and the resulting bilayers were kept under water, during the transfer and imaging measurements. Single Component or Binary Mixtures. DOPC, DPPC, or a binary mixture of DOPC/DPPC (1:1) were dissolved in chloroform to make 1 mg/mL solutions. The combinations of LB/LS structures formed are listed in Table 1.
Ternary Mixtures.DOPC or DOPC/DPPC/DOPS (2:1:1; 3:3:1; 5:3:1) were dissolved in chloroform to make 1 mg/mL solutions. The combinations of LB/LS structures formed are listed in Table 2.
AFM Imaging, Force Mapping, and Fluorescence Micros-copy Measurements.Correlated images were recorded by using a JPK NanoWizard II BioAFM (JPK Instruments, Berlin, Germany) integrated with an inverted microscope (Olympus IX81, Olympus, Tokyo, Japan) with objective-based total internal reflection fluo-rescence (TIRF) optics. This ensemble was contained in an acoustic isolation box fabricated in-house and seated on a Micro 60 active vibration isolation table (Halcyonics/Accurion GmbH, Goettingen, Germany). TR-DHPE was excited by a 543 nm He−Ne laser (Melles Griot, Carlsbad, CA), and the laser beam was focused on the sample by means of an oil-immersion objective (PlanApo N, 60×, Korr, NA = 1.45, Olympus). The emission fluorescence light filtered by the Texas Red filter (595 ± 30 nm) was collected using a CCD camera (Cascade 512B, Photometrics, USA). The size of the excitation spot at the objective could be adjusted using a manually operated micrometer screw to reposition the focusing lens in the illuminator. A second micrometer allowed radial translation of the focused laser beam from the center of the objective aperture (epifluorescence mode) toward its edge in order to achieve TIR (TIRF mode). For an initial comparison of the effects of laser excitation, images were recorded in both TIRF and epifluorescence geometries.
AFM was performed in contact mode, and images were captured using DNP-S (Veeco/Bruker, CA) cantilever/tips with nominal spring constants of 0.06 N/m. The applied forces in all AFM imaging
Table 1. Asymmetric Lipid Bilayers on Mica with Binary Componentsa
bilayer structure LB layer LS layer (original)TR (DOPC/ DPPC)LB+DOPCLS TR, DOPC/DPPC (1:1) DOPC LB (DOPC/ DPPC)LB+DPPCLS TR, DOPC/DPPC (1:1) DPPC LB DOPCLB+(DOPC/ DPPC)LS DOPC TR, DOPC/ DPPC (1:1) LS DPPCLB+(DOPC/ DPPC)LS DPPC TR, DOPC/ DPPC (1:1) LS
a0.2 mol % of TR-DHPE was added to the binary mixture as indicated.
Table 2. Asymmetric Lipid Bilayers on Glass with Ternary/ Binary Componentsa
bilayer structure LB layer LS layer TR (DOPC/DPPC/ DOPS)LB+DOPCLS TR, DOPC/ DPPC/DOPS (2:2:1) DOPC LB (DOPC/DPPC/ DOPS)LB+DOPCLS TR, DOPC/ DPPC/DOPS (3:3:1) DOPC LB (DOPC/DPPC/ DOPS)LB+DOPCLS TR, DOPC/ DPPC/DOPS (5:3:1) DOPC LB DOPCLB+(DOPC/DPPC/ DOPS)LS DOPC TR, DOPC/ DPPC/DOPS (2:2:1) LS DPPCLB+(DOPC/ DPPC)LS DPPC TR, DOPC/DPPC (1:1) LS
a0.2 mol % of TR-DHPE was added to the mixture as indicated.
Langmuir Article
dx.doi.org/10.1021/la3040424 | Langmuir 2013, 29, 221−227
measurements ranged from 0.4 to 3.5 nN. In force mapping, a set of force−distance curves were collected over an area of a bilayer sample. This area is first divided into a grid pattern (e.g., 64 pixels × 64 pixels); then, the scanner performs a single force spectroscopy scan at the center of every pixel at a scan rate of 2000 nm/s. In each force cycle, extension and retraction force−distance curves were collected. Two-dimensional visual maps were reconstructed from 64 × 64 or 32 × 32 grids, over an area up to a maximum of 5 × 5 μm2. An applied load in
the range 15−30 nN was used. Bilayer samples were characterized in Milli-Q water, and monolayer samples were characterized in air via AFM, fluorescence imaging, and force mapping.
■
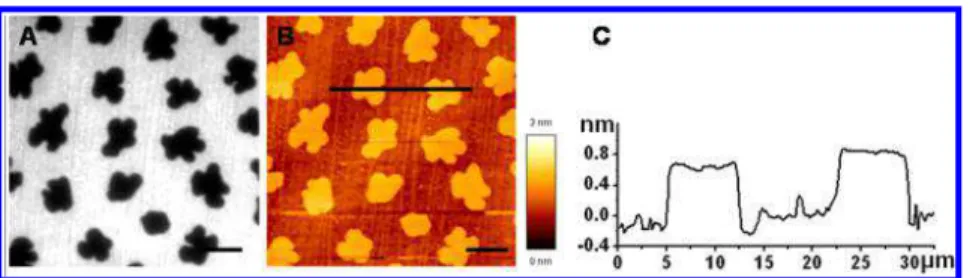
RESULTS AND DISCUSSIONSLB Monolayers of DOPC/DPPC. Correlated AFM and fluorescence imaging was employed to examine the LB monolayers formed from a 1:1 molar ratio solution of DOPC/DPPC with 0.2 mol % TR-DHPE, transferred on a mica-on-glass surface at 30 mN/m. The AFM height images and the corresponding fluorescence images of the monolayer are shown in Figure 1. Phase-segregated domains were observed in both the fluorescence and AFM topography images, as suggested by the additive rule19considering the gel-to-fluid phase transition temperatures of 41 and −21 °C for DPPC and DOPC, respectively. The dark domains embedded in the TR-DHPE-labeled DOPC matrix are clearly observed in the fluorescence image (Figure 1A); in the correlated AFM
height image (Figure 1B), the domains are displayed 0.8 ± 0.2 nm taller than the DOPC phases, as shown in the profile plot (Figure 1C). The height difference is consistent with other reports on coexisting DPPC domains and DOPC matrix in LB monolayers.20The monolayer of DOPC/DPPC shows flower-shaped, DPPC-enriched domains, which are believed to be regulated by the spatial distribution of the nucleation points.15,21
Asymmetrical LB/LS Bilayers Composed of (DOPC/ DPPC)LB+DOPCLSversus (DOPC/DPPC)LB+DPPCLS. A layer of pure DOPC was deposited by the LS method on a DOPC/ DPPC (1:1) LB monolayer on mica. Flower-shaped DPPC domains surrounded by the DOPC phase were maintained after the LS deposition, labeled as (DOPCTR/DPPC)LB+DOPCLS. Correlated AFM and fluorescence images on freshly prepared LB/LS samples and after 3 h in water are shown in Figure 2. The height difference between the taller domains and the surroundings was measured as 1.6 ± 0.4 nm, suggesting the geometric structure at the initial state illustrated in Figure 2G. Symmetric fluidic-phase DOPC (labeled as DOPCLS− DOPCLB) and asymmetric fluidic-phase DOPC on gel-like phase DPPC (labeled as DOPCLS−DPPCLB) coexist in the bilayer system. Here, the phase of the top LS leaflet was not matched perfectly to the bottom LB leaflet such that two different geometries are contained in the phase segregated
Figure 1.Morphology images of a DOPC/DPPC (1:1) monolayer with 0.2% TR-DHPE dye. (A) Fluorescence image, (B) correlated AFM height image, and (C) corresponding height profile. The scale bars are 10 μm.
Figure 2.Correlated fluorescence and AFM images of bilayer samples constructed by a LB layer of DOPC/DPPC (1:1) plus a LS layer of DOPC. (A) Fluorescence image of freshly prepared bilayer, (B) correlated AFM height image, and (C) corresponding height profile. (D) Fluorescence image of bilayer sample after 3 h in water, (E) correlated AFM height image, and (F) corresponding height profile. (G) Schemes of freshly prepared bilayer and (H) sample after 3 h. The scale bars are 10 μm.
SLB.9,10,22The height difference of 1.6 nm is greater than what others have reported.10This is possibly due to different loading forces that could affect the height values in the AFM measurements. It is worth noting that the outlines of the domains are still sharp after the deposition of the DOPCLS layer, suggesting the LS layer has no major effects on the phase segregation of the LB monolayer. The contrast in the domain areas turned bright when DOPC was deposited, indicating that TR-DHPE dye moved into these DPPC-covered areas. This contrast change from monolayer to bilayer is surprising because TR-DHPE dye is supposed to be incorporated favorably into the DOPC phase. Over time, the contrast of the domains gradually changed from bright to dark as observed in fluorescence images. AFM images reveal three levels (Figure 2D) of height difference, namely, 1.6 ± 0.4 and 3.2 ± 0.4 nm, relative to the lowest level. The relative height between two phases increased by ∼1.6 nm, suggesting a DPPC−DPPC phase separated from the domains of DOPCLS−DPPCLB. By correlating the height contrast and the fluorescence contrast (Supporting Information, Figure S1), it is reasonable to suggest that some DPPCLBmolecules flipped from the bottom leaflet to the top leaflet, diffused laterally, and were located on top of the other DPPCLB molecules to achieve a relatively stable symmetric structure.23−25 Figure 2H schematically illustrates these three different structures. Also, DOPCLS−DOPCLB, DOPCLS−DPPCLB, and symmetric DPPCLS−DPPCLB gel phases were generated. This lipid reassembly motion was rapid over the initial 2 h and then slowed down gradually. After 3 h, most of the domains turned dark and became taller in height. The contrast reverse and height increase were observed on 6 out of 14 samples. Only dark domains and height increases were captured on the other eight samples.
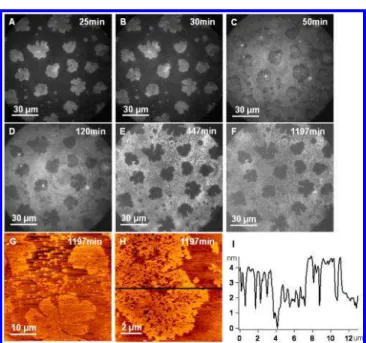
Since only 40% of the samples on mica displayed fluorescence contrast inversion, it is surmised that the surface charge density of mica influences the lipid molecular movement (Figure 2 and Figure S2 of the Supporting Information). In order to verify the effect of the surface charge density, samples using the same composition and deposition method were fabricated on bare glass and observed by fluorescence imaging for 19 h. The contrast in the domain areas turned bright when DOPC was deposited via LS (as seen on 40% of the samples on mica). On the fluorescence images (Figure 3A−F), all of the domains turned from bright to dark at the end of the imaging measurements. Two heights, 2.0 ± 0.4 and 4.5 ± 0.5 nm, were observed in the flower-shaped domains on AFM height images, indicating the formation of the symmetric DPPC gel phase. However, clear and sharp domain boundaries were maintained. This suggest that the lateral interaction between DOPC and DPPC at boundaries and the vertical interaction between the substrate and the DPPC have both affected the flip-flop of DPPC molecules and their lateral diffusion such that less and smaller defects were generated near boundaries.
Similar to the 40% samples on mica, instead of the dye-excluded darker domains observed in the case of the monolayer (Figure 1A), brighter flowerlike DPPC domains were observed in the fluorescence images of Figure 3A−F after deposition of the DOPC LS layer. This reversal of contrast indicates that TR-DHPE has accumulated in the initial asymmetric DOPCLS− DPPCLBstructures. Two hypotheses are formulated to explain this unusual phenomenon of fluorescence contrast reverse: (I) The TR-DHPE molecules were carried or motivated by lipid molecules. This hypothesis is based on the molecular size, weight, and motion. Since TR-DHPE has a huge headgroup
and a large molecular weight (1381.85 g/mol), it is not easy for TR-DHPE to spontaneously flip-flop or diffuse laterally in a lipid bilayer. On one hand, the flip-flop and lateral diffusion of DOPC molecules in the fluidic phase is very rapid. It is reasonable to consider that the heavy TR-DHPE molecules were pushed or motivated synchronously by the more mobile DOPC molecules.8,24It should be emphasized that DOPC was considered to be kept in the fluidic phase at room temperature for all samples. Since the TR-DHPE molecules were assumed synchronous to DOPC, the TR-DHPE distribution rapidly achieved a homogeneous distribution in the DOPC fluidic phase in both the LB and LS leaflets. On the other hand, molecular motion in gel-like DPPC was strongly suppressed such that flip-flop and lateral diffusion of DPPC molecules were much slower than those of DOPC.8Therefore, the TR-DHPE molecules inside the DPPC domains could not redistribute as quickly as those in the DOPC matrix, so it is possible to trap TR-DHPE and maintain its density within the DPPC domains constant for a short time. It should be noted that the contrast reverse phenomena were observed on both TIRF and epi-fluorescence images; thus, it is not the decay of the evanescent field that had resulted in the contrast reverse in the TIRF imaging results on different bilayer samples.
A simple scheme (Figure 4A) illustrates hypothesis I for generating fluorescence contrast reversal. TR-DHPE molecules are carried by lipid molecules leading to dye redistribution. Because DPPC molecules move much slower than DOPC, by the time TR-DHPE in the DOPC fluidic phase reaches a new balance, the TR-DHPE distribution in the DPPC gel-like phase remained constant. So, it is possible that more TR-DHPE accumulates in DOPCLS−DPPCLB structures than in DOPCLS−DOPCLB structures. Based on this assertion, the fluorescence contrast reversal phenomenon could occur if the TR-DHPE initial distribution in the DOPC/DPPC (1:1) monolayer satisfies eq 1:
Figure 3.Correlated fluorescence and AFM images of bilayer samples on glass constructed by a monolayer of DOPC/DPPC (1:1) followed by a second LS layer of DOPC. (A−F) Fluorescence images reveal fluorescence contrast changes over time. (G, H) AFM height images and (I) the height profile were taken at 1197 min.
Langmuir Article
dx.doi.org/10.1021/la3040424 | Langmuir 2013, 29, 221−227
<
a b
1
3 (1)
where a and b represent the initial mole number of TR-DHPE in DOPCLB and in the DPPCLB monolayer, respectively. Theoretically, more than 25% TR-DHPE (critical ratio) has to be in the DPPC domains in the monolayer to cause the fluorescence contrast reversal. For a visible fluorescence difference, as shown in Figures 2B and 3A, the initial ratio of TR-DHPE between DPPC and DOPC must be around 2:3. However, the initial ratio of TR-DHPE between DPPC and DOPC in the monolayer on glass was at least 1:11 (the TR-DHPE participation ratio between DPPC and DOPC was almost 1:60, as shown in Figure S6 of the Supporting Information), which was much smaller than the critical ratio. The TR-DHPE ratio in the monolayer is consistent with other reports that TR-DHPE is a fluidic-phase probe, so that it is
likely partitioned in the fluidic phase (DOPC) rather than in the gel phase (DPPC).26Therefore, based on the scenario of hypothesis I, the sample (Figure 3) should not show fluorescence contrast reversal, as demonstrated in Figure 4B. This conflict indicates that hypothesis I is unlikely to be a proper explanation for the contrast change. However, this somewhat backs up the fact that, for 60% of the samples (Supporting Information, Figure S2), we did not observe contrast reversal.
The other hypothesis II considers that the TR-DHPE molecules laterally diffuse independently to the lipid molecular motion. The scenario of hypothesis II is illustrated in Figure 4C. Here, TR-DHPE moves freely in the bilayer. Its distribution is determined by the affinity between dye molecules and lipid molecules. Since TR-DHPE likes to be in the fluidic DOPC phase, a proportion of TR-DHPE in the gel
Figure 4.Schematic illustrations of hypotheses I (A and B) and II (C). (A) Fluorescence contrast reversal occurs if the initial TR-DHPE distribution in the monolayer satisfies a/3 < b. (B) Fluorescence contrast reversal does not occur if the initial TR-DHPE distribution in the monolayer satisfies a ≫ b. (C) Under the condition of B, fluorescence contrast reversal does not occur if the TR-DHPE in DPPC gel domains participate in redistribution. (n: molar number of DOPC and DPPC lipid molecules; a: initial molar number of TR-DHPE participating in the DOPC complex; b: initial molar number of TR-DHPE probed in DPPC gel domains).
Figure 5.Force analysis of asymmetric lipid bilayers fabricated by a DOPC/DPPC (1:1) with 0.2 mol % TR-DHPE in a LB layer and DOPC in a LS layer (sample prepared on mica). (A−C) Rupture force maps, (D, E) Young’s modulus maps, (F) topography of the same area, (G, H) schemes of A and B, respectively, and (I) the histogram of the breakthrough force distribution in C.
phase DPPC moves to DOPC after fabrication of the LS layer in order to balance the same participation probability between DOPC and DPPC. The mole number of TR-DHPE transferred from DPPC to DOPC (x) is given by
= + x ab a b 2 3 (2)
Since both a and b are positive values, x must be greater than 0. Thus, the TR-DHPE density in the DPPC phase was decreased by the deposition of the LS layer. Under this hypothesis, if we consider the TR-DHPE affinity with lipid molecules based on both phase difference and partitioning in the most asymmetric structures, the affinity of TR-DHPE to lipid bilayer structures then follows the order depicted in eq 3. Assuming structure-dependent affinity and TR-DHPE free movement, the TR-DHPE molecules like to stay in the most asymmetric structure of DOPCLS−DPPCLB. Therefore, it is possible for TR-DHPE molecules to move and accumulate in the DOPCLS−DPPCLB covered space such that fluorescence contrast reversal then occurred:
− > − > −
DOPC DPPC DOPC DOPC DPPC DPPC
LS LB LS LB
LS LB (3)
More support for the reassembly of DPPC lipids is obtained from rupture force maps and Young’s modulus maps on the lipid bilayer, as shown in Figure 5. Both maps reveal that DOPC/DPPC and DOPC/DOPC are similar except near boundaries between fluid DOPC−DOPC and gel-like DOPC− DPPC phases and both are distinguished from DPPC/DPPC gel domains. Thus, there is no significant difference of the DOPC layers either on DOPC or DPPC. It is now confirmed that the increase of height inside the domain areas (Figure 5F) and the contrast reverse (Figures 2 and 3) are likely due to the combination of the flip-flop of DPPC, DOPC lipids, the lateral reorganization of DPPC gel-like subdomains, and the distribution of TR-DHPE dye molecules in the lipid bilayer systems on solid supports.
Other Asymmetric LB/LS Bilayers. In order to fully understand the features of asymmetric lipid bilayers on a solid support, different asymmetric structure combinations were tested, as shown in Tables 1 and 2. The DOPC/DPPC (1:1) was fabricated as the upper leaflet and DOPC as the bottom leaflet. In 15 min, 67% of the DPPC flip-flopped and diffused laterally to reach a symmetric DPPCLB−DPPCLS structure. It was very clear that DPPC diffused much more rapidly than when it contacted the substrate (compared to Figure 2). Thus, the interaction between lipid molecules and the substrate is not negligible. Figure 6A shows the topography of the bilayer of DOPCLB+DOPC/DPPCLS. As displayed in the height profile,
the two domains had heights of 0.9 ± 0.4 and 2.1 ± 0.2 nm, corresponding to DOPCLB−DPPCLS and DPPCLB−DPPCLS domains, respectively. Also, as shown in Figure 6B, fluorescence contrast reversal was captured such that TR-DHPE diffused faster than the previous estimation. Other LB/LS samples with the same compositions showed similar results (Supporting Information, Figures S2 and S3). Neither (DOPC/ DPPC)LB+DPPCLS (Supporting Information, Figure S4) nor DPPCLB+(DOPC/DPPC)LS (Supporting Information, Figure S5) combinations displayed clear fluorescence contrast reversal because there was no DOPCLB−DOPCLSsymmetric structure at the initial stage. However, AFM topography showed that there were small DPPCLB−DPPCLSislands between DPPCLB− DPPCLS flower-shaped domains. When the third lipid was added in the system (DOPS), the time required to form stable asymmetric structures was prolonged (up to 24 h). Also, fluorescence contrast reversal was spotted during the experi-ments with the ternary system, and up to four fluorescence contrasts were obtained (images not shown).
■
CONCLUSIONIn asymmetry bilayers, it was found that the lipid molecules on the bottom leaflet flip-flopped to the upper leaflet, as evidenced by fluorescence contrast reversal and height changes in DPPC-enriched domains. The lateral diffusion of lipid molecules was found to occur more slowly in the bottom leaflet than in the upper leaflet, indicating that interaction between the lipids and the solid support may trap the molecules on the substrate surface. This interaction prolongs the time required for structure transformation from asymmetric DOPCLS−DPPCLB to symmetric DPPCLS−DPPCLB (up to 20 h), especially for DPPC lipids in the gel phase. Switching the mixture from the bottom leaflet to the upper leaflet, the structure transformation time was reduced from 3 h to 15 min, in order for lipid molecules to reach a similar structure proportion. Two hypotheses were formulated to explain the phenomenon, based on the assumption of structure-dependent affinity and considering the diffusion of TR-DHPE molecules in the bilayer independently of the lipid molecules. Correlated multimodal analysis using AFM, force mapping, and fluorescence imaging provides a novel route to uncover the reorganization of lipid molecules at the solid−liquid interface, suggesting that the dynamics of dye molecules was highly structure dependent.
■
ASSOCIATED CONTENT*
S Supporting InformationDetailed descriptions of the morphology changes of asymmetric lipid bilayers of DPPCLB+(DOPC/DPPC)LS, (DOPC/ DPPC)LS+DPPCLB, (DOPC/DPPC)LB+DOPCLS, and
Figure 6.Correlated fluorescence and AFM images of bilayer samples constructed by a LB layer of DOPC plus a LS layer of DOPC/DPPC (1:1). (A) AFM height image, (B) correlated fluorescence image, and (C) corresponding height profile. Scale bars are 10 μm.
Langmuir Article
dx.doi.org/10.1021/la3040424 | Langmuir 2013, 29, 221−227
DOPCLB+(DOPC/DPPC)LS. This material is available free of charge via the Internet at http://pubs.acs.org.
■
AUTHOR INFORMATION Corresponding Author*Phone: (613) 949-9675; fax: (613) 991-4278; e-mail: shan. zou@nrc-cnrc.gc.ca.
Notes
The authors declare no competing financial interest.
■
ACKNOWLEDGMENTSWe thank Dr. Zhengfang Lu for the technical support. This work was partially supported by National Sciences and Engineering Research Council (NSERC) of Canada Strategic Network Grant (BiopSys).
■
REFERENCES(1) Daleke, D. L. Regulation of transbilayer plasma membrane phospholipid asymmetry. J. Lipid Res. 2003, 44, 233.
(2) Kornberg, R. D.; McConnel, H. M. Inside-outside transitions of phospholipids in vesicle membranes. Biochemistry 1971, 10, 1111.
(3) Brown, D. A.; London, E. Structure and function of sphingolipid-and cholesterol-rich membrane rafts. J. Biol. Chem. 2000, 275, 17221. (4) Devaux, P. F.; Morris, R. Transmembrane asymmetry and lateral domains in biological membranes. Traffic 2004, 5, 241.
(5) Devaux, P. F. Static and dynamic lipid asymmetry in cell membranes. Biochemistry 1991, 30, 1163.
(6) Anderson, R. G. W.; Jacobson, K. A role for lipid shells in targeting proteins to caveolae, rafts, and other lipid domains. Science 2002, 296, 1821.
(7) Carafoli, E. Intracellular calcium homeostasis. Annu. Rev. Biochem. 1987, 56, 395.
(8) Denicourt, N.; Tancrede, P.; Brullemans, M.; Teissie, J. The liquid condensed diffusional transition of dipalmitoylphosphoglycer-ocholine in monolayers. Biophys. Chem. 1989, 33, 63.
(9) Hollars, C. W.; Dunn, R. C. Submicron structure in L-alpha-dipalmitoylphosphatidylcholine monolayers and bilayers probed with confocal, atomic force, and near-field microscopy. Biophys. J. 1998, 75, 342.
(10) Lin, W. C.; Blanchette, C. D.; Ratto, T. V.; Longo, M. L. Lipid asymmetry in DLPC/DSPC-supported lipid bilayers: a combined AFM and fluorescence microscopy study. Biophys. J. 2006, 90, 228.
(11) Tokumasu, F.; Jin, A. J.; Feigenson, G. W.; Dvorak, J. A. Nanoscopic lipid domain dynamics revealed by atomic force microscopy. Biophys. J. 2003, 84, 2609.
(12) Bagatolli, L. A.; Gratton, E. A correlation between lipid domain shape and binary phospholipid mixture composition in free standing bilayers: a two-photon fluorescence microscopy study. Biophys. J. 2000, 79, 434.
(13) Baumgart, T.; Hess, S. T.; Webb, W. W. Imaging coexisting fluid domains in biomembrane models coupling curvature and line tension. Nature 2003, 425, 821.
(14) de Almeida, R. F. M.; Loura, L. M. S.; Fedorov, A.; Prieto, M. Nonequilibrium phenomena in the phase separation of a two-component lipid bilayer. Biophys. J. 2002, 82, 823.
(15) Bernchou, U.; Ipsen, J. H.; Simonsen, A. C. Growth of solid domains in model membranes: quantitative image analysis reveals a strong correlation between domain shape and spatial position. J. Phys. Chem. B 2009, 113, 7170.
(16) Sullan, R. M. A.; Jacobson, K.; Hao, C.; Walker, G. C.; Zou, S. Cholesterol-dependent nanomechanical stability of phase-segregated multicomponent lipid bilayers. Biophys. J. 2010, 99, 507.
(17) Sullan, R. M. A.; Li, J. K.; Zou, S. Direct correlation of structures and nanomechanical properties of multicomponent lipid bilayers. Langmuir 2009, 25, 7471.
(18) Rinia, H. A.; Snel, M. M. E.; van der Eerden, J.; de Kruijff, B. Visualizing detergent resistant domains in model membranes with atomic force microscopy. FEBS Lett. 2001, 501, 92.
(19) Gaines, G. L. Insoluble monolayer at liquid-gas interfaces; Wiley: Hoboken, NJ, 1966.
(20) Vie, V.; Van Mau, N.; Lesniewska, E.; Goudonnet, J. P.; Heitz, F.; Le Grimellec, C. Distribution of ganglioside GM1 between
two-component, two-phase phosphatidylcholine monolayers. Langmuir 1998, 14, 4574.
(21) Blanchette, C. D.; Lin, W.-C.; Orme, C. A.; Ratto, T. V.; Longo, M. L. Using nucleation rates to determine the interfacial line tension of symmetric and asymmetric lipid bilayer domains. Langmuir 2007, 23, 5875.
(22) Stottrup, B. L.; Veatch, S. L.; Keller, S. L. Nonequilibrium behavior in supported lipid membranes containing cholesterol. Biophys. J. 2004, 86, 2942.
(23) Lee, G. M.; Ishikawa, A.; Jacobson, K. Direct observation of Brownian motion of lipids in a membrane. Proc. Natl. Acad. Sci. U.S.A. 1991, 88, 6274.
(24) Saxton, M. J.; Jacobson, K. A. Single-particle tracking: applications to membrane dynamics. Rev. Biophys. Biomol. Struct. 1997, 26, 373.
(25) Schmidt, T.; Schutz, G. J.; Baumgartner, W.; Gruber, H. J.; Schindler, H. Imaging of single molecule diffusion. Proc. Natl. Acad. Sci. U.S.A. 1996, 93, 2926.
(26) Skaug, M. J.; Longo, M. L.; Faller, R. The impact of Texas Red on lipid bilayer properties. J. Phys. Chem. B 2011, 115, 8500.