Publisher’s version / Version de l'éditeur:
Polymer Engineering and Science, 45, 6, pp. 764-772, 2005-06-01
READ THESE TERMS AND CONDITIONS CAREFULLY BEFORE USING THIS WEBSITE. https://nrc-publications.canada.ca/eng/copyright
Vous avez des questions? Nous pouvons vous aider. Pour communiquer directement avec un auteur, consultez la première page de la revue dans laquelle son article a été publié afin de trouver ses coordonnées. Si vous n’arrivez pas à les repérer, communiquez avec nous à PublicationsArchive-ArchivesPublications@nrc-cnrc.gc.ca.
Questions? Contact the NRC Publications Archive team at
PublicationsArchive-ArchivesPublications@nrc-cnrc.gc.ca. If you wish to email the authors directly, please see the first page of the publication for their contact information.
NRC Publications Archive
Archives des publications du CNRC
This publication could be one of several versions: author’s original, accepted manuscript or the publisher’s version. / La version de cette publication peut être l’une des suivantes : la version prépublication de l’auteur, la version acceptée du manuscrit ou la version de l’éditeur.
For the publisher’s version, please access the DOI link below./ Pour consulter la version de l’éditeur, utilisez le lien DOI ci-dessous.
https://doi.org/10.1002/pen.20328
Access and use of this website and the material on it are subject to the Terms and Conditions set forth at
Application of Ultrasound and Neural Networks in the Determination of
Filler Concentration and Dispersion during Polymer Extrusion
Processes
Sun, Zhigang; Jen, Cheng-Kuei; Yan, Jian; Chen, Ming-Yuan
https://publications-cnrc.canada.ca/fra/droits
L’accès à ce site Web et l’utilisation de son contenu sont assujettis aux conditions présentées dans le site LISEZ CES CONDITIONS ATTENTIVEMENT AVANT D’UTILISER CE SITE WEB.
NRC Publications Record / Notice d'Archives des publications de CNRC:
https://nrc-publications.canada.ca/eng/view/object/?id=be4c3298-a894-422a-a5ac-7fea9a29f13f https://publications-cnrc.canada.ca/fra/voir/objet/?id=be4c3298-a894-422a-a5ac-7fea9a29f13fApplication of Ultrasound and Neural Networks in the
Determination of Filler Dispersion During Polymer
Extrusion Processes
Zhigang Sun, Cheng-Kuei Jen
Industrial Materials Institute, National Research Council, 75 de Mortagne Blvd., Boucherville, Quebec J4B 6Y4, Canada
Jian Yan, Ming-Yuan Chen
Mechanical and Industrial Engineering Department, Concordia University, 1455 de Maisonneuve Blvd. W., Montreal, Quebec H3G 1M8, Canada
Mineral filler dispersion is important information for the production of mineral-charged polymers. In order to achieve timely control of product quality, a technique capable of providing real-time information on filler dis-persion is highly desirable. In this work, ultrasound, tem-perature, and pressure sensors as well as an ampereme-ter of the extruder motor drive were used to monitor the extrusion of mineral-filled polymers under various ex-perimental conditions in terms of filler type, filler con-centration, feeding rate, screw rotation speed, and bar-rel temperature. Then, neural network bar-relationships were established among the filler dispersion index and three categories of variables, namely, control variables of the extruder, extruder-dependent measured vari-ables, and extruder-independent measured variables (based on ultrasonic measurement). Of the three cate-gories of variables, the process control variables and extruder-independent ultrasonically measured variables performed best in inferring the dispersion index through a neural network model. While the neural network model based on control variables could help determine the optimal experimental conditions to achieve a dispersion index, the extruder-independent network model based on ultrasonic measurement is suitable for in-line mea-surement of the quality of dispersion. This study has demonstrated the feasibility of using ultrasound and neural networks for in-line monitoring of dispersion dur-ing extrusion processes of mineral-charged polymers.
POLYM. ENG. SCI., 45:764 –772, 2005. © 2005 Society of Plastics Engineers
INTRODUCTION
Mineral-reinforced polymers are widely used in today’s industries for their improved mechanical properties in com-parison with nonreinforced ones. Mineral filler dispersion is an important factor affecting the properties of the filled polymers. In order to achieve timely control of product quality, a technique capable of providing real-time informa-tion on filler concentrainforma-tion and dispersion during the fabri-cation of mineral-filled polymers is highly desirable. Opti-cal microscopy and scanning electron microscopy (SEM) are two of the most widely used techniques for evaluating the quality of filler dispersion [1–3]. Other techniques in-clude electrical conductivity and dielectric measurements [4], nuclear magnetic resonance (NMR) [5], and X-ray scattering analysis [6]. All the methods mentioned above are time consuming and cannot be used on-line to meet the need of real-time control of the quality of manufactured products. Ultrasound is one of the popular means for industrial process monitoring and material characterization, owing to its robustness, fast response, nondestructiveness, noninva-siveness, and cost-effectiveness. As far as mineral-rein-forced polymer processing is concerned, ultrasound is sen-sitive to mineral filler concentration and the dispersion condition of the filler in the molten polymer matrix [7–9]. This sensitivity makes it possible to use ultrasound to de-termine filler concentration and dispersion. However, the ultrasonic properties (i.e., ultrasound velocity and attenua-tion) of a mineral-filled polymer depend not only on the filler concentration and dispersion, but also on melt temper-ature, pressure, molecular weight, and the shear rate of the melt. If an explicit relationship between the ultrasonic prop-erties, filler dispersion, and other intervening factors were known, it would be trivial to determine the filler dispersion through this relationship and ultrasonic measurements.
Correspondence to:Z. Sun; e-mail: zhigang.sun@cnrc-nrc.gc.ca Contract grant sponsor: Natural Sciences and Engineering Research Coun-cil of Canada (NSERC).
DOI 10.1002/pen.20328
Published online in Wiley InterScience (www.interscience.wiley.com).
However, at the current state of the art, such an explicit relationship cannot be established easily, due to the lack of thorough understanding of the interaction between ultra-sound and filled polymers under flowing condition.
Artificial neural networks provide a way for modeling the relationship among measured and controlled parameters of a complex process without the need of thorough under-standing of the process itself [10]. There has been work on the use of neural networks and ultrasound for quantifying the dispersion of mineral filler in a polymer [11]. The current work is a continuation of the work carried out earlier at our institute and presented in Ref. 11, and constitutes one of our steps toward establishing a way of using ultrasound for online determination of filler dispersion state. In this work, attempts have been made to build neural networks that relate the filler dispersion index to each of three cate-gories of variables, namely, control variables of the ex-truder, extruder-dependent measured variables, and extrud-er-independent measured variables based on ultrasonic measurement. The purpose is to show, through example networks, that a combination of ultrasonic measurement and neural networks could be a viable approach to in-line de-termination of filler dispersion index. Although the structure and training algorithm of a network can have crucial impact on the performance of the network, we will focus on more fundamental issues such as selections of input variables for
filler dispersion monitoring, and the physical reasons behind these choices and their consequences, rather than on pure technical issues as to how a network should be structured and trained. That being said, and keeping in mind that there are numerous ways to design the architecture of a neural network and there are various ways to do the training, the network presented in this work is by no means intended to be the best performing one, but rather one that performs reasonably well. The readers can certainly build their own neural networks by respecting some of the considerations discussed in this article.
EXPERIMENTS
Polypropylene (PP) 6631 from Himont Canada, with
density ⫽ 890 kg/m3 and melt flow rate (MFR) ⫽ 2.0
dg/min, was used in this study. Two grades of calcium carbonate powders, Camel-Cal and Camel-Cal-ST, supplied by Genstar, with specific gravity of 2.71 were used as fillers. Both grades had a mean particle size of 0.7 m, with 90% of the particles finer than 2 m, and 100% finer than 7 m. The grade with suffix ST was stearate-coated to allow for better particle dispersion.
A Leistritz 34-mm corotating intermeshing twin-screw extruder, composed of 12 barrel sections with a barrel-length-to-diameter ratio (L/D) of 42, was used.
Polypro-FIG. 1. Schematic of the extruder and instrumented die used in the experiments. The locations of three pressure sensors in the instrumented are indicated with P1, P2, and P3. The ultrasonic sensors are indicated with US, and the melt thermocouple is indicated with Tmelt.
TABLE 1. Experimental data.* Sample index Ftype Cf (%) Tprfl VRPM (RPM) QFeed (kg/h) Vus (m/s) ␣us (dB/cm) Amps (A) Tmelt (°C) P1 (MPa) P2 (MPa) P3 (MPa) Pus (MPa) Dx 1 Non_ST 15 1 100 8.8235 886.71 17.096 26.48 231.36 2.7618 1.8339 0.9636 3.7362 0.6906 2 Non_ST 10 1 300 8.3333 845.26 15.636 18.679 233.25 2.3071 1.5397 0.8203 3.1129 0.7085 3 Non_ST 20 2 300 9.375 863.12 18.901 20.343 212.06 2.8641 1.9170 1.0038 3.8587 0.7623 4 Non_ST 15 1 175 8.8235 865.96 15.763 22.228 232.05 2.6226 1.7405 0.9160 3.5489 0.7635 5 Non_ST 5 2 100 7.8947 942.02 6.5622 24.082 204.73 2.8826 1.9427 1.0182 3.8695 0.7763 6 Non_ST 5 1 100 7.8947 899.16 7.628 23.113 231.07 2.4695 1.6415 0.8741 3.339 0.7802 7 Non_ST 15 2 300 8.8235 872.49 16.238 19.487 210.27 2.7163 1.8206 0.9592 3.6567 0.7864 8 Non_ST 20 2 100 4.375 921.8 14.964 18.758 205.66 2.5777 1.7353 0.9013 3.4623 0.7976 9 Non_ST 20 1 175 4.375 851.05 17.808 16.75 230.75 2.0531 1.3570 0.7105 2.7842 0.8 10 Non_ST 5 2 100 3.6842 945.68 6.3547 15.718 205.37 2.2566 1.5214 0.7991 3.0286 0.8093 11 Non_ST 20 1 300 4.375 825.03 20.586 15.603 232.3 1.9411 1.2926 0.6814 2.6222 0.8115 12 Non_ST 10 2 100 3.8889 937.15 8.8756 16.579 205.42 2.3407 1.5776 0.8269 3.1421 0.8196 13 Non_ST 20 2 175 4.375 896.66 15.265 17.557 207.26 2.4783 1.6652 0.8632 3.3322 0.8254 14 Non_ST 15 1 100 4.1176 881.97 15.125 17.353 230.57 2.0424 1.3503 0.7139 2.7693 0.827 15 Non_ST 20 2 300 4.375 859.95 18.29 15.463 209.14 2.1764 1.4534 0.7636 2.9357 0.8283 16 Non_ST 15 2 175 4.1176 903.88 12.901 16.677 206.75 2.3535 1.5854 0.8289 3.16 0.8331 17 Non_ST 5 1 300 3.6842 851.39 8.7336 13.323 230.6 1.5441 1.0323 0.5581 2.0815 0.8498 18 Non_ST 5 1 175 3.6842 879.97 8.1665 13.912 230.65 1.7764 1.1864 0.6380 2.396 0.8517 19 Non_ST 10 2 300 3.8889 877.86 11.66 13.988 204.82 1.9236 1.2907 0.6845 2.5882 0.8599 20 Non_ST 5 2 175 3.6842 919.95 7.4962 14.768 206.2 2.1121 1.4262 0.7497 2.8324 0.8632 21 Non_ST 10 1 300 3.8889 841.28 13.075 14.479 231.31 1.6806 1.1225 0.6029 2.2667 0.8754 22 ST 10 1 100 8.3333 890.77 10.826 23.155 230.21 2.3865 1.6746 0.9119 3.1341 0.7223 23 ST 15 1 100 8.8235 884.17 14.888 23.903 230.41 2.4850 1.7446 0.9440 3.2626 0.7543 24 ST 5 1 100 7.8947 897.08 6.5878 22.285 229.97 2.2826 1.6031 0.8772 2.9962 0.7809 25 ST 20 1 100 9.375 877.28 18.053 24.6 231.21 2.5719 1.8005 0.9671 3.3819 0.7829 26 ST 20 1 175 9.375 855.18 15.817 21.408 231.22 2.3470 1.6713 0.9044 3.0567 0.7909 27 ST 15 2 100 8.8235 921.48 11.479 22.931 205.28 2.7991 1.9826 1.0438 3.6565 0.8119 28 ST 10 1 175 8.3333 869.49 10.566 20.653 229.54 2.0577 1.5594 0.8567 2.581 0.8183 29 ST 5 2 300 7.8947 882.6 10.336 19.854 204.76 2.2824 1.6121 0.8505 2.9863 0.8267 30 ST 15 1 300 8.8235 833.49 15.774 18.542 233.47 2.2280 1.5632 0.8474 2.9262 0.8368 31 ST 20 2 100 9.375 914.18 14.632 24.007 205.62 2.9091 2.0517 1.0808 3.8095 0.8371 32 ST 20 1 300 9.375 826.71 17.115 18.576 233.42 2.3022 1.6133 0.8703 3.0256 0.8445 33 ST 20 1 175 4.375 850.6 13.121 16.267 230.76 1.7504 1.2762 0.6570 2.2486 0.8482 34 ST 20 1 100 4.375 871.25 13.44 15.357 229.24 1.8510 1.3569 0.7268 2.3698 0.8531 35 ST 10 1 300 8.3333 842.03 13.642 18.933 232.97 2.1696 1.5248 0.8302 2.8468 0.8549 36 ST 10 2 100 8.3333 929.95 8.0875 22.098 204.88 2.6981 1.9144 1.0087 3.5212 0.8554 37 ST 10 2 300 3.8889 873.89 8.8515 13.923 205.41 1.7902 1.2790 0.6690 2.3271 0.8628 38 ST 5 1 175 3.6842 875.6 6.8962 14.714 230.3 1.5565 1.1469 0.5969 1.9866 0.864 39 ST 15 1 175 4.1176 858.51 10.984 15.519 230.68 1.6741 1.2251 0.6327 2.1456 0.8671 40 ST 15 2 175 4.1176 901.31 10.083 15.12 205.01 2.0562 1.4589 0.7596 2.6833 0.8678 41 ST 15 2 300 8.8235 864.57 13.88 20.396 208.34 2.4750 1.7439 0.9178 3.2428 0.8689 42 ST 20 2 300 4.375 855.23 13.196 14.679 206.29 1.9440 1.3830 0.7189 2.5334 0.8708 43 ST 15 1 100 4.1176 880.27 11.199 14.704 228.93 1.7819 1.3122 0.7075 2.275 0.872 44 ST 5 2 175 3.6842 920.38 6.6897 14.338 204.31 1.9353 1.3754 0.7171 2.5234 0.8735 45 ST 10 2 175 8.3333 908.79 8.3866 21.11 206.49 2.5726 1.8059 0.9471 3.3778 0.8812 46 ST 5 2 100 3.6842 942.93 5.5136 15.395 202.93 1.9904 1.4407 0.7597 2.5678 0.883 47 ST 10 1 300 3.8889 835 9.4031 14.917 231.23 1.4522 1.0699 0.5652 1.8538 0.903 48 Non_ST 10 1 100 8.3333 892.7 12.486 24.585 231.15 2.6153 1.7375 0.9200 3.537 0.6999 49 Non_ST 20 1 300 9.375 827.32 21.721 20.039 233.9 2.5553 1.6980 0.8895 3.4556 0.7499 50 Non_ST 5 1 300 7.8947 854.27 10.817 17.419 232.2 2.1360 1.4279 0.7636 2.8796 0.7605 51 Non_ST 20 1 175 9.375 857.94 19.462 23.264 232.54 2.7771 1.8374 0.9566 3.7639 0.7624 52 Non_ST 15 2 100 8.8235 928.54 14.553 27.405 206.26 3.1531 2.1248 1.1087 4.233 0.7772 53 Non_ST 10 2 100 8.3333 934.65 10.406 25.419 205.34 2.9989 2.0211 1.0575 4.0257 0.7809 54 Non_ST 20 2 175 9.375 892.57 17.649 24.538 206 3.1007 2.0864 1.0772 4.1659 0.7818 55 Non_ST 10 1 175 8.3333 873.26 12.158 21.319 231.65 2.4774 1.6463 0.8737 3.3502 0.7836 56 Non_ST 15 2 175 8.8235 900.75 13.946 23.306 204.88 2.9419 1.9843 1.0302 3.9475 0.7901 57 Non_ST 20 1 100 3.75 876.06 17.906 18.611 230.98 2.1980 1.4502 0.7615 2.9834 0.7938 58 Non_ST 15 1 300 8.8235 836.76 18.138 18.952 233.16 2.4028 1.6010 0.8467 3.2447 0.7989 59 Non_ST 5 2 300 7.8947 891.48 10.866 17.645 208.02 2.4438 1.6387 0.8689 3.2893 0.8036 60 Non_ST 5 1 175 7.8947 881.16 8.0002 20.179 231.25 2.3421 1.5571 0.8307 3.1664 0.811 61 Non_ST 5 2 300 3.5526 887.26 8.2033 13.243 206.43 1.7709 1.1889 0.6350 2.3821 0.8176 62 Non_ST 15 1 175 3.6765 857.84 14.832 15.971 229.76 1.9124 1.2680 0.6709 2.589 0.8189
pylene pellets and calcium carbonate powder were fed sep-arately by two high-precision gravimetric feeders at the same feed throat location. A slit die instrumented with two 5-MHz ultrasonic sensors, a melt thermocouple, and three pressure transducers, all flush-mounted in the die channel, was used (Fig. 1). The die channel had a 3.0 mm high by 40.0 mm wide rectangular cross-section. The ultrasonic and pressure sensors were installed perpendicular to the 40.0-mm wide surface of the slot. Two ultrasonic sensors were axially aligned, but on the opposite sides of the slot, separately. During measurements, one of the ultrasonic sen-sors was used as a transmitter to send ultrasonic waves to the molten polymer. The other ultrasonic sensor was used as a receiver. The ultrasonic waves were reflected back and forth several times between the two ultrasonic sensors be-fore completely dying out. By measuring the time delay and amplitude difference between consecutive echoes, the ultra-sonic velocity and attenuation coefficient in the molten polymer were obtained [7]. Please note that this instru-mented die could be installed at the exit of a variety of extruders.
The experimental data are given in Table 1. These are rearranged data reproduced from an early work carried out at our institute by D. Binet and presented in Ref. 11. The
experiments were designed on a full 23⫻ 31factorial plan for 5 levels of filler concentration [12]. The controlled parameters of the process were feeding rate Qfeed(2 levels:
3.5 and 7.5 kg/h), screw rotation speed VRPM(3 levels: 100,
175, and 300 rpm), barrel temperature profile Tprfl (2
pro-files: one, represented by 1 in Table 1, starting at 185°C at the feed throat, with a gradual increase of 5°C from barrel to barrel, up to 225°C at the ninth, with that set-point constant for the remaining barrels and the die; another one, represented by 2 in Table 1, with a constant set-point of 200°C imposed for all sections), the type of filler fed into the extruder Ftype (2 types: one with stearate coating and
denoted as ST in Table 1, and one without coating and denoted as Non_ST in Table 1), and the filler concentration
Cf (5 levels: 0, 5, 10, 15, and 20 wt%). The measured parameters are divided into two categories. The first cate-gory is extruder-dependent measured variables, which in-cludes the melt pressure profile defined by pressures P1, P2,
and P3at three pressure probe locations at the instrumented
die shown in Fig. 1, the amperage of electric current Amps
required to drive the screws of the extruder. The category of extruder-independent measured variables is composed of variables measured locally at (or near) the ultrasonic probe location. These variables are ultrasonic velocity Vus and
TABLE 1. (Continued) Sample index Ftype Cf (%) Tprfl VRPM (RPM) QFeed (kg/h) Vus (m/s) ␣us (dB/cm) Amps (A) Tmelt (°C) P1 (MPa) P2 (MPa) P3 (MPa) Pus (MPa) Dx 63 Non_ST 5 1 100 3.5526 897.02 7.3819 15.302 230.31 1.8628 1.2376 0.6641 2.5194 0.8254 64 Non_ST 5 2 175 7.8947 922.32 7.1746 20.16 206.24 2.7381 1.8343 0.9711 3.6873 0.8255 65 Non_ST 10 1 100 3.6111 889.66 11.388 16.213 230.52 1.9470 1.2924 0.6872 2.6345 0.8268 66 Non_ST 15 1 300 3.6765 833.03 17.094 14.952 231.73 1.7882 1.1924 0.6357 2.4137 0.834 67 Non_ST 10 2 175 8.3333 908.94 10.593 22.369 203.36 2.7942 1.8861 0.9829 3.7478 0.837 68 Non_ST 10 2 300 8.3333 881.56 13.98 18.821 209.24 2.5875 1.7349 0.9173 3.4828 0.845 69 Non_ST 15 2 100 3.6765 928.27 12.113 17.763 205.58 2.4565 1.6551 0.8643 3.298 0.8523 70 Non_ST 10 2 175 3.6111 911.3 10.061 15.566 206.43 2.2032 1.4871 0.7801 2.9551 0.8552 71 Non_ST 15 2 300 3.6765 868.29 14.433 14.632 206.3 2.0013 1.3390 0.7044 2.6968 0.8634 72 Non_ST 5 1 225 3.5526 866.41 8.4376 13.706 230.99 1.7439 1.1655 0.6271 2.3513 0.8676 73 ST 15 1 175 8.8235 862.27 13.474 21.237 230.16 2.2293 1.6247 0.8857 2.8641 0.7096 74 ST 5 1 175 7.8947 877.28 7.3736 20.332 228.55 2.0166 1.5000 0.8284 2.5592 0.776 75 ST 5 2 100 7.8947 939.46 5.3675 21.52 204.65 2.6470 1.8799 0.9911 3.4526 0.8119 76 ST 20 2 175 9.375 890.99 13.766 22.415 207.11 2.8086 1.9643 1.0266 3.6954 0.8274 77 ST 15 2 175 8.8235 900 10.766 21.696 206.73 2.6948 1.8884 0.9895 3.5416 0.8309 78 ST 20 2 100 3.75 912.72 12.233 16.285 204.22 2.1434 1.5438 0.8114 2.7731 0.8372 79 ST 5 1 100 3.5526 898.66 6.1621 13.973 228.68 1.6749 1.2401 0.6719 2.1316 0.8484 80 ST 10 2 300 8.3333 872.7 11.972 19.865 207.06 2.3828 1.6815 0.8874 3.1192 0.8513 81 ST 20 2 175 3.75 892.35 12.073 15.846 205.32 2.1299 1.5084 0.7828 2.7827 0.8532 82 ST 20 1 300 3.75 818.25 13.786 15.52 231.91 1.5704 1.1533 0.5964 2.0085 0.8574 83 ST 5 2 300 3.5526 883.42 6.8909 13.55 204.62 1.7405 1.2469 0.6563 2.2588 0.8602 84 ST 20 2 300 9.375 856.82 16.362 20.571 209.54 2.5767 1.8115 0.9497 3.3803 0.863 85 ST 15 2 100 3.6765 922.37 10.296 15.792 203.99 2.0766 1.4992 0.7897 2.6829 0.8645 86 ST 5 1 300 3.5526 845.26 6.9809 14.591 230.67 1.3543 1.0133 0.5335 1.7123 0.8683 87 ST 15 2 300 3.6765 864.14 10.964 14.387 205.88 1.8885 1.3456 0.7015 2.4586 0.8704 88 ST 5 2 175 7.8947 918.18 6.2375 20.795 206.22 2.5260 1.7738 0.9311 3.3159 0.8715 89 ST 10 2 100 3.6111 933.15 7.5239 15.569 203.55 2.0110 1.4543 0.7661 2.5957 0.8725 90 ST 5 1 300 7.8947 848.9 10.998 19.375 232.04 2.0067 1.4194 0.7795 2.6233 0.8743 91 ST 15 1 300 3.6765 826.38 12.065 15.37 231.5 1.5066 1.1117 0.5797 1.9215 0.8777 92 ST 10 1 100 3.6111 888.97 8.6863 14.409 228.67 1.7307 1.2782 0.6915 2.206 0.882 93 ST 10 2 175 3.6111 910.54 8.5258 14.737 204.59 1.9883 1.4121 0.7356 2.5934 0.8906 *Source: Binet [11].
attenuation coefficient ␣us in the material being extruded. Since Vusand ␣usmeasure the mechanical properties of the material and take no account of how the material has been processed, they are extruder-independent variables. It should be pointed out that the sound velocity and attenua-tion are also funcattenua-tions of melt temperature, pressure. Fur-thermore, not only the degree of filler dispersion, but also the shear rate, which determines the degree of deformation of polymer chains under flowing condition, can affect the acoustic properties of the polymer. As a consequence, the melt pressure at the ultrasonic probe location Pus, the melt temperature Tmelt read from a melt thermocouple, and the melt shear rate at the ultrasonic probe location ␥˙, should be used with ultrasonic measurement in order to infer filler dispersion state from the ultrasonic data. The shear rate is not easily measurable on-line; however, given the material and the geometry of the melt flow channel of the instru-mented die, the shear rate is uniquely determined by the feed rate. This means that the feed rate, Qfeed, can be used in place of ␥˙ as an input of the neural network, even though the explicit relationship between the two parameters is unknown. Note that the feed rate Qfeedis not only a control variable of the process, but can be a measured variable as well. For the instrumented die used in this work, Pusis an extrapolated value of the pressure readings P1, P2, and P3.
The parameter of interest to this study was filler dispersion index Dx.
The following definition of the dispersion index, as pro-posed by Suetsugu [2], was adopted in this study:
Dx⫽ 1 ⫺
⌸
4A
冘
di2n
i ,
where A is the area of observation, the volume fraction of filler, dithe diameter of agglomerates greater than a critical
value [2], and nithe number of agglomerates with diameter
di. The best dispersion is obtained when no agglomerate is detected (Dx ⫽ 1). In the case of worst dispersion, all the particles remain in the form of agglomerates and Dxtakes the value of 0. In the present study, the dispersion index was determined through SEM analysis and the critical diameter was set to 7 m, which was the upper limit of the diameters of the CaCO3 particles used in the study. The size of the
examined area by SEM was 1.125 by 1.125 mm. Details on laboratory measurements of filler concentration and disper-sion can be found in Ref. 12.
ARTIFICIAL NEURAL NETWORK MODELING Artificial neural network approach is a mapping process that translates a set of measured variables (inputs to the network) into the material property of interest (output of the network). Three network models have been developed for estimating the dispersion index. Except for the inputs, all the networks share the same structure and have the disper-sion index Dxas a single output. The first network, shown
in Fig. 2, has as inputs only control variables, namely, the filler type Ftype, the feed rate Qfeed, the filler concentration
Cf, and the screw speed VRPM. The second network, shown
in Fig. 3, has as inputs the filler type Ftype, the pressures
measured at three locations P1, P2, and P3, the melt
tem-perature Tmelt, the feed rate Qfeed, and the amperage Amps.
In the third network, shown in Fig. 4, we want to use the ultrasonic velocity Vus and attenuation coefficient ␣us to
infer the dispersion index. Note that both Vusand ␣us are
not only functions of the state of filler dispersion, but also functions of melt pressure, temperature, and shear rate (which is determined by the feed rate for a given material and die geometry). As a consequence, the melt temperature
Tmelt, the melt pressure at the ultrasonic probe location Pus,
and the feed rate Qfeed are used as inputs of the network as
well.
FIG. 2. A four-layer feed-forward network for the estimation of filler dispersion. The network uses only process control variables as inputs.
Table 2 shows the correlations between some of the variables listed in Table 1 and the dispersion index Dx. As
can be seen in Table 2, the ultrasonic velocity, Vus, is
practically not correlated to the dispersion index. However, we still use Vus as one of the inputs of the third neural
network. This is because the ultrasonic velocity is particu-larly sensitive to the thermal degradation (determined by polymer thermal history during the process) of the polymer [13] and the polymer degradation can also affect the ultra-sonic attenuation ␣us. As a matter of fact, Vusand ␣usare
physically interrelated. From Table 1, the correlation coef-ficient between Vusand ␣usis calculated as – 0.54, which is
much more significant than the value of 0.009 between Vus
and Dx. Introducing Vus in the network model can help
reduce the influence of thermal history on the estimation of distribution index.
Our analysis of Table 1 has shown that the surface
condition, i.e., with or without stearate coating, of fillers, has strong effects on the quality of dispersion. More pre-cisely, under similar processing conditions, the coated filler performed consistently better than the noncoated one in terms of dispersion index. Therefore, the filler type Ftype
was used as an input to all of the three networks. The filler type was coded as 1 for the stearate-coated filler and 2 for the noncoated filler. Obviously, the effects of the two filler types on the process could not be represented with these two rather arbitrarily chosen simple values. We used a two-neuron layer to represent the effect of the filler type. With this layer, each filler type was characterized by two output numbers of which the values were to be determined by the network training process.
The neural networks were implemented using a commer-cial MATLAB威 Neural Network Toolbox. The networks used a hyperbolic tangent sigmoid transfer function for the
FIG. 3. A four-layer feed-forward network for the estimation of filler dispersion. No ultrasonically measured variables are used as inputs.
FIG. 4. A four-layer feed-forward network for the estimation of filler dispersion based on ultrasonic attenuation and velocity measurement.
neurons (i.e., processing unit) at the hidden layers, and a linear transfer function for the output layer. However, only the first hidden layer had a bias connection. The weight factor associated with each interconnection between an in-put and a neuron or between two neurons as well as the biases of the first layer were adjusted (in other words, the networks were trained) according to Levenberg-Marquardt back-propagation optimization. To overcome the overfitting problem inherent to the back-propagation algorithm, we utilized a validation data set and an early stopping strategy by which the training stopped after a minimal mean squared error of the network output with respect to the validation data had be achieved.
Of the available 93 dispersion index measurements (47 for stearate-coated filler and 46 for noncoated filler), 47 were chosen to form a data set for network training, and the rest were used to form a validation-testing data set. Because of the limited number of samples, for each training, one-half of the data samples were chosen randomly from the valida-tion-testing data pool to form a validation data set, and the remaining data for the testing data set. A total of 30 pairs of thusly-formed data sets were used in the training process, resulting in 30 trained networks. Each of the 30 trained networks was the best result of trainings for 1000 different initial weight and bias conditions. The best result was de-fined as the one with the smallest maximum error on the 93 estimated Dxcompared with the measured ones. Among the
93 estimates of Dx, 47 were from training, 23 from
valida-tion, and 23 from testing. A comparison of the 30 trained networks allowed us to evaluate the robustness of the net-work models.
RESULTS AND DISCUSSIONS
Table 3 shows the errors on the estimates of the disper-sion indices generated by the networks depicted in Figs. 2,
3, and 4, respectively. In Table 3, max_meanrepresents the
average of the maximum errors generated by the 30 trained networks, rms_mean the average of the root-mean-square
errors of the estimates produced by the 30 trained networks with regard to the measured values of the samples, and max_best5 the maximum of the errors generated by the
average of the estimates provided by the five best trained of the 30 networks compared with the measured dispersion indices. In this work, we used the average of the estimates provided by the five best trained of the 30 networks as the final estimate produced by the model. For the network of Fig. 2, where only the control parameters were used as inputs, the estimation error max_best5 on dispersion index
was less than 0.033 on a scale of 0 to 1 for the case in which a constant set point of 200°C was imposed for all barrel sections. This error was less than 0.046 for the case where the temperature profile of the extruder barrel temperature was set at 185°C at the feed throat, with a gradual increase of 5°C from barrel to barrel up to 225°C at the ninth, and at 225°C for the remaining barrels and the die. Given that even the SEM utilized in this study had a 10% chance of pro-ducing an error of larger than 0.05 on dispersion index measurement (of course these errors were mostly filtered out in the averaged data used in this study), the performance of this network is excellent. Deviations of estimated disper-sion indices, produced by the present as well the other networks presented in this work, from the measured ones could result from insufficient data size in the network train-ing, and the network structure that may not reproduce the exact process. The instability of the process itself, discrep-ancy between the readings and the real values of the process and measured variables, limited accuracy on dispersion index measurement, could also result in deviations of the network estimates from the measured results. The excellent prediction of the dispersion index through application of the control variables of the process to the network suggests a deterministic nature of the dependency of the state of filler dispersion on the operating conditions of the extrusion process. The neural network model established could be used as a simulation tool to determine the optimal process conditions to achieve a desired and practically achievable dispersion quality. However, since the effects of a given process control condition depends largely on the status and configuration of the screws and barrel, the neural network model based on control variables is extruder-dependent. In other words, for the model to be valid, it has to be retrained upon every change made to the screw and barrel. This obviously limits the usefulness of such a model.
The neural network of Fig. 3 has generated an estimation error of less than 0.055 and can be considered good as well.
TABLE 2. Correlation coefficients between variables listed in Table 1 and the dispersion index.
Variables Cf VRPM Qfeed Vus ␣us Amps Tmelt P1 P2 P3 Pus
Correlation coefficient ⫺0.13 0.22 ⫺0.57 0.009 ⫺0.39 ⫺0.65 ⫺0.29 ⫺0.54 ⫺0.48 ⫺0.51 ⫺0.56
TABLE 3. Errors on the estimates of dispersion indices generated by three neural networks.
Neural network models max_mean rms_mean max_best5 Network with process control
variables as inputs (Fig. 2)
Temperature profile 1 0.0527 0.0117 0.0456 Temperature profile 2 0.0363 0.0093 0.0323 Network with extruder-dependent
non-ultrasonically measured variables as inputs (Fig. 3)
0.0631 0.0141 0.0548
Network with extruder-independent ultrasonically measured variables as inputs (Fig. 4)
This shows that the filler dispersion can be monitored rea-sonably well even without using ultrasound. However, since this network uses pressure profile in the melt channel as well as the amperage as inputs, and the pressure profile and amperage are determined by the status and configuration of the screw and barrel, this neural network model is also extruder-dependent. This means that the model is not trans-portable from one extruder to another, and it has to be recalibrated upon every change made to the screw and barrel. This calibration will require new experiments on the modified extruder and new SEM analysis of extrudates in order to establish a relationship between those measured input variables of the neural network and the quality of dispersion.
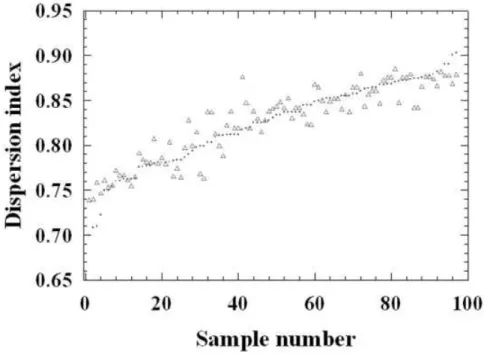
The neural network model depicted in Fig. 4 has pro-duced excellent estimates on dispersion indices, with an estimation error of less than 0.049. Figure 5 shows a com-parison between the estimated dispersion index generated by the neural network model of Fig. 4 and those measured with SEM. This network has produced better results than those provided by the non-ultrasonic measurements shown in Fig. 3. This suggests that ultrasonic measurement is more sensitive to the state of dispersion than the pressure and amperage measurements. In fact, unlike the ultrasonic mea-surement, the pressure and amperage can only provide in-formation on process conditions which dictate the final state of the filler dispersion rather than measuring directly the state of filler dispersion itself. Since all the inputs of the ultrasonic network model shown in Fig. 4 are related solely to the status of the melt at the probed location, this model is extruder-independent and transportable to other extruders of the same or different types and sizes. The transportability is the most important feature of the ultrasonics-based models.
Since the establishment of these models require large amount of calibration work, the transportability means enor-mous savings of resources in the future for model develop-ment once the models have been successfully established and this makes the models practically useful for in-line monitoring of filled-polymer extrusion processes. However, it should be pointed out that, like any expert or database systems, the neural networks do not generate more knowl-edge than what they received during training. In order to apply neural networks successfully, the user has to make sure that the input variables fall in the ranges in which the networks have been trained. It is also important to remem-ber that the network is valid only for the material system for which it has been trained, although the approach could be generalized to other material systems.
CONCLUSION
In this work, three artificial neural networks have been established and tested for the determination of the disper-sion of calcium carbonate powder in a polypropylene ma-trix. Among the three networks, one uses process control variables as inputs, one uses extruder-dependent measured variables as inputs, and the remaining one uses ultrasonic measurement data as well as other extruder-independent measured variables as inputs. All of the three networks performed well in the estimation of filler dispersion index. However, neural network models with ultrasonic measure-ment data as inputs are most promising for in-line monitor-ing of filler dispersion owmonitor-ing to their transportability. This study has demonstrated the feasibility of using ultrasound and neural networks together for in-line monitoring of
dis-FIG. 5. Comparison between measured (dots) and the average of 5 estimated dispersion indices produced by 5 best-performed networks (triangles).
persion during extrusion processes of mineral-charged poly-mers.
REFERENCES
1. B.M. Mutagahywa and D.A. Hemsley, Plast. Rubb. Process.
Appl., 5, 219 (1985)
2. Y. Suetsugu, Int. Polym. Process., V, 184 (1990).
3. L. Ave´rous, J.-C. Quantin, and A. Crespy, Compos. Sci.
Tech-nol., 58, 377 (1999).
4. M. Appello, Plast. Rubb. Compos., 29, 207 (2000).
5. P.P. Sukhanov, A.E. Zaikin, and V.S. Minkin, Int. Polym. Sci.
Technol., 16, T15 (1989).
6. S. Okuda and K. Fujisawa, Proc. Mech. Behav.
Mater.–Con-ference VI, Kyoto, Japan, 671 (1991).
7. R. Gendron, L.E. Daigneault, J. Tatiboue¨t, and M.M. Dumou-lin, Adv. Polym. Tech., 15, 111 (1996).
8. Z. Sun, C.-K. Jen, C.-K. Shih, and D. Denelsbeck, Polym.
Eng. Sci., 43, 102 (2003).
9. J. Tatiboue¨t and M.A. Huneault, Int. Polym. Process., XVII, 49 (2002).
10. S. Haykin, Neural Networks: A Comprehensive Foundation, 2nd ed., Prentice Hall, Upper Saddle River, NJ (1999). 11. D. Binet, “Quantification de la dispersion d’une charge
mine´rale et d’un polyme`re extrude´s par les re´seaux de neurones,” Master’s thesis, Univ. Sherbrooke (Quebec), Canada (1996).
12. R. Gendron and D. Binet, J. Vinyl Addit. Technol., 4, 54 (1998).
13. J. Tatiboue¨t, A. Hamel, and L. Piche´, Proc. Polym. Process.
Soc. 15th Annual Meeting, s’Hertogenbosch, The Netherlands (1999).