Vous avez des questions? Nous pouvons vous aider. Pour communiquer directement avec un auteur, consultez la
première page de la revue dans laquelle son article a été publié afin de trouver ses coordonnées. Si vous n’arrivez pas à les repérer, communiquez avec nous à [email protected].
Questions? Contact the NRC Publications Archive team at
[email protected]. If you wish to email the authors directly, please see the first page of the publication for their contact information.
https://publications-cnrc.canada.ca/fra/droits
L’accès à ce site Web et l’utilisation de son contenu sont assujettis aux conditions présentées dans le site LISEZ CES CONDITIONS ATTENTIVEMENT AVANT D’UTILISER CE SITE WEB.
READ THESE TERMS AND CONDITIONS CAREFULLY BEFORE USING THIS WEBSITE.
https://nrc-publications.canada.ca/eng/copyright
NRC Publications Archive Record / Notice des Archives des publications du CNRC :
https://nrc-publications.canada.ca/eng/view/object/?id=a099cd00-12e2-4cd4-9857-525454508507 https://publications-cnrc.canada.ca/fra/voir/objet/?id=a099cd00-12e2-4cd4-9857-525454508507
NRC Publications Archive
Archives des publications du CNRC
Access and use of this website and the material on it are subject to the Terms and Conditions set forth at
First-year ridge loads on Norströmsgrund lighthouse Sudom, Denise; Frederking, Robert
First-year ice ridge loads at Norströmsgrund lighthouse
Denise Sudom, Louis Poirier and Robert Frederking
National Research Council Canada Ocean, Coastal & River Engineering NRC OCRE
First-year ice ridge loads at Norströmsgrund lighthouse: Overview
• Why study ice ridges and loading?
• Norströmsgrund as a platform for
investigation (LOLEIF and STRICE)
• Details of selected ridge interaction
events
• Local and global loads on structure
• Comparison with global loads
predicted using ISO 19906 Standard
Ridged ice interaction with lighthouse on 4 April 2003 at 17:35; courtesy of STRICE project
Application of ridge properties for load calculation
• For offshore structures: total ridge thickness and ridge strength for multi-year ridges; consolidated layer thickness, keel properties
(friction angle, porosity, cohesion) and possibly ridge width for a first-year ridge
• For the shipping industry: ridge size and consolidated layer thickness • For subsea installations: keel properties (depth, geometry,
consolidation and cohesion)
Norströmsgrund lighthouse location and ice conditions
• Ice from February – April
• Average level ice
thickness up to ~ 0.6 m
• Ridges with keels up to
8 m, or greater
Norströmsgrund lighthouse instrumentation for LOLEIF and STRICE projects
• Nine load panels measuring total load on 1.2 x 1.6 m areas (one with 8 segments/sub-panels), covering 162°
• Tiltmeter measuring angular change – give indication of keel loads?
• Upward-looking sonar (ULS) for ice draft
• Electromagnetic (EM) device for ice thickness (underestimates keel depth by a factor of 2 to 3) • Laser and sonic devices for ice surface profile • Ice observer log books – very important for
notes on ridge interaction events, ice drift direction and other details
Haas & Jochmann, 2003 Sudom & Frederking, 2014
Selection of events for detailed analysis
• Ice observer notes
• Keels as measured by ULS (≥ 4 m) or EM (≥ 2 m)
• Period of level ice before or after ridge
• Loading from east or east-northeast, so that panels
captured most of load
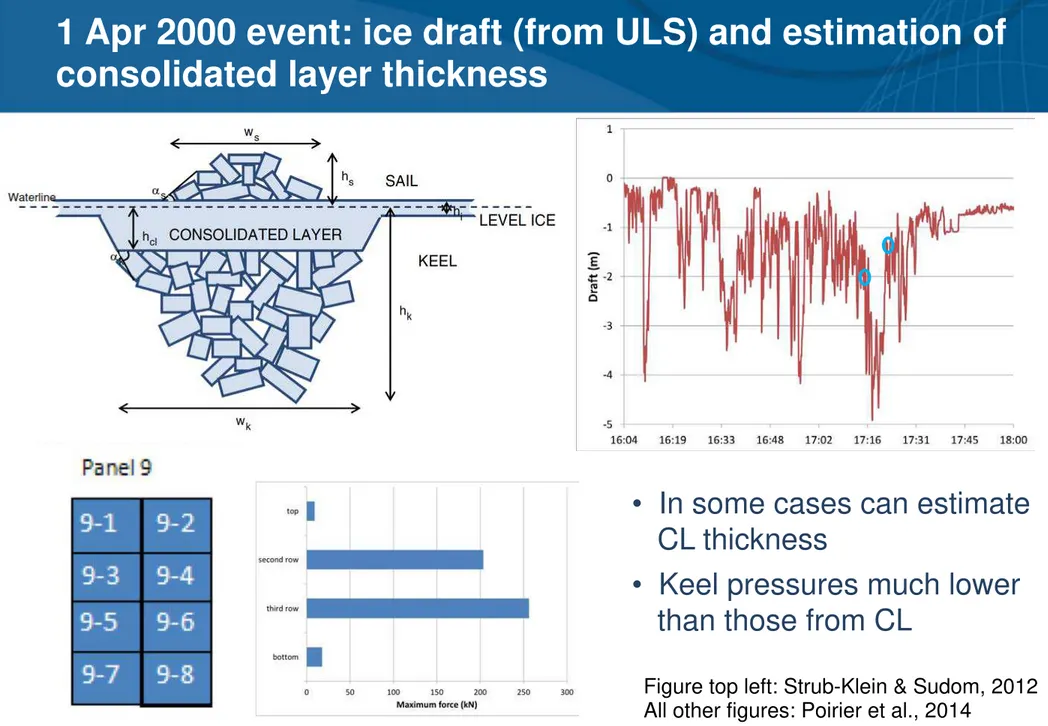
1 Apr 2000 event: ice draft (from ULS) and estimation of consolidated layer thickness
• In some cases can estimate
CL thickness
• Keel pressures much lower
than those from CL
Figure top left: Strub-Klein & Sudom, 2012 All other figures: Poirier et al., 2014
0 10 20 30 40 50 60 70 80 90 0 1000 2000 3000 4000 5000 6000 19:00 19:05 19:10 19:15 19:20 T ilt , 7 s mo vi n g a ve ra g e (m icr o ra d ia n s) Pa n e l fo rce (kN ) Time -3 -2 -1 0 1 2 19:00 19:05 19:10 19:15 19:20 Ice t h ickn e ss (m) Time 9 May 2002
• Large ridge field; dynamic
event
• Ice draft from EM
• CL up to 1.2 – 1.5 m thick
• Some sail/upper load missed,
but little keel load missed
• One of highest load events
measured by panels (5.5 MN)
• Good correlation of tilt and
panel loads, when tilt is
filtered with moving average
• If 12 kN/µradian conversion
factor (Frederking 2005) is applied, peak global load is >13 MN
9 May 2002: tilt analysis
• Oscillations of the raw tilt data during 15 seconds of the peak event load in the x
(to the north) and y (to the west) directions.
• Spectral density analysis shows 2 dominant frequencies ~ 0.8 Hz and 2.7 Hz.
• VBB (1989): for the fundamental structural (cantilever) mode of the lighthouse, the
predominant frequency of vibration is about 2.32 to 2.35 Hz; the lighthouse amplifies its own vibrations.
3 Apr 2002
• Single ridge; slow loading
event
• Consolidated layer (CL)
estimated at 1.1 m
• Some keel load missed
(high loads on lower
panels) and load on south side
• Should be good event for
checking tilt; tilt load should be higher than panel load
• Tilt load (converted) is
only ¼ of panel load
-3 -2 -1 0 1 17:40 17:50 18:00 18:10 18:20 18:30 Ic e th ic k n e s s (m ) 0 200 400 600 800 1000 1200 1400 1600 1800 17:40:00 17:50:00 18:00:00 18:10:00 18:20:00 18:30:00 Pa n e l f o rce (kN ) Time
4 Apr 2002
• Ridge field with 2 distinct
keels
• First event had shallower
keel but higher loads (was full keel captured by EM footprint?)
• Segmented panel indicates
that some load was missed below panels
• Some load on southern part
of lighthouse may also have been missed
• Level ice load same
magnitude as ridge load
• Tiltmeter indicates low load
levels -4 -3 -2 -1 0 1 01:00 01:10 01:20 01:30 01:40 01:50 02:00 Ic e th ic k n e s s (m ) Time 0 200 400 600 800 1000 1200 1400 01:00 01:10 01:20 01:30 01:40 01:50 02:00 Pa n e l fo rce (kN ) Time
6 Mar 2002: horizontal distribution of ice ridge pressures
• Top: ice forces
measured on individual panels at various points in time during one day of unconsolidated
rubbled ice interaction (somewhat parabolic distribution)
• Bottom: average
loading on panels
during various events (15 to 60 s durations)
Global loads measured by load panels and inferred from tilt meter
• For the ridge events studied, global loads of 1.2 to 5.5 MN
were measured by the panels ridges and ridge fields
cause the highest loads experienced on the lighthouse
• Panels often miss part of load
• Ice loads from parent (surrounding) level ice sheet were
0.5 to 1.4 MN
• In general, ridged ice loads are 2 – 5 times higher than
those from the parent level ice sheet (for both the panels and tiltmeter)
Load contribution from loose rubble or ridge keel
• Panels capture most of
consolidated layer (CL) load, but what about keel load?
• In some cases the segmented
panel indicates negligible
loads on the lower subpanels => keel load is much lower than that from CL
• For keels of 4 m or greater
depth, load contribution is still significant
Figure, top: Strub-Klein & Sudom, 2012 Bottom: Poirier et al., 2014
Load contribution from loose rubble or ridge keel
• 6 March 2002: structure interaction with broken ice rubble
results in lower loads than with ridges
• Average normal force over panels for time periods of interaction
Small consolidated layer likely for ridges
• Water level 0.23 m above top of panels, so panels mostly
capture keel load
• with known features gives indication of an average global load
16 Feb 2003: Horizontal distribution of ice rubble loads around lighthouse circumference
• Early season events –
consolidation unlikely
• Rubble loads could be
similar to those from unconsolidated keels
• Ice forces measured on
individual panels at various points in time during one day of
unconsolidated rubbled ice interaction
(somewhat parabolic distribution)
Comparison of global loads predicted using ISO 19906 Standard, and range of possible input parameters
• For consolidated layer: ISO 19906 uses an empirical equation for level ice crushing; takes into
account the ice pressures measured at Norströmsgrund
• For keel: ISO 19906 uses Dolgopolov (1975) analytical method for load calculations, which treats
the structure as having a flat face; modifications for cylindrical structure would be useful
• More work on keel loads needed – little field data available. Canadian experience: Molikpaq data
indicates fairly high FY ridge keel pressures (0.3 MPa, double the value calculated above); Confederation Bridge data indicates negligible keel loads (but for conical shaped piers)
0 5 10 15 0 0.5 1 1.5 Fc (MN ) hc(m)
Consolidated layer strength = level ice sheet strength 25% reduced strength for consolidated layer 0 1 2 3 2 3 4 5 6 7 8 Fk (MN ) hk(m)
Lower accepted limits Upper accepted limits
Range of measured values at Norströmsgrund from several dozen ridge events
Interpreted values from one February day of unconsolidated ridge/rubble interaction at Norströmsgrund, based on peak rubble loads at waterline extrapolated over keel depth and assuming linear load decrease with depth
Acknowledgments
This work was supported by the ColdTech project
(Norwegian Research Council project number 195153) and by the NRC Arctic Program. The data presented were
collected for the STRICE and LOLEIF projects. The authors would like to thank Peter Jochmann and Lennart Fransson for their encouragement and support of publishing this work.
Visit our Website :
www.nrc-cnrc.gc.ca/eng/rd/ocre
Thank you
Denise SudomResearch Council Officer Tel: +1 613-949-4651
[email protected] www.nrc-cnrc.gc.ca