IdEP Economic Papers
2014 / 02
L. Di Giorgio, M. Filippini, G. Masiero
The relationship between costs and quality in
nonpro…t nursing homes
L. Di Giorgio
M. Filippini
yG. Masiero
zMarch 2014
Abstract
We investigate the relationship between costs and quality in non-pro…t nursing homes, a key issue in the present context of cost contain-ment measures. In accordance with the economic theory of production, we estimate a three-inputs total cost function for nursing home ser-vices using data from 45 nursing homes in Switzerland between 2006 and 2010. Quality is measured by means of clinical indicators regard-ing process and outcome derived from the Minimum Data Set. We consider both composite and single quality indicators. Contrary to previous studies, we use panel data and control for unobserved het-erogeneity. This allows to capture nursing homes speci…c features that may explain di¤erences in structural quality or costs levels. We …nd evidence that poor levels of quality regarding outcome, as measured by the prevalence of severe pain and weight loss, lead to higher costs. Our results are robust to quality endogeneity concerns.
Keywords: nursing home costs, nonpro…t, quality indicators, cost-quality tradeo¤
JEL classi…cation: I10, L3.
Institute for Health Metrics and Evaluation (IHME), University of Washington, United States; Institute of Economics (IdEP), Università della Svizzera italiana (USI), Switzer-land. Corresponding author. E-mail address: [email protected]. We thank Andrew Street for helpful comments and invaluable advice during my stay with the Policy team at the Center for Health Economics at the University of York. Also, we thank the Swiss National Science Foundation for …nancial support to the project. Any mistake is clearly our fault.
yInstitute of Economics (IdEP), Università della Svizzera italiana (USI); Swiss Federal
Institute of Technology in Zurich (ETHZ), Switzerland.
zDepartment of Engineering, University of Bergamo, Italy; Institute of Economics
1
Introduction
Ensuring good quality of care to nursing home (NH) residents is a major concern in many health care systems. Actions to boost quality must take into account cost containment measures required to manage increasing health expenditures and ageing population. This twin objective of the NH sector - high quality and a¤ordable costs - calls for better understanding of the potential trade-o¤ between costs and quality. Quality aspects need to be integrated in the empirical evidence of NH costs.
The literature on NH costs is extensive, but marginally addresses quality of care. Most of the studies do not include measures of quality. Some of them use imprecise or indirect measures, such as the number of de…ciency citations, information about sta¢ ng or mortality rates. Others rely on modeling quality as a latent variable (Gertler and Waldman, 1992; Carey, 1997). Finally, the majority of these studies use cross-sectional designs and do not account for unobserved heterogeneity that may a¤ect both costs and quality. Concerns arise because failure to account for quality in cost functions is responsible for omitted variable bias (Braeutigam and Pauly, 1986). This bias is even more severe when comparing individual e¢ ciency levels, as these techniques are particularly sensitive to model misspeci…cation (Newhouse, 1994; Cremieux and Ouellette, 2001).
Donabedian (1988) conceptualizes the measurement of quality in the NH sector in terms of three dimensions: Structure, Process and Outcome (SPO). The SPO framework is widely accepted in empirical analyses of quality. In-ability to include information about these three dimensions of care are due to measurement de…ciencies and limitations in data availability. Recently, the introduction of the Resident Assessment Instrument (RAI) in the U.S. and some European countries, started a comprehensive and multidimensional assessment of all NH residents health status. These data, also called Min-imum Data Set (MDS), are used to develop a battery of clinical indicators of quality that meet the taxonomy of the SPO model (Zimmerman, 1995; 2003). These indicators are categorized in two groups: indicators of quality regarding process and indicators of quality regarding outcome of care. As such, they o¤er a unique tool to measure and compare quality of NHs in di¤erent domains of care (Berg et al., 2012). However, NH cost studies using clinical quality indicators generally neglect the relationship between
di¤er-ent quality dimensions. More e¤ort is needed to understand whether the multidimensional nature of quality is better captured by single or combined quality indicators.
A positive relationship between costs and quality is generally expected when higher levels of quality can be provided only through more costly equip-ment or additional sta¤ employequip-ment. However, adverse patient events may be costly to treat because they involve additional resource utilization for ex-tra care. The relationship between costs and quality may therefore depend on the dimension considered. Better procedures are expected to increase costs, while prevention of development of adverse outcomes may actually reduce costs (Weech-Maldonado et al., 2006; Wodchis et al., 2007).
Through this paper, we investigate the relationship between quality and costs in NH care and contribute to the existing literature in four main re-spects. First, we use a cost function approach consistent with the economic theory of health care production. Second, we incorporate quality measures into the cost function based on the taxonomy of the SPO model, and dis-entangle the impact of di¤erent dimensions of quality on costs. Third, we conduct our analysis using both composite and single measures of quality. Finally, to our knowledge, this is the …rst study providing evidence on the relationship between costs and quality in NH care using panel data, if we exclude the approach by Wodchis et al. (2007) which does not specify a cost function.
The remainder of the paper is organized as follows: Section 2 outlines how quality for NH services can be measured and presents the SPO framework more in detail. Section 3 reviews previous studies on the relationship between costs and quality. Section 4 describes the dataset and discusses the choice of quality indicators and the empirical strategy. Estimation technique and results are presented in Section 5. Finally, some concluding remarks are provided in Section 6.
2
Quality
2.1
De…nition and measurement
No universal de…nition of quality exists in health research. The Institute of Medicine (IOM, 2001) states that “quality of care is the degree to which
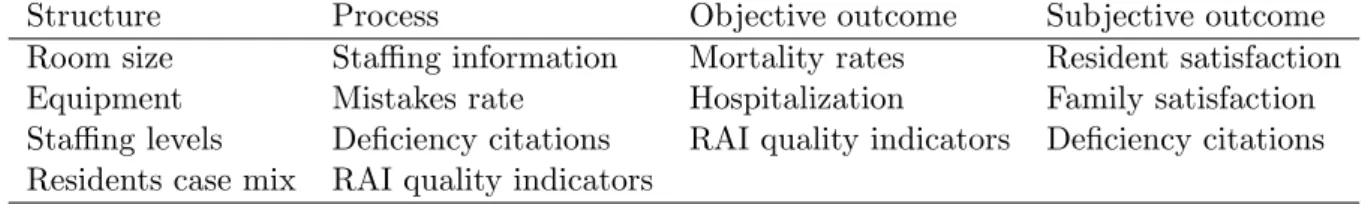
health services for individuals and populations increase the likelihood of de-sired health outcomes and are consistent with current professional knowl-edge”.1 This de…nition has signi…cantly in‡uenced the literature on quality and is very much related to the paradigm of quality proposed by Donabedian (1988). His seminal article on the assessment of quality of care represents the foundation of modern quality assessment, providing a framework of reference with guidance validity. Donabedian proposed the so called SPO framework. Structure is de…ned by the attributes of the setting in which care is provided, such as material resources (e.g. equipment), human resources (e.g. sta¢ ng levels) and organizational structure (e.g. payment system). Process refers to the activities of practitioners to give care, such as making a correct diagnosis and implementing the treatment accordingly. Outcome de…nes the change in health status of the patient. The success of this paradigm lies in its broad scope, which encompasses older and newer de…nitions of quality. Table 1 shows how di¤erent measures of quality used in the literature fall within the dimensions of the SPO framework.
With the development of quality indicators derived from the RAI, clinical measures of quality regarding process and outcome are now available. How-ever, only a few countries have adopted the RAI. Many countries use di¤erent systems to measure quality in the NH sector (Nakrem et al., 2009). Each measure of quality has advantages and disadvantages, which are discussed below. Some relatively old indicators (non-clinical) are still considered valid and are often combined in empirical studies with clinical quality indicators derived from the RAI.
Previous studies attempt to capture NH quality di¤erences mainly using indicators of structure or indirect signals. Probably, the most recognized indicator with current validity is the number of de…ciency citations (Castle and Ferguson, 2010). De…ciency citations have the advantage of representing di¤erent dimensions of reduced quality but su¤er from detection bias due to high variability in the use of citations among states/countries. Another important indicator that is employed extensively in the literature is the use of resources, in particular, information on sta¢ ng. While earlier studies focus
1Other well recognized de…nitions are provided by the UK Department of Health (1997),
the Council of Europe (1997), and the WHO (2000). For a detailed exposition of the most in‡uential and known de…nitions of quality, see Legido-Quigley et al. (2008).
on sta¢ ng levels as determinant factors (McKay, 1989; Farsi et al., 2005; Farsi et al., 2008), recent studies recognize the need to extend this dimension to sta¤ characteristics, such as sta¤ turnover, worker stability and skill levels (Castle and Engberg, 2005; Castle and Engberg, 2007; Dormont and Martin, 2012; Spilsbury et al., 2011), as well as willingness of leadership (Rantz, 2004). A recent systematic review of Bostick et al. (2006) shows not only evidence of association between higher licensed sta¤ and quality, but also a signi…cant relationship between sta¤ turnover and quality indicators such as pressure ulcers, weight loss and functional ability.
2.2
Concerns about quality indicators
The advantages and disadvantages of quality indicators based on the SPO model are discussed in Castle and Ferguson (2010). Structural indicators have the advantage of being easy to measure and data are often available. The disadvantage is that the presence of structural attributes does not imply their best use. Castle and Ferguson (2010) maintain that structural quality indicators are necessary but not su¢ cient. Indicators of process are usually easy to interpret as they inform on the provision of a particular treatment. Even in this case, it cannot be determined whether or not the provided treatment is appropriate. Finally, outcome indicators are of natural interest, as they measure the change in patients’ health status. The main problem with these indicators is that it is extremely di¢ cult to isolate the e¤ect of care and changes in health, as the latter may be in‡uenced by many uncontrolled factors.
The recent development of clinical quality indicators has improved the measurement of quality, but with some limitations. Firstly, due to the ab-sence of a universally accepted de…nition of quality, the selection of quality indicators to include in empirical analyses is, to some extent, arbitrary. This is an issue because of the usually low correlation among quality indicators. Indeed, facilities with excellent outcomes in some dimensions may perform poorly in others. The choice of indicators may therefore a¤ect the percep-tion of NH quality. Secondly, detecpercep-tion bias occurs if higher quality NHs are the more vigilant in looking for and detecting quality issues (Mor et al., 2003). Since NH sta¤ rather than an independent authority assesses residents health status, risk of detection bias exists. Thirdly, variation in clinical
qual-ity indicators may be due not only to changes in qualqual-ity, but also in risk or error (Arling et al., 1997). To cope with this issue, di¤erent risk-adjustment techniques are used. While …rst studies of NH quality mainly use adjust-ment methods at the facility level (Nyman, 1988; Zinn et al., 1993a; 1994), more recently risk-adjustment is performed at the individual level when data are available. Di¤erent approaches include strati…cation, covariate models (Mukamel, 1997) and standardization (Zinn et al., 1993b). For some clinical indicators of quality that are considered particularly relevant in detecting the presence of problematic cases of quality shortcomings, no risk-adjustment is required. Among these are the presence of daily physical restraints (Berg et al., 2002), dehydration and fecal impaction (Arling et al., 1997; Karon et al., 1999). The main issue of risk-adjustment techniques is that they may only partially capture residents risk factors, resulting in biased estimates of qual-ity coe¢ cients (Mukamel et al., 2008). Risk-adjustment is also of concern when risk-adjustment factors are themselves a function of quality. In these cases, quality scores could be over-adjusted, giving credit for poor quality (Mukamel et al., 2008).
3
Empirical evidence on the impact of quality
on costs
Empirical models using non-clinical quality measures mainly focus on the impact of speci…c factors on costs, such as market structure, forms of orga-nization, or reforms implemented in the NH sector. Quality measures are usually introduced as control factors. Some of these studies use sta¢ ng in-formation (e.g. Di Giorgio et al., 2014; Dormont and Martin, 2012; Farsi et al., 2008; Konetzka et al., 2004) or de…ciency rates (e.g. Harrington et al., 2001). Another strand of literature exploits determinants of quality vari-ability. Factors considered include the impact of state regulations (Bowblis et al. , 2012; Bowblis and Lucas, 2012), ownership form (Grabowski et al., 2013; Spector et al., 1998), competition (e.g. Brekke et al., 2010; Castle et al., 2008; Forder and Allan, 2011; Grabowski, 2004; Starkey et al., 2005) and …nancial performance (Gutacker et al., 2013).
We focus our review on studies that use clinical indicators derived from the RAI to investigate the relationship between costs and quality. The main
contribution of these studies is summarized in Table 2, where details on the choice of quality indicators, the empirical approach and the results are presented.
Mukamel and Spector (2000) is one of the …rst studies investigating the re-lationship between costs and quality using the RAI-derived quality indicators. The authors estimate a variable cost function for NHs in New York State. Three indicators of outcome quality are included: activity of daily living, pressure ulcers and mortality. Regression-based risk adjustment (Mukamel, 1997) is applied and weighted ordinary least-squares are used to tackle the issue of di¤erent sample size in the calculation of outcome variables.2 The
authors report an inverted U-shaped relationship between costs and quality, although only few coe¢ cients are statistically signi…cant. The loss of statis-tical signi…cance is attributed to high multicollinearity among higher-order terms of quality indicators. Due to the availability of only weak instruments, the endogeneity issue of quality is ignored.
An important contribution to the cost-quality relationship is provided by Laine et al. (2005a, 2005b) who implement stochastic frontier models. In these studies, endogeneity of quality is not addressed. The …rst study models a stochastic production frontier for the Finnish long-term care sector in 2001 where the dependent variable is speci…ed as the case-mix weighted patient days and covariates include only input characteristics. Ward characteristics and quality are modeled following Battese and Coelli (1995), i.e. techni-cal ine¢ ciencies are speci…ed as a function of quality indicators. Quality is measured linearly by three continuous indicators: the prevalence of high-risk pressure ulcers, the prevalence of weekly use of depressants and hypnotics, and the prevalence of depression with no treatment. The latter two indi-cators are not risk adjusted. The prevalence of pressure ulcers is the only quality indicator signi…cantly associated with technical ine¢ ciency. The sug-gested relationship is that higher prevalence of pressure ulcers leads to higher technical e¢ ciency.
Laine et al. (2005b) provide a similar cross-sectional analysis which shifts the focus from productive e¢ ciency to cost e¢ ciency. The analysis is per-formed using data at the ward level obtained aggregating individual-level data. The authors include quality indicators regarding process, i.e. the
prevalence of depression without treatment and prevalence of pressure ulcers adjusted for risk, in the deterministic part of the cost frontier. Indicators of output quality, i.e. the prevalence of depressants and hypnotics use and the prevalence of restraint use, are modeled following Battese and Coelli (1995). The mean values of the indicators over a three-years period is taken without risk adjustment. The underlying idea is to allow indicators of process qual-ity to a¤ect the production process itself, while the outcome is restricted to have an impact on the level of ine¢ ciency. The results show that a worse outcome in terms of higher prevalence of pressure ulcers is associated with higher costs, while poor process quality measured by the weekly use of de-pressants and hypnotics is associated with higher ine¢ ciency. However, the impact of these quality indicators is relatively low.
Weech-Maldonado et al. (2006) investigate the impact of quality on costs in U.S. NHs. Using cross sectional data from around 750 facilities, they test the inverted U-shaped theory by adding squared and cubic terms of qual-ity. Quality is measured by changes in physical and psychological outcome indicators, i.e. worsening pressure ulcers and mood decline. Indicators are adjusted for risk using the covariates model (Mor et al., 1998). A weighted two-stage least squares regression is estimated to address endogeneity of qual-ity indicators. Socio-demographic characteristics at the county level as well as the presence of alternative service providers are used as instruments for quality scores. However, the validity of these instruments is not tested. The results show an inverted U-shaped relationship between costs and pressure ulcers. An opposite pattern arises for mood decline, showing that di¤erent indicators of quality may lead to di¤erent types of relationships.
Additional evidence based on data from Ontario, Canada, is provided by Wodchis et al. (2007). The authors estimate individual-e¤ects mod-els where total costs are regressed on output, labor price, some exogenous variables and quality indicators adjusted for risk using a resident-level co-variates model.3 Heteroskedasticity, autocorrelation and endogeneity issues are discussed. However, due to the lack of a valid instrument, endogeneity is ignored. The analysis shows a negative relationship between costs and use of daily physical restraints, as well as worsening incontinence. Antipsychotic use, the prevalence of pressure ulcers and the prevalence of severe pain are
not statistically signi…cant.
Most of the studies presented above …nd correlation between some quality indicators and costs. However, the association is weak and the approaches used are hardly comparable. As suggested in the Introduction, the majority of these studies use a cross-sectional design and do not account for unob-served heterogeneity that may a¤ect both costs and quality. The only excep-tion is the study by Wodchis et al. (2007). Unobserved heterogeneity may represent a serious problem in analyses of costs-quality relationship due to the di¢ culty in measuring quality. If the risk-adjustment technique used in cross-sectional studies does not capture the facility-speci…c features perfectly, then the results may be biased. Also, only few studies address the potential endogeneity of quality, and virtually no test is provided on the validity of the instruments.
In the following section we propose an empirical approach to investigate the relationship between costs and quality using data from Swiss NHs. The main novelty of this approach is the inclusion of process and outcome quality measured by composite or single quality indicators into a cost function. As compared to previous studies, we are also able to control for unobserved heterogeneity by exploiting the panel structure of our data.
4
Model speci…cation and data
4.1
Choice of quality indicators
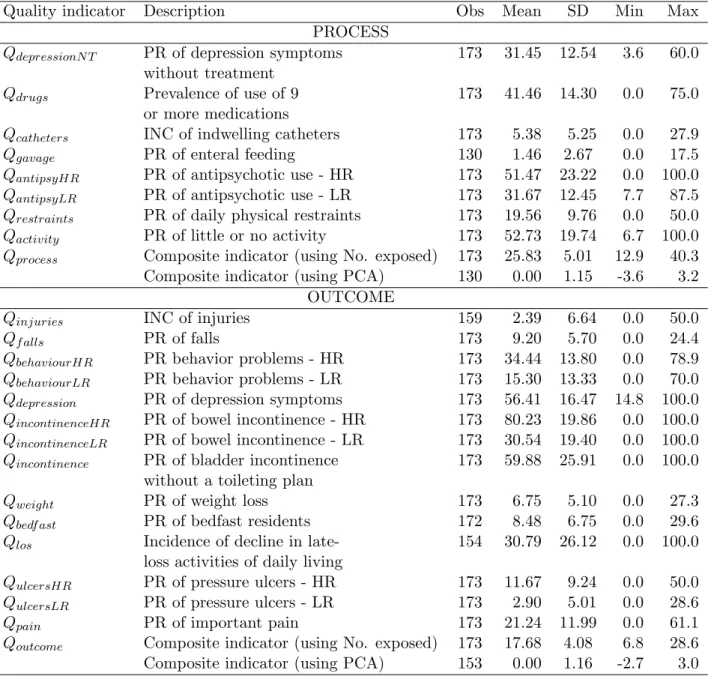
Quality indicators measure adverse events such as the use of antipsychotic drugs, injuries, bedfast residents, and pressure ulcers. To select appropri-ate quality indicators from the 22 available in our dataset we consider two approaches. The …rst approach combines quality indicators to obtain com-posite measures of process and outcome quality, which are then plugged into a cost function. The second approach is based on the selection of single qual-ity indicators of process and outcome directly included in the cost function. Clearly, both approaches have advantages and disadvantages.
Combining di¤erent quality indicators, as suggested for instance by the U.S. Institute of Medicine (2006), allows us to condense the multidimensional nature of quality, limit the number of variables included in an econometric model, and overcome possible arbitrariness in the choice of quality
indica-tors. Though, combining di¤erent quality indicators requires a weighting mechanism, which is subject to critics. Di¤erences in the number of eligible residents for di¤erent quality events across facilities may represent a seri-ous problem in obtaining a composite measure of quality. To overcome this problem, quality indicators can be adjusted before aggregation to increase comparability across facilities. The avoidable number of residents potentially exposed to di¤erent quality events may o¤er a valid solution for adjustment. A slighly more sophisticated approach relies on the generation of adjusted indicators using a principal component analysis (PCA). Still, composite mea-sure of quality makes it di¢ cult to identify the factors a¤ecting costs. To address this issue, we rely on Donabedian’s classi…cation of quality and de-rive separate composite indicators for both process and outcome. This allows us to identify the e¤ect of the two quality dimensions separately.
To derive composite indicators of process and outcome quality (Qprocess
and Qoutcome) we use two methods. First, we weight each quality indicator
by the number of residents exposed to a given quality event within each NH. The second approach applies a principal component analysis using all quality indicators to obtain two composite measures of process and outcome quality.4 This statistical procedure accounts for possible correlation between di¤erent quality indicators through an orthogonal transformation which obtains values of linearly uncorrelated quality indicators called principal components. Each succeeding component has the largest possible variance in the data. We look at the second principal component to get adjusted quality indicators which are then aggregated to derive composite measures of process and outcome quality.
As stated above, the second approach to select appropriate quality in-dicators is based on single quality inin-dicators. Single quality measures are probably more reliable and meaningful than composite measures. However, a selection process is needed to limit the number of indicators used in an econometric model. Our selection process is built on three strands of litera-ture. First, we consult the medical recommendations on the pertinence of the indicators to reveal quality issues in NHs. Second, we consider studies on the
4The large majority of our quality indicators include 173 observations. However, for
few of them information was collected only for two years. To maximize the number of observations used in the following econometric analysis, we dropped four single quality indicators with missing values (see Table 4 for details).
technical requirements that quality indicators need to satisfy to be included in empirical analyses. And …nally, we look at previous studies investigat-ing the relationship between costs and quality usinvestigat-ing the quality indicators analyzed by Zimmerman (1995).
From the medical literature we consult the numerous lists of recommended indicators to use in benchmarking analyses of NHs (Berg et al., 2002; Mor et al., 2003; Rantz et al., 2004). From the medical-statistical literature, we derive three main criteria that should be satis…ed for the empirical analysis (Berg et al., 2002; Laine et al., 2005b): a relatively large variation in the quality scores, the absence of multicollinearity between the indicators and other variables, and a relatively large number of observations from which the quality indicators are calculated. The issue of the denominator is motivated by statistical properties since some quality indicators capture the onset of rare events. In these cases, the relevant question is whether the observed frequency of the event can be considered as a “true score”, or it is driven by random shocks. Indeed, standard errors of rare events are large and gener-ate problems in the comparison of quality among facilities. The minimum number of observations for benchmarking is twenty (Berg et al., 2002).
Based on these criteria, we select two process quality indicators and two outcome quality indicators. The two indicators of process are the presence of antipsychotic use for low-risk residents (Qantips) and the presence of daily
physical restraints use (Qrestr). The two indicators of outcome include the
prevalence of weight loss (Qweight) and the prevalence of severe pain (QP ain).
Finally, we control for time-invariant quality aspects regarding the structure of NHs through the econometric speci…cation of the model (see section 5).
4.2
Detailing the cost function
In order to identify the impact of quality on costs, we consider a cost model which includes quality indicators as derived in section 4.1. Total costs are a function of output (Y ), measured by the number of patient-days of NH care, prices for labor, capital and material (Pl, Pk, Pm), the institutional form of
the NH (IF ), the case-mix of residents (M IX), the nursing sta¤ ratio (SR), a vector of process and outcome quality indicators (q), and a time trend ( )
which captures technological progress:5
C = f (Y, Pl, Pk, Pm, IF , M IX, SR, q, ). (1)
The price of labor is calculated as the weighted average wage of di¤erent professional categories employed in the NH (doctors, nurses, administrative and technical sta¤). We choose to include only one price of labor to avoid multicollinearity problems that typically arise with labor prices for di¤erent categories. The price of capital is calculated as the sum of mortgage costs, amortization and costs related to capital purchases divided by the capital stock, which is approximated by the number of beds. The price for material and meals is computed by taking the remaining costs and dividing them by the number of meals provided each year. This item mainly includes costs for food, energy and administrative costs.
The main di¤erence among nonpro…t NHs lays in their institutional form. Public-law NHs are public administrative units without a separate judicial status from the local public administration . Conversely, private-law NHs usually take the form of a foundation. Since the decision-making process may vary across institutional forms, we include a dummy for the institutional form (IF ) equal to one when the NH is a public-law organization, and 0 otherwise. SR is the nursing sta¤ ratio, i.e. the ratio between the number of nurses employed in a NH and the number of nurses that should be employed ac-cording to the guidelines of the regulator (optimal amount of sta¤). Because nursing care is a labor-intensive service, sta¢ ng levels have been recognized as a good indicator for (structure) quality (Bostick et al., 2006). Note, how-ever, that our indicator is conceptually di¤erent from other quality indicators related to sta¤ levels since it captures deviations from the optimal number of nurses.
The vector of process and outcome quality indicators (q) leads to three di¤erent model speci…cations. In Model 1, the quality vector includes two composite indicators (Qprocess and Qoutcome) derived from PCA. Similarly, in
Model 2 the quality vector is represented by two composite indicators de-rived using weights according to the number of residents exposed to di¤erent
5In a non-competitive environment such as the Swiss one, there is no reason to assume
that NHs minimize costs. In this case, the estimated costs function is a “behavioral cost function” (Evans, 1971) and can still be used to make a comparison among …rms.
quality aspects. Finally, Model 3 includes a vector of 4 single quality mea-sures: two process quality indicators - the prevalence of antipsychotic use for low-risk residents (Qantips) and daily physical restraints use (Qrestr) - and two
outcome quality indicators - weight loss (Qweight) and severe pain (Qpain).
Qantips is risk-adjusted based on the strati…cation approach, whereas
Qrestr is a sentinel indicator and as such no risk-adjustment is required (Berg
et al., 2002). Due to lack of data at the resident level, we further control for case-mix di¤erences using an index at the facility level (M IX). This index measures average patients’assistance need by means of normal daily activities such as eating, personal care or physiological activities and is cal-culated on yearly basis by the regulator. Patients are classi…ed in one out of …ve categories according to their severity level. A value between 0 and 4 is assigned where higher values indicate more severe cases.6 We expect this
case-mix indicator to be correlated with patients’ risk factors that are not observable. Moreover, any unobserved facility-speci…c risk factors feature is captured by the individual e¤ects. We acknowledge that the risk-adjustment system used in this analysis may be less precise than adjustments based on clinical information at individual level. However, as previously discussed, even complex systems of risk adjustments present serious shortcomings.
For the estimation of the cost model in (1), we use a log-log functional form. This implies that cost elasticities are not allowed to vary with output. When choosing the functional form, parsimony in the number of coe¢ cients to be estimated is traded o¤ against ‡exibility. A translog functional form would require interacting all quality indicators with the production factors. The number of parameters to be estimated would expand to (n + 1)(n + 2)=2, where n is the number of covariates, leading to an important loss of degrees of freedom.7
Input prices and total costs are divided by the material price in order to
6Note that this is not the RUG’s classi…cation system of residents. As compared to the
RUGs system, our case-mix measure is not derived from the MDS. The main advantage is that case-mix di¤erences are less likely to re‡ect quality levels.
7In a preliminary analysis, we also estimated: 1) a full-translog cost model and 2) a
hybrid translog cost model. In the hybrid translog cost function quality indicators were included only in linear form. The results of the full translog were not satisfactory, probably due to multicollinearity problems and the loss of degrees of freedom. The results of the hybrid cost function were very similar to those obtained with the log-log functional form.
satisfy the homogeneity condition in input prices.8 The log-log form of eq. (1) is: ln C Pm = 0+ Y ln Y + Plln Pl Pm + Pkln Pk Pm + IFIF (2) + M IXln M IX + SRSR + qq+ t + ",
where qis the vector of quality parameters, " is the error term which contains
individual e¤ects i. The individual subscript i and the time subscript t are
omitted for simplicity.
The estimation of the cost function in (2) is based on the assumption that output, input prices and quality are exogenous variables. In the case of NHs included in the sample, output is likely to be exogenous because NHs have to accept all residents in a given residential area and residents do not have free choice of the facility. Also, the excess of demand due to subsidized prices leads to occupation rates of about 100%. For the same reasons, also the case-mix is likely to be exogenous. Moreover, the reimbursement system is linked to the NH-speci…c case-mix, which limits incentives to attract less costly patients. Input prices can be considered exogenous because NHs have to follow the guidelines imposed by the regulator.
As with respect to quality, it is important to distinguish between the nursing sta¤ ratio and clinical quality indicators derived from the RAI. The nursing sta¤ ratio is strongly regulated by the canton and NHs are not allowed to deviate signi…cantly from the optimal sta¤ size. Therefore, we can exclude the presence of endogeneity.9 The potential endogeneity issue of unregulated
clinical indicators will be discussed later in section 5.
4.3
Data and descriptive statistics
We merge two datasets on costs and quality of NH residents in Southern Switzerland (canton of Ticino), which were provided by the regulator. The …rst dataset includes yearly use of resources at the organization level ex-tracted from the annual reports of NHs. It includes 45 NHs over a 10-years
8The cost function is linear homogenous of degree 1 in input prices when a 10% increase
in all input prices leads to a 10% increase in total cost.
9The Durbin-Wu-Hausman test performed using the lagged SR as instrumental variable
period, from 2001 to 2010. The second dataset contains information derived from the MDS on 22 quality indicators at the organization level for the period 2006-2010, excluding the year 2008. These indicators measure the presence of adverse events in the facility.10 Due to missing values in the dataset, no
quality scores are available for three NHs for the years 2006 and 2007. Com-plete data pertaining to 45 NHs observed over a 4-years period (2006, 2007,
2009 and 2010) are used. The total number of observations is 173 for the
models with composite quality indicators. For the model with single quality indicators we exclude observations with denominator of the quality scores smaller than 20. This leads to a loss of 10 observations.
In tables 3 and 4 we provide descriptive statistics for the main costs and quality variables. The data show that on average a resident day costs 247 Swiss francs (SFr.). The di¤erence between the minimum and the maximum cost is almost SFr. 200. This may be due to di¤erences in the output, as the number of resident days ranges between almost 9000 and more than 64000. The average resident case-mix is 3:1, with important di¤erences among NHs (0:80-3:83). The average price of labor is approximately SFr. 81000, and NHs are highly homogenous in this respect. The prices of capital and material show higher variation, from SFr. 1054 to almost SFr. 23000 and from SFr. 5:16 to around SFr. 103, respectively. These di¤erences are due to renova-tion or enlargement investments. At the approximarenova-tion point, the shares of capital, material and labor costs are 6:5%, 12:1% and 81:4%, respectively.
Regarding quality indicators, the data show that the nursing sta¤ ratio is very close to 1, as expected. Variations larger than 10% are possible only for very short periods. On average, 32% of low-risk patients use antipsychotics, but in some NHs this value reaches 88%, suggesting that serious problems may exists within the production process of NH care. The average prevalence of daily physical restraints use is around 20%, and ranges between 0and 50%. Regarding outcome quality, the average prevalence of residents who lost weight unexpectedly is about 7%, and this percentage ranges between 0 and 27%. Finally, the prevalence of residents su¤ering from severe pain is 21% on average, but reaches more than 60% in some cases.
10Four of these indicators are risk adjusted based on the strati…cation approach. This
means that they are calculated separately for high-risk and low-risk patients. In these cases, we use the low-risk indicators.
An interesting question is whether quality domains are correlated. This may a¤ect the selection process of appropriate composite quality scores as well as the choice of single quality indicators to be included in the economet-ric analysis. We compute the correlation among indicators (including the sta¤ ratio) and Kendall’s rank correlation coe¢ cient (Kendall, 1955). The latter measures the similarity of the ordering of NHs when these are ranked according to quality scores. Both measures indicate a very low correlation between quality indicators (< 25%). Furthermore, we are con…dent that the derivation of composite quality indicators using orthogonal components (Model 1) and the selection process of a small number of single quality in-dicators (Model 3) explained in section 4.1 ensure that collinearity between quality scores is not an issue in our regressions.
5
Econometric estimation and results
To analyze the impact of process and outcome quality on costs we use panel data models. The FE model treats the individual e¤ects as …xed parameters. These are allowed to be partially correlated with regressors, thus accommo-dating a limited form of endogeneity (Cameron and Trivedi, 2010). This feature is particularly appealing in studies of costs-quality relationship due to the potential endogeneity of the indicators. The Hausman test rejects the null hypothesis of no correlation between the individual-e¤ects and the covariates at 5% signi…cance level. Given that the percentage of within vari-ation of the variables of interest as with respect to the overall varivari-ation is satisfactory, the FE estimates should be fairly precise (Cameron and Trivedi, 2005). Therefore, the FE model represents our preferred estimator. The re-sults of the estimation of the three models with combined and single quality indicators described in section 4.2, are reported in Table 5.
Standard errors are corrected using the cluster-robust estimator based on Stock and Watson (2006) in all models. These authors show that the cluster-robust estimator is preferred in FE models if serial correlation is expected, and it is reasonable to rely on asymptotic theory. In our sample, each cluster contains a su¢ cient number of observations so that clustered standard errors are preferred (Kezdi, 2004).11
The estimated parameters are very similar across the three models. The coe¢ cient of output (Y ) is positive and smaller than 1, suggesting that an increase in output by 10% increases total costs by roughly 7%. As expected, more severe patients (M IX) are more costly to treat. The share of labor costs (Pl) is estimated at around 91%, while the estimated share of capital
(Pk) is between 6% and 7%. The form of organization (IF ) is dropped in
the FE regressions because of time invariance, whereas it does not seem to a¤ect total costs in the OLS and the RE regressions.
Consider now the main variables of interest: quality indicators. The nursing sta¤ ratio (SR) is highly signi…cant. As expected, the higher the relative number of nurses working in a NH, the higher the costs. The esti-mated coe¢ cient is stable across the three models. In Model 1 and Model 2, we consider two composite quality indicators (Qprocess and Qoutcome). Note
that outcome quality exhibits a positive and signi…cant e¤ect on costs in both models although the magnitude of the e¤ect is stronger when compos-ite quality indicators are derived using weights according to the number of residents exposed to di¤erent quality aspects (Model 2). Conversely, process quality shows an opposite (negative) e¤ect on costs, although the impact is not signi…cant. These results are in accordance with those obtained with single quality measures (Model 3). We observe a positive and signi…cant association between costs and outcome quality measured by the prevalence of weight loss (Qweight) and the prevalence of severe pain (Qpain). Instead,
process quality measured by the use of daily physical restraints (Qrestr) and
the prevalence of antipsychotic use for low-risk residents (Qantips) does not
seem to have a signi…cant impact on costs. The former indicator (Qrestr)
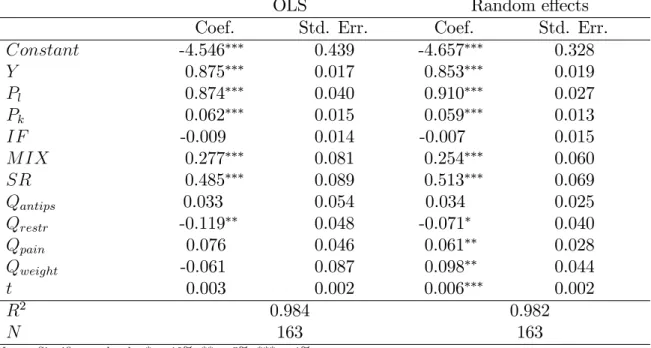
is, however, slightly associated with lower costs in OLS and RE regressions reported in Table 6.
The time trend (t) is statistically signi…cant in Models 2 and 3 but the coe¢ cient is very small. Total costs of NH care remained pretty constant over the time period considered in the analysis.
Generally, all the estimated parameters are very similar across di¤erent panel models, only slightly lower in the FE model. The OLS model does not
inference if the number of observations for cluster is not too small. A cluster is considered small if it contains less than …ve observations per cluster (Rogers, 1994). In our case, the signi…cance of the coe¢ cients remains unchanged when standard errors are clustered.
consider the unobserved heterogeneity. The similarity of the RE and the FE estimates suggests a low correlation between the individual e¤ects and our covariates.
5.1
Testing for endogeneity
We believe that, even in the unlikely possibility of quality endogeneity, the potential bias in our estimates is very limited. This is because of the in-stitutional setting of the NH sector and the strong regulation system. NHs activities are regulated by the local government in a relatively e¤ective way. Therefore, we can plausibly assume that NHs do not vary their levels of qual-ity according to the cost of services. Nonetheless, in order to test potential endogeneity, we consider instrumental variables approaches using the two-stage least squares (2SLS) procedure and the e¢ cient generalized method of moments (GMM) combined with the FE model. The GMM approach has the advantage of consistency in the case of arbitrary heteroskedasticity and shows higher ‡exibility than 2SLS, in particular to test the validity of the instruments. Both approaches come at the price of poor …nite sample perfor-mance, in particular in the case of weak correlation between the instruments and the endogenous variable.12 The GMM approach is preferred since it al-lows errors clustering for panel data and provides a battery of tests to check the validity of the instruments.
A valid instrument must satisfy two requirements: the instrument z must be correlated with the endogenous variable x, Cov(x; z) 6= 0, and uncorre-lated with the error term u, Cov(z; u) = 0. In the case of multiple endogenous regressors, the Shea partial R2 (Shea, 1997) measure should be used to test
the …rst condition, as this takes into account the intercorrelation among the instruments.13 However, this does not exclude the possibility of weak
instru-ments, which lead to a very high asymptotic bias. The second condition can be tested when there are more instruments for an endogenous variable. In
12In particular, the e¢ cient GMM approach may su¤er from poor …nite sample
proper-ties as the optimal weighting matrix of the e¢ cient GMM estimator is a function of fourth moments, which require large sample size (Hayashi, 2000).
13The F diagnostic for weak instrument for the joint signi…cance of the instruments in
…rst-stage regression does not recognize situations in which some instruments are good while others are weak.
this case, the C-statistic, also called “di¤erence-in-Sargan” statistic, can be used to test the orthogonality condition of a subset of instruments (Hayashi, 2000).
As shown in previous studies (Mukamel and Spector, 2000; Wodchis et al., 2007), good instruments for quality are lacking. Moreover, …nding good instruments for several quality indicators is also very challenging. We rely on three hypotheses. First, visits by residents’relatives exert pressure on the management sta¤ of the NH to keep adequate levels of quality. Hence, we identify two variables: the weighted average distance (travel time) between residents’location and the NH facility, and the weighted population density of the area served by the NH. The second hypothesis assumes that the quality o¤ered by the NH depends on the average quality o¤ered by surrounding NHs. We build a variable to capture pressure from other NHs located in geographical proximity. For each year and NH, pressure is measured as the average score of quality indicators of NHs located in neighbouring districts.14 Our third hypothesis is that the elderly population living in the area around the NH exercise an indirect pressure on quality of home care provided. We then consider the percentage of young, adult and elderly population in the catchment area of each NH. Finally, we also consider lagged values of quality indicators as natural instruments.15
Generally, our endogeneity tests do not reject exogeneity when using all or part of the instruments de…ned above both with composite and single quality indicators. However, the Shea partial R2statistics show that the
per-centage of variability in quality indicators explained by the instruments is relatively low. Since our instruments are likely to be weak we cannot be con…dent that the exogeneity of quality indicators is correctly assessed, and therefore the Hausman test may be distorted. However, as explained by Hahn et al. (2011), discussion about weak instruments is not completely clear in the econometric literature. As stated above, addressing endogeneity using
14The region considered in the analysis is divided into 8 districts: Mendrisio, Lugano,
Vallemaggia, Locarno, Bellinzona, Riviera, Blenio and Leventina. Given that only few NHs are located in northern districts, Vallemaggia, Leventina and Blenio are pooled together.
15Lagged values are an attractive instrument due to the high correlation with the
en-dogenous variable. Nevertheless, caution is necessary in the presence of serial correlation in the data, as this may invalidate the instruments (Angrist and Kruger, 2001). To test for autocorrelation in panel data set, we use the test developed by Wooldridge (Drukker, 2003; Wooldridge, 2002).
multiple quality indicators and many instruments may not be very e¢ cient. Consequently, we test exactly identi…ed models with only one quality indica-tor and one instrument. The null hypothesis that the excluded instruments are exogenous cannot be rejected in all these cases and the results are robust to weak identi…cation. Although we are not able to econometrically exclude that quality endogeneity is completely absent in the relationship between costs and quality in NH care, we show evidence that our FE estimates are unlikely to be a¤ected by quality endogeneity bias.
6
Conclusions
To ensure good quality of long term care while keeping costs under control, a better understanding of the relationship between costs and quality is needed. In the NH sector, quality improvements represent a main concern since the ageing of the population is putting the system under …nancial pressure.
In this paper, we investigated the relationship between costs and qual-ity according to the SPO-framework developed by Donabedian (1988). We used recently published data on quality indicators derived from the resident assessment instrument (RAI) and costs of Swiss NHs. In addition to struc-ture quality indicators (e.g. nursing sta¤ ratio), we considered composite and single measures of process and outcome quality. Composite indicators of process and outcome quality were obtained by aggregating 22 single quality indicators using i) NH-speci…c weights based on residents exposed to di¤er-ent quality aspects or ii) a principal compondi¤er-ent analysis. Alternatively, a limited number of single quality indicators capturing process and outcome quality was selected.
To disentangle the impact of di¤erent dimensions of quality on costs, we incorporated quality measures into a cost function. As compared to previous studies, we estimated individue¤ects models based on panel data that al-lowed to control for unobserved heterogeneity. Our analyses showed evidence of a positive and signi…cant relationship between clinical indicators of out-come quality (e.g. the prevalence of severe pain and the prevalence of weight loss) and total costs. Conversely, the impact of process quality indicators was unclear. For instance, higher prevalence of daily physical restraint use was associated to lower costs, while the use of antipsychotics was positively related to costs, but these e¤ects were only weakly signi…cant. Finally,
struc-ture quality indicators such as sta¢ ng levels were strongly associated with higher costs. We did not …nd evidence of quality endogeneity bias.
From a policy point of view, a correlation between costs and quality may suggest that quality aspects should be incorporated in funding schemes de-signed for NH care. Accounting for this correlation may allow the regulator to re…ne economic incentives taking into account the trade-o¤ between quality and costs.
References
Angrist JD, Krueger AB. 2001. Instrumental variables and the search for identi-…cation: From supply and demand to natural experiments. Journal of Economic Perspectives 15(4): 69-85.
Arling G, Karon SL, Sainfort F, Zimmerman DR, Ross R. 1997. Risk adjustment of nursing home quality indicators. The Gerontologist 37(6): 757-766.
Battese GE, Coelli TJ. 1995. A model for technical ine¢ ciency e¤ects in a sto-chastic frontier production for panel data. Empirical Economics 20: 325-332. Berg K, Mor V, Morris J, Murphy KM, Moore T, Harris Y. 2002. Identi…cation and evaluation of existing nursing homes quality indicators. Health Care Financing Review 23(4): 19-36.
Bostick JE, Rantz MJ, Flesner MK, Riggs CJ. 2006. Systematic review of studies of sta¢ ng and quality in nursing homes. Journal of the American Medical Directors Association 7(6): 366-376.
Bowblis JR, Crystal S, Intrator O, Lucas JA. 2012. Response to regulatory strin-gency: the case of antipsychotic medication use in nursing homes. Health Eco-nomics 21: 977-993.
Bowblis JR, Lucas JA. 2012. The impact of state regulations on nursing home care practices. Journal of Regulatory Economics 42: 52-72.
Braeutigam RR, Pauly MV. 1986. Cost function estimation and quality bias: the regulated automobile insurance industry. RAND Journal of Economics 17: 606-617.
Brekke KR, Siciliani L, Straume OR. 2010. Price and quality in spatial competi-tion. Regional Science and Urban Economics 40: 471-480.
Cameron AC, Trivedi PK. 2005. Microeconometrics. Methods and applications. Cambridge University Press: New York.
Cameron AC, Trivedi PK. 2010. Microeconometrics Using Stata. Revised Edition. Stata Press: College Station, Texas.
Carey K. 1997. A panel data design for estimation of hospital cost functions. The Review of Economics and Statistics 79(3): 443-453.
Castle NG, Engberg J. 2005. Sta¤ turnover and quality of care in nursing homes. Medical Care 43(6): 616-626.
Castle NG, Engberg J. 2007. The in‡uence of sta¢ ng characteristics on quality of care in nursing homes. Health Research and Educational Trust 42(5): 1822-1847. Castle NG, Liu D, Engberg J. 2008. The association of nursing home compare
qual-ity measures with market competition and occupancy rates. Journal for Healthcare Quality 30(2): 4-14.
Castle NG, Ferguson JC. 2010. What is nursing home quality and how is it mea-sured? The Gerontologist, 50(4): 426-442.
Council of Europe. 1997. Recommendation on development and implementation of quality improvement systems (QIS) in health care and explanatory memorandum (41st meeting, 24-26 June). Strasbourg, Council of Europe.
Cremieux PY, Ouellette P. 2001. Omitted variable bias and hospital cost. Journal of Health Economics, 20: 271-282.
Department of Health. 1997. A …rst class service – quality in the new NHS. London, Department of Health.
Di Giorgio L, Filippini M, Masiero G. 2014. Implications of global budget payment system on nursing home costs. Health Policy, 115: 237-248.
Donabedian A. 1988. The quality of care. How can it be assessed? JAMA 260(12): 1743-1748.
Dormont B, Martin C. 2012. Quality of service and cost-e¢ ciency of French nurs-ing homes. 9th European Conference on Health Economics (ECHE), Zurich, July 18-21, 2012.
Drukker DM. 2003. Testing for serial correlation in linear panel-data models. Stata Journal 3: 168-177.
Evans R. 1971. "Behavioural" cost functions for hospitals. The Canadian Journal of Economics 4: 198-215.
Farsi M, Filippini M, Kuenzle M. 2005. Unobserved heterogeneity in stochastic cost frontier models: An application to Swiss nursing homes. Applied Economics 37: 2127-2141.
Farsi M, Filippini M, Lunati D. 2008. Economies of scale and e¢ ciency measure-ment in Switzerland’s nursing homes. Swiss Journal of Economics and Statistics 144: 359-378.
Forder J, Allan S. 2011. Competition in the English nursing homes market. PSSRU Discussion Paper 2820, University of Kent.
Gertler PJ, Waldman DM. 1992. Quality-adjusted cost functions and policy evalu-ation in the nursing home industry. Journal of Political Economy 100: 1232-1256. Grabowski D. 2004. A longitudinal study of medicaid payment, private-pay price and nursing home quality. International Journal of Health Care Finance and Eco-nomics 4(1): 5-26.
nurs-ing home ownership on the quality of post-acute care: An instrumental variables approach. Journal of Health Economics 32: 12-21.
Gutacker N, Bojke C, Daidone S, Devlin NJ, Parkin D, Street A. 2013. Truly ine¢ ciency or providing better quality of care? Analysing the relationship between risk-adjusted hospital costs and patients’health outcomes. Health Economics 22: 931-947.
Hahn J, Ham JC, Roger Moon H. 2011. The Hausman test and weak instruments. Journal of Econometrics 160(2): 289-299.
Harrington C, Woolhandler S, Mullan J, Carrillo H, Himmelstein DU. 2001. Does investor ownership of nursing homes compromise the quality of care? American Journal of Public Health 91(9): 1452-1455.
Hayashi F. 2000. Econometrics. Princeton University Press: NJ.
IOM. 1990. Medicare: A strategy for quality assurance (Vol.1). National Academy Press: Washington, DC.
Institute of Medicine. 2006. Performance measurement: Accelerating improve-ment. The National Academies Press: Washington, D.C.
Karon SL, Sainfort F, Zimmerman DR. 1999. Stability of nursing home quality indicators over time. Medical Care 37(6): 570-579.
Kendall MG. 1955. Rank correlation methods. Hafner Publishing Co: New York. Kezdi G. 2004. Robust standard errors estimation in …xed-e¤ects panel models. Hungarian Statistical Review Special 9: 96-116.
Konetzka RT, Yi D, Norton EC, Kilpatrick KE. 2004. E¤ects of Medicare payment changes on nursing home sta¢ ng and de…ciencies. Health Services Research 39: 463-488.
Laine J, Linna M, Häkkinen U, Noro A. 2005a. Measuring the productive e¢ -ciency and clinical quality of institutional long-term care for the elderly. Health Economics 14: 245-256.
Laine J, Linna M, Noro A, Häkkinen U. 2005b. The cost e¢ ciency and clinical quality of institutional long-term care for the elderly. Health Care Management Science 8: 149-156.
Legido-Quigley H, McKee M, Nolte E, Glinos IA. 2008. Assuring the quality of health care in the European Union. European Observatory on Health Systems and Policies: Observatory Studies Series No. 12.
McKay NL. 1989. Quality choice in Medicaid markets: The case of nursing homes. The Quarterly Review of Economics and Business 29(2): 27-40.
Mukamel DB. 1997. Risk-adjusted outcome measures and quality of care in nursing homes. Medical Care 35(4): 367-385.
Mukamel DB, Glance LG, Li Y, Weimer DL, Spector WD, Zinn JS, Mosqueda L. 2008. Does risk adjustment of the CMS quality measures for nursing homes matter? Medical Care 46(5): 532-541.
Mukamel DB, Spector WD. 2000. Nursing home costs and risk-adjusted outcome measures of quality. Medical Care, 38(1): 78-89.
Mor V, Berg K, Angelelli J, Gi¤ord D, Morris J, Moore T. 2003. The quality of quality measurement in U.S. nursing homes. The Gerontologist 43(2): 37-46. Mor V, Morris J, Lipsitz L, Fogel B. 1998. Benchmarking quality in nursing homes: The Q-Metrics System. Canadian Journal of Quality in Health Care 14: 12-17. Nakrem S, Vinsnes AG, Harkless GE, Paulsen B, Seim A. 2009. Nursing sensitive quality indicators for nursing home care: International review of literature, policy and practice. International Journal of Nursing Studies, 46: 848-857.
Newhouse JP. 1994. Frontier estimation: How useful a tool for health economics? Journal of Health Economics 13: 317-322.
Nyman JA. 1988. Improving the quality of nursing home outcomes. Medical Care 26: 1158-1171.
Rantz MJ, Hicks L, Grando V, Petroski GF, Madsen RW et al. 2004. Nursing home quality, cost, sta¢ ng, and sta¤ mix. The Gerontologist 44(1): 24-38. Rogers WH. 1994. Regression standard errors in clustered samples. Stata Techni-cal Bullettin 13: 19-23.
Shea J. 1997. Instrument relevance in multivariate linear models: A simple mea-sure. Review of Economics and Statistics 79(2): 348-352.
Spector WD, Selden TM, Cohen JW. 1998. The impact of ownership type on nursing home outcomes. Health Economics, 7: 639-653.
Spilsbury K, Hewitt C, Stirk L. 2011. The relationship between nurse sta¢ ng and quality of care in nursing homes: A systematic review. International Journal of Nursing Studies 48: 732-750.
Starkey KB, Weech-Maldonado R, Mor V. 2005. Market competition and quality of care in the nursing home industry. Journal of Health Care Finance 32(1): 67-81. Stock JH, Watson MW. 2006. Heteroskedasticity-robust standard errors for …xed e¤ects panel data regression. NBER Technical Working Paper 323.
Weech-Maldonado R, Shea D, Mor V. 2006. The relationship between quality of care and costs in nursing homes. American Journal of Medical Quality 21(1): 40-48.
WHO. 2000. The world health report 2000: Health systems: Improving perfor-mance. Geneva, World Health Organization.
Wodchis WP, Teare GF, Anderson GM. 2007. Cost and quality evidence from Ontario long term care hospitals. Medical Care 45: 981–988.
Wooldridge JM. 2002. Econometric analysis of cross section and panel data. MIT Press: Cambridge, MA.
Zimmerman D. 1995. Development and testing of nursing home quality indicators. Health Care Financing Review 16(4): 107-127.
Zimmerman D. 2003. Improving nursing home quality of care through outcomes data: The MDS quality indicators. International Journal of Geriatric Psychiatry 18: 250-257.
Zinn JS, Aaronson WE, Rosko MD. 1993a. The use of standardized indicators as quality improvement tools: An application in Pennsylvania nursing homes. American Journal of Medical Quality 8: 72-78.
Zinn JS, Aaronson WE, Rosko MD. 1993b. Variations in the outcomes of care provided in Pennsylvania nursing homes: facility and environmental correlates. Medical Care 31: 475-487.
Zinn JS, Aaronson WE, Rosko MD. 1994. Strategic groups, performance, and strategic response in the nursing home industry. Health Service Research 29: 187-205.
Structure Process Objective outcome Subjective outcome Room size Sta¢ ng information Mortality rates Resident satisfaction Equipment Mistakes rate Hospitalization Family satisfaction Sta¢ ng levels De…ciency citations RAI quality indicators De…ciency citations Residents case mix RAI quality indicators
Table 1: Classi…cation of quality indicators according to the SPO-framework developed by Donabedian (1988).
Stu dy Quali ty in dicator s Em pir ical strategy (Data) E¤ ects o n cos ts Mu k aml and Sp ector , 2000 Inc iden ce of fun ctional de cli n e Inc iden ce of b eds o res Mortal it y W ei gh ted le ast squares mo dels (Cr os s-s ectional data) In v er te d U-s hap ed In v er te d U-s hap ed In v er te d U-s hap ed Lai n e et al ., 2005 a Prev alen ce of p re ssu re ulce rs Prev alen ce of w eekly use of dep re ssan ts Prev alen ce of d ep res sion w/o treatmen t Sto ch astic fr on ti er m o d els (Cr os s-s ectional data) P osit iv e e¤ ec ts No signi… can t e¤ ec ts No signi… can t e¤ ec ts Lai n e et al ., 2005 b Prev alen ce of d ep res sion w/o treatmen t Prev alen ce of p re ssu re ulce r Prev alen ce of u se of d ep res san ts Prev alen ce of u se of p h ysical res train ts Sto ch astic fr on ti er m o d els (cross-sec tion) No signi… can t e¤ ec ts P osit iv e e¤ ec ts P osit iv e e¤ ec ts No signi… can t e¤ ec ts W eec h -M a ld o n ado et al., 2006 W orsen ing of press ure u lc ers Mo o d d ec line Tw o-s ta ge least sq u ar es mo de ls (Cr os s-s ectional data) In v er te d U-s hap ed U-sh ap ed W o dc his et al. , 2007 Prev alen ce of p h ysical res train ts Prev alen ce of u se of d epres san t Prev alen ce of u rinary incon ti n en ce Inc iden ce of u rinary in con ti n enc e Prev alen ce of sk in ulce rs Inc iden ce of sk in ulcers Prev alen ce of p ai n Rand om and … xed e¤ ects mo d els (P an el data) Negati v e e¤ ects No signi… can t e¤ ec ts P o sit iv e e¤ ec ts U-sh ap ed No signi… can t e¤ ec ts Negati v e e¤ ects No signi… can t e¤ ec ts T a b le 2 : O v er v ie w o f se le ct ed st u d ie s in v es ti g a ti n g th e re la ti o n sh ip b et w ee n co st s a n d q u a li ty in N H s.
Variable Description Obs Mean SD Min Max C Average cost (SFr./Y ) 440 246.90 25.66 179.48 377.52
Y Annual resident days 519 25434 10231 8955 64275
Pl Average labor price in SFr. per 519 80817 5196 63363 97512 employee per year
Pk Average capital price in SFr. per 440 5735 2528 1054 22981 bed
Pm Average material price in SFr. 440 9.23 4.74 5.16 103.25 per meal
M IX Average dependency index 519 3.10 0.34 0.80 3.83
SR Nursing sta¤ ratio 519 0.96 0.09 0.74 1.55
Notes: All monetary values are in 2005 Swiss francs (SFr.), adjusted by the national Consumer Price Index.
Quality indicator Description Obs Mean SD Min Max PROCESS
QdepressionN T PR of depression symptoms 173 31.45 12.54 3.6 60.0 without treatment
Qdrugs Prevalence of use of 9 173 41.46 14.30 0.0 75.0
or more medications
Qcatheters INC of indwelling catheters 173 5.38 5.25 0.0 27.9
Qgavage PR of enteral feeding 130 1.46 2.67 0.0 17.5
QantipsyHR PR of antipsychotic use - HR 173 51.47 23.22 0.0 100.0 QantipsyLR PR of antipsychotic use - LR 173 31.67 12.45 7.7 87.5 Qrestraints PR of daily physical restraints 173 19.56 9.76 0.0 50.0 Qactivity PR of little or no activity 173 52.73 19.74 6.7 100.0 Qprocess Composite indicator (using No. exposed) 173 25.83 5.01 12.9 40.3 Composite indicator (using PCA) 130 0.00 1.15 -3.6 3.2
OUTCOME
Qinjuries INC of injuries 159 2.39 6.64 0.0 50.0
Qf alls PR of falls 173 9.20 5.70 0.0 24.4
QbehaviourHR PR behavior problems - HR 173 34.44 13.80 0.0 78.9 QbehaviourLR PR behavior problems - LR 173 15.30 13.33 0.0 70.0 Qdepression PR of depression symptoms 173 56.41 16.47 14.8 100.0 QincontinenceHR PR of bowel incontinence - HR 173 80.23 19.86 0.0 100.0 QincontinenceLR PR of bowel incontinence - LR 173 30.54 19.40 0.0 100.0 Qincontinence PR of bladder incontinence 173 59.88 25.91 0.0 100.0
without a toileting plan
Qweight PR of weight loss 173 6.75 5.10 0.0 27.3
Qbedf ast PR of bedfast residents 172 8.48 6.75 0.0 29.6
Qlos Incidence of decline in late- 154 30.79 26.12 0.0 100.0 loss activities of daily living
QulcersHR PR of pressure ulcers - HR 173 11.67 9.24 0.0 50.0 QulcersLR PR of pressure ulcers - LR 173 2.90 5.01 0.0 28.6
Qpain PR of important pain 173 21.24 11.99 0.0 61.1
Qoutcome Composite indicator (using No. exposed) 173 17.68 4.08 6.8 28.6 Composite indicator (using PCA) 153 0.00 1.16 -2.7 3.0 Notes: INC=incidence, PR=prevalence, HR=high-risk, LR=low-risk
Model 1 Model 2 Model 3
Composite quality indicators Single quality indicators
using PCA using No. exposed
Coef. Std. Err. Coef. Std. Err. Coef. Std. Err.
Constant -3.212 0.470 -3.477 0.505 -3.621 0.541 Y 0.718 0.038 0.736 0.041 0.751 0.046 Pl 0.907 0.025 0.911 0.025 0.916 0.026 Pk 0.068 0.015 0.067 0.015 0.059 0.015 M IX 0.203 0.065 0.202 0.064 0.219 0.079 SR 0.464 0.059 0.482 0.066 0.480 0.071 Qprocess -0.002 0.004 -0.048 0.070 Qoutcome 0.006 0.003 0.240 0.094 Qantips 0.026 0.025 Qrestr -0.064 0.042 Qpain 0.056 0.027 Qweight 0.102 0.043 t 0.003 0.002 0.006 0.002 0.005 0.002 R2 0.977 0.977 0.980 N 173 173 163
Notes: Signi…cance levels: * = 10%, ** = 5%, *** = 1%.
Table 5: Estimated coe¢ cients of …xed e¤ects models with composite and single quality indicators.
Model 3 (Single quality indicators)
OLS Random e¤ects
Coef. Std. Err. Coef. Std. Err.
Constant -4.546 0.439 -4.657 0.328 Y 0.875 0.017 0.853 0.019 Pl 0.874 0.040 0.910 0.027 Pk 0.062 0.015 0.059 0.013 IF -0.009 0.014 -0.007 0.015 M IX 0.277 0.081 0.254 0.060 SR 0.485 0.089 0.513 0.069 Qantips 0.033 0.054 0.034 0.025 Qrestr -0.119 0.048 -0.071 0.040 Qpain 0.076 0.046 0.061 0.028 Qweight -0.061 0.087 0.098 0.044 t 0.003 0.002 0.006 0.002 R2 0.984 0.982 N 163 163
Notes: Signi…cance levels: * = 10%, ** = 5%, *** = 1%.
Table 6: Estimated coe¢ cients of OLS and random e¤ects models with single quality indicators.